BIM Metrics
Document
type: Micro-report
Author:
Tahir Ahmad
Publication
Date: 14/03/2017
-
Read the full document
Introduction and Industry Context
Crossrail’s contractual structure presented the Information Management team with a unique problem of having to manage data deriving from disparate sources; which in turn derived from differing processes and procedures.
With 23 design contracts, 34 enabling works contracts, 56 construction & logistic contracts the complexity of packaging the information and creating relationships between different types of data was immense.
The Technical Information (which can be referred to as BIM) strategy was launched in 2008 to mitigate for the risks of an unstructured and uncontrolled data landscape by clearly defining the parameters of the deliverables which Contractors and Crossrail staff had to provide. From this the Crossrail BIM Principles were derived.
This was further refined in 2011, upon the advent of BIM (Building information Modelling) being mandated by the government as a standard for public sector construction projects. This was created to create efficiencies in capital expenditure and operational expenditure through the enhanced usage of asset information management and collaborative practices (see related BIM journal article).
A key component to BIM is the use of a Common Data Environment (CDE) as a single repository of information for managing data and for applications to leverage information from.
It was from these applications, utilising data within the CDE, that Crossrail began to make significant progress in creating metrics for BIM performance.The Technical Information Requirements
Initial set-up
To ensure that this was being delivered in a timely fashion and to standard, the Technical Information team launched an initiative to provide monthly performance report dashboards that assessed a contractor’s performance in meeting Crossrail’s technical information requirements.
The technical information dashboard consisted of subjective assessments of a contracts performance. Each team within the Technical Information department were given the task of creating measures and writing bullet point based reports highlighting activity of note within the last financial period (4-week period).
As there were 5 teams in which 5 managers led the task to provide their part of the report: the writing style, interpretation of data and consistency varied from team to team.
A common theme amongst the teams was a metric on how well a contractor was engaging with them. As such, this metric was largely about assessing working relationships rather than deliverables.
The 5 managers’ reports then subsequently fed into a matrix chart of performance scores assigned to each contact based upon performance in a certain parameter.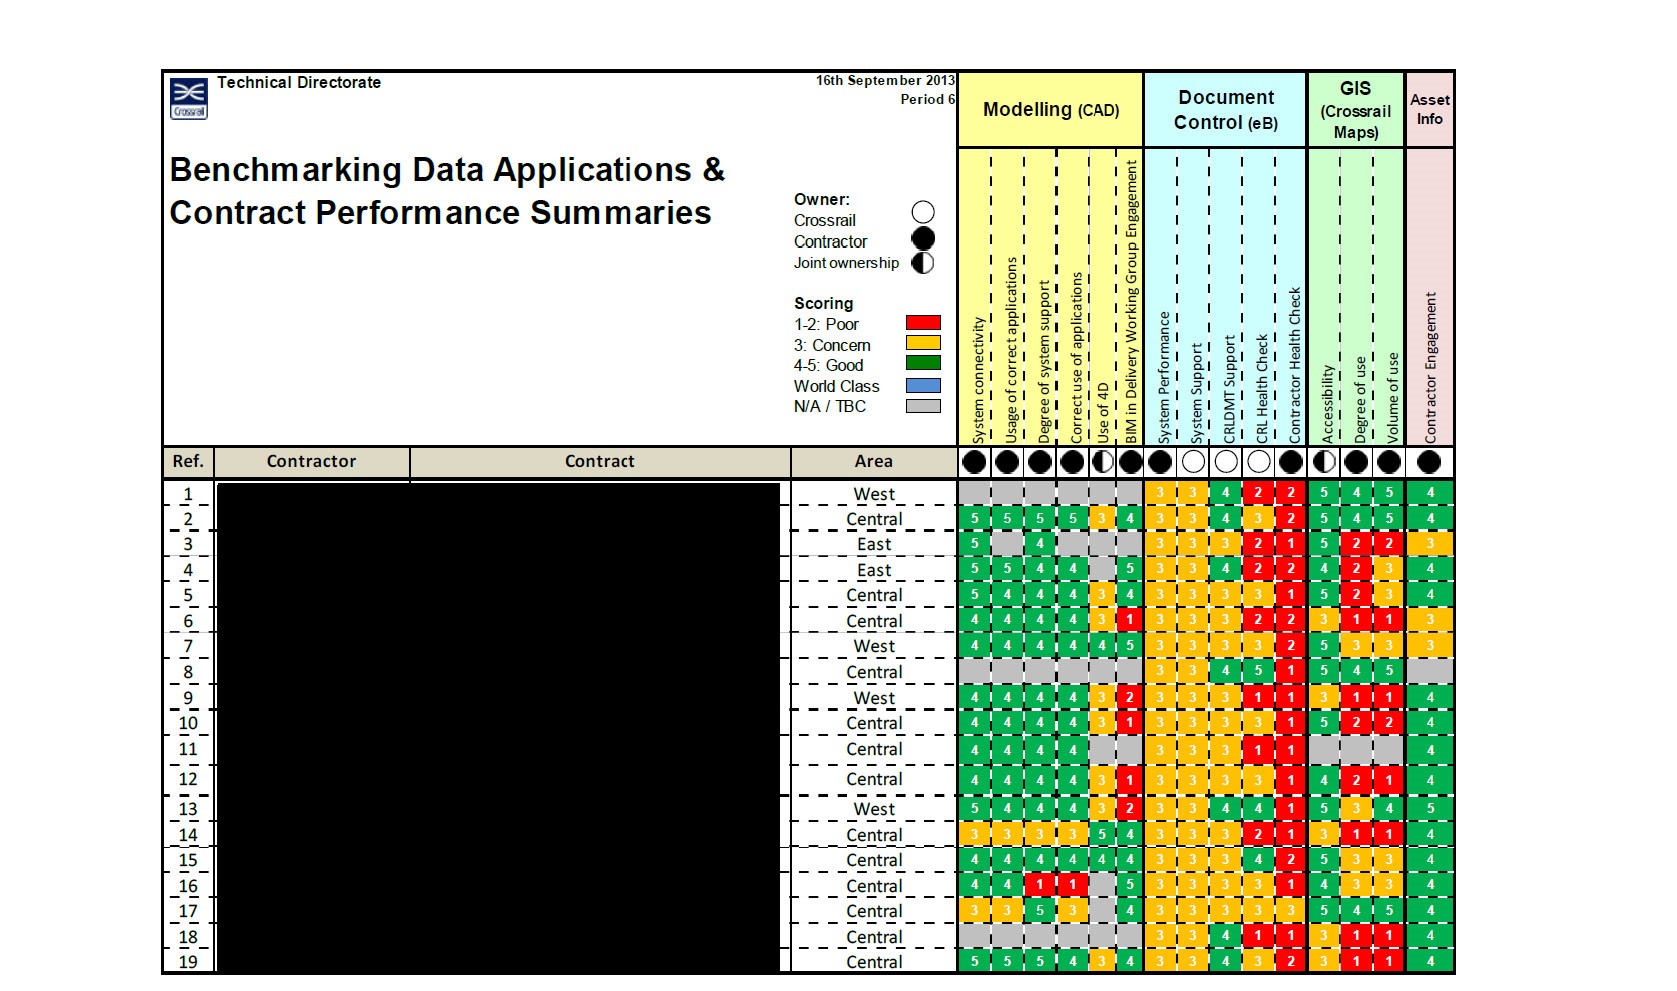
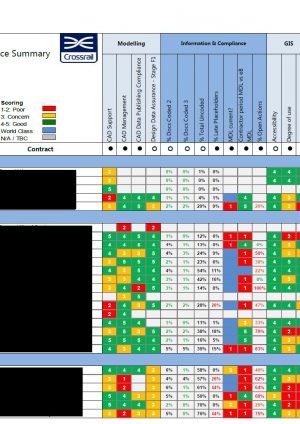
Figure 1 – Initial Benchmark Data and Contract Performance Summaries
When this chart was launched in front of an audience of Chief Executives of Contractors and Supply Chain by Crossrail’s Chief Executive, a number of individuals immediately reacted as to why their numbers were low or why their score was highlighted in Red.
The challenging nature in which the information was presented sparked dialogue in a commercial-implication free environment. Despite the launch being a part of a one-off event for Senior Leadership on the Crossrail project, the theme of open dialogue has continued as a subsequence of reports being produced ever since.
Owing to the visibility of the reports and the easy to understand nature of the Red, Amber and Green (RAG) themed chart, further queries were received debating the accuracy of the information being reported.Development of the Metrics
Given the challenging debate and difficulty in justifying the metrics created in a subjective manner, this led the Technical Information Department to move away from producing qualitative (subjective) reports, to using quantitative metrics derived from Crossrail’s business systems. Essentially, utilising checked and recorded facts from databases and business systems, as opposed to the opinions of those conducting site visits. This created a more accurate portrayal of technical information management performance.
As a result, the Crossrail’s Technical Information Department developed the process into reporting the following metrics on a monthly basis, sub-categorised by team within the Technical information department, based upon outputs Crossrail’s Electronic CAD Management System (ECMS) and Electronic Document Management System (EDMS.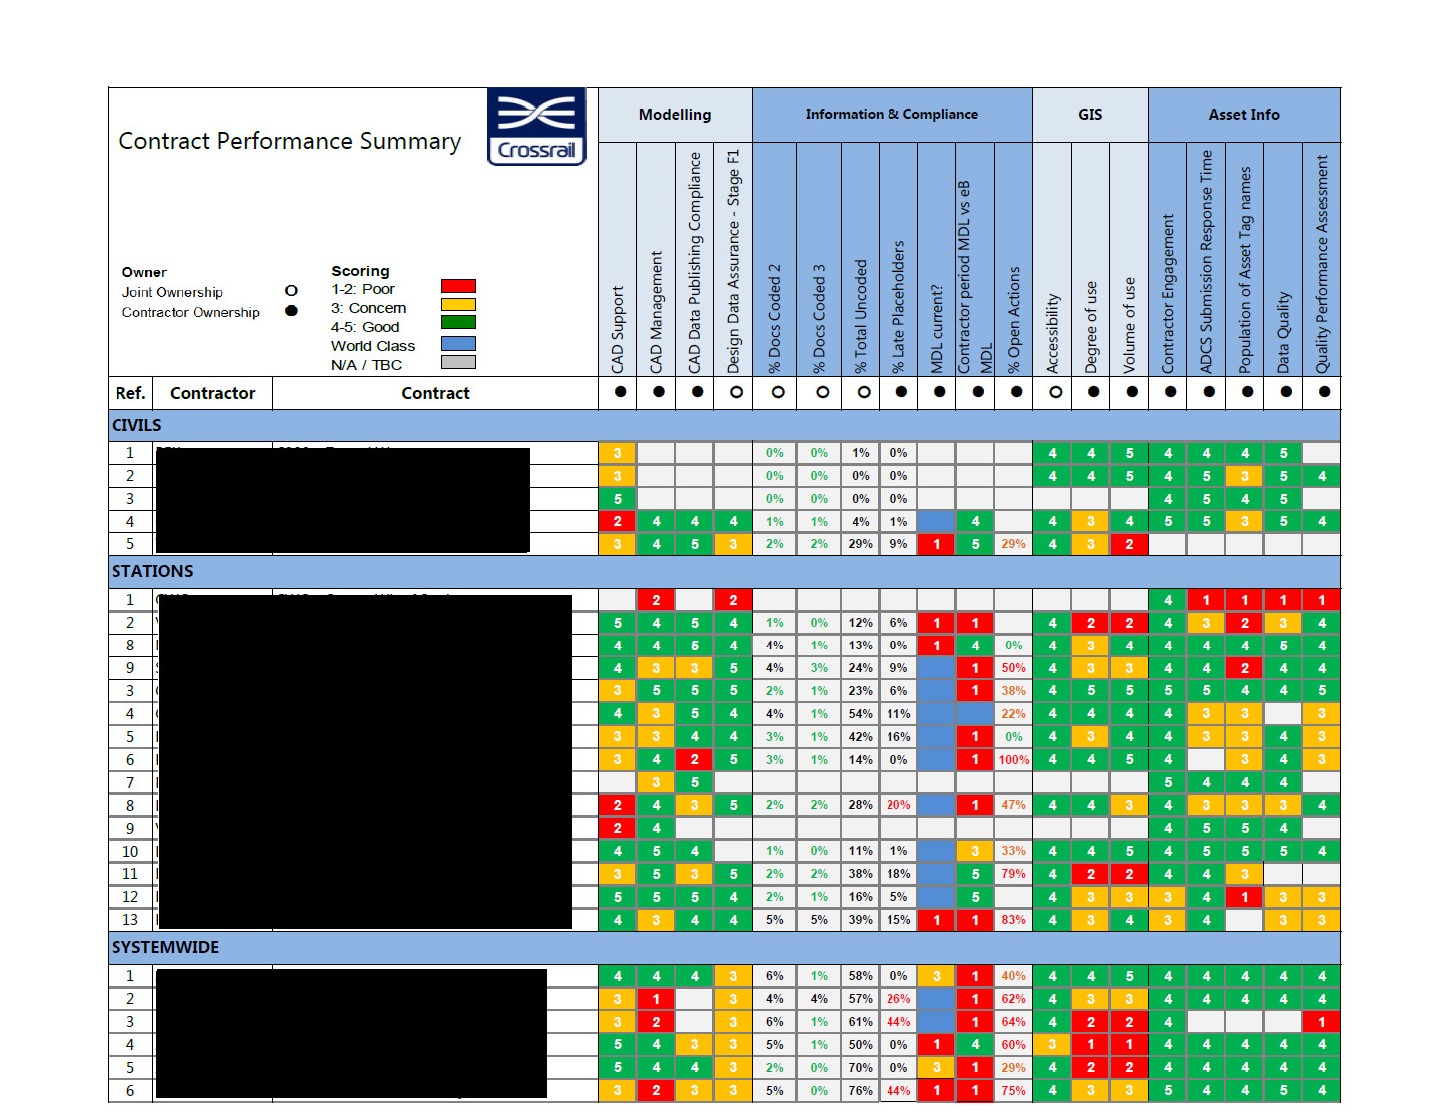
Figure 2 – Contract Performance Summary by Team Metrics
Metric Definitions
CAD Metrics
The CAD team’s metrics are complicated as there is no defined goal a contractor should reach to complete their deliverables owing to the nature of Crossrail’s design method i.e. not design and build. The data used was based on weighted metrics derived from data from Crossrail’s ECMS, ProjectWise and the bespoke call management system the CAD team developed.
Data Control and Compliance Metrics
The Data Control and Compliance team’s metrics are based upon outputs of Crossrail’s EDMS, eB.
GIS Metrics
The GIS team’s metrics are based upon usage and functionality utilisation information from Crossrail’s Geographical Information System, formerly Bentley Maps and as of July 2016, Esri ArcGIS.
Asset Information Metrics
The Asset Information metrics are based upon data extracted from Crossrail Asset Information Management System (AIMS), a node of eB – Crossrail’s Electronic Document Management System (EDMS).
All of the metrics outlined above are detailed in the metric definition document
Lessons Learned
- The purpose of metrics should not be for the sake of metrics itself. As was the case initially for Crossrail. Simplistic questions such as ‘what added value can be obtained?’ or ‘what resulting actions are required?’ should be the basis of actionable metrics.
- Metrics and dashboards should not be used to demonise contractors or staff, but to bring awareness to gaps in performance and for usage as a platform for collaborative improvements.
- Metrics should be based on data that can be evidenced and justified to those wishing to verify the validity of certain scores.
- The coordinator of the dashboard should not sit within the teams in which the data is derived from so that impartiality and objectivity can be maintained. This was evidenced by a number of team members becoming very attached to what they produced, but unable to see the ‘big picture’, as detailed in point 1.
- Metrics should be reviewed every 6 months as to whether they are still valid considering the stage of a project.
-
Authors

Tahir Ahmad - Crossrail Ltd
BIM Co-ordination Specialist, Crossrail
Tahir Ahmad is the BIM Coordination Specialist for Crossrail in London. His current responsibilities include BIM performance analysis and improvement and management of the Crossrail BIM Information Academy: Enabling BIM strategies to work in practice.
Tahir is utilising his information management and business analysis background to launch and lead initiatives to champion BIM for Crossrail, extolling the efficiencies and outcomes integrated Engineering Information management can create. Leveraging the value of interoperable and accessible data sets allows informed, smart infrastructure management at every stage of a project from design to operations.