Crossrail Western Running Tunnels. Crossing of London Underground: Victoria Line and Bakerloo Line Assets.
Document
type: Technical Paper
Author:
Gema Araque, Ignacio Menoyo, Marios Vironos, Sam Chernanko, Sergio Pellicer, Daniele Fornelli, ICE Publishing
Publication
Date: 03/11/2014
-
Read the full document
Introduction
The C300 Crossrail Western Running Tunnels project, includes the excavation of new twin-bore tunnels 6.8 km in length under central London with two TBMs.
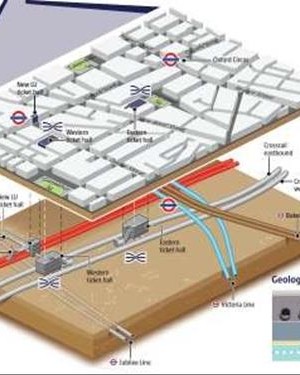
The TBM’s were launched from the Royal Oak Portal, heading eastwards on an alignment that crosses through central London, via Paddington, Bond Street, Tottenham Court Road and Farringdon Stations. The crossing of the Victoria and Bakerloo Lines represented one of the more complex and challenging asset interfaces in the project.
The operation and control features of the TBM were designed to minimise sub-surface and ground level settlement at source. Ground loss arising from the TBM boring and tunnel
construction operations was contractually limited to a maximum of 0.7% of excavated volume at the location of the Victoria and Bakerloo Line assets.The TBM operating principles govern the use of the TBM in order to meet the specified volume loss requirements as well as asset protection displacement limits. This is achieved through close co-operation between the construction and monitoring teams, this is focused in the project control room. In the control room, trend analysis of the TBM parameters is undertaken 24/7 to anticipate any deviation from the specified parameter limits and targets to minimise settlements. An exhaustive monitoring regime of ground and asset movements allows the control room to monitor against the effects of the tunnel construction.
Figure 1. Location. Detail of Westbound and Eastbound Crossrail Tunnel crossing Bakerloo and Victoria Line.
The VL and BK Line assets are located between Bond Street and Tottenham Court Road these two stations (see figure 1). WB and EB Crossrail tunnels cross below VLNB (including cross-passage), Regent Street Sewer, BKNB and BKSB from west to east in 110m and a maximum clearance of 6m (please refer to Table 1).
The relevant information realting to the asset crossing dates, locations and clearances are shown below in table 1.
In reference to Eastbound TBM, the second drive, it arrived to Victoria Line NB’s Zone of Influence the 2nd of July 2013 advancing ring number 2370, going below Regent Street Sewer and Bakerloo Line NB in only 25 rings more and exiting from all the assets’ Zone of Influence in ring number 2432 which was reached the 6th of July 2013. In Total 63 rings were built and 100.8 meters were advanced.
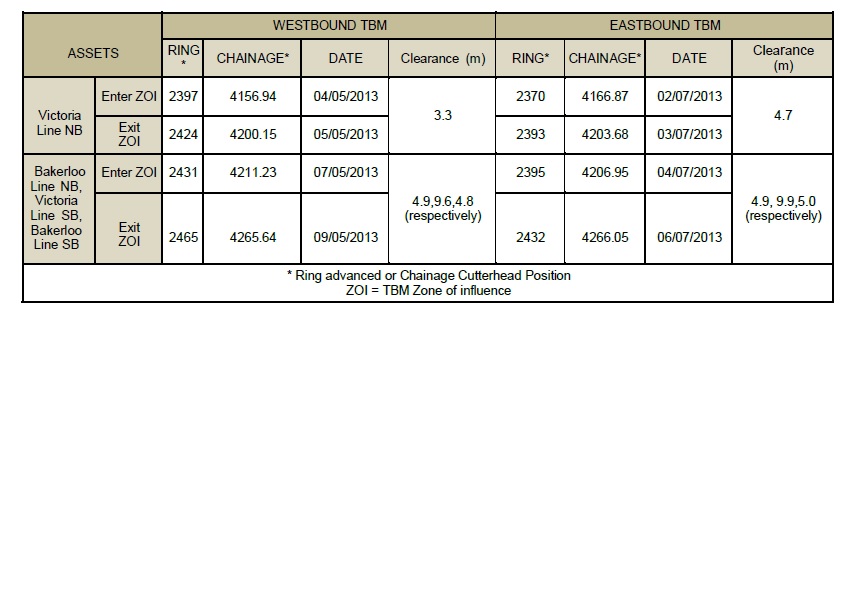
Table 1 – Assets Location and Dates reached. Summary table describing ring numbers, chainages and dates for each asset.
Assets under Study
Victoria Line south of Oxford Circus
The LU assets at this interface comprise the VLNB and VLSB running tunnels. A cross passage exists between the running tunnels which is located south of the CRL WB tunnel, displacements from this asset are not analysed in this paper.
The VLNB tunnel linings are mostly constructed from flexible cast iron segments with radial knuckle joints and the VLSB linings are mostly constructed from bolted cast iron segments. The crown of the VLNB and VLSB tunnels are approximately 20m and 16m below ground level and the tunnels are located within the London Clay. The interface is located south of Oxford Circus, east of Hanover Square. At the sub-surface level, the Victoria SB running tunnel crosses over the Bakerloo line running tunnels and passes below the Regent Street sewer. Figure 2 shows the position of the VL NB at the Crossrail interface
Bakerloo Line south of Oxford Circus
The LU assets at this interface comprise the BKNB and BKSB running tunnels. The location of the interface between the proposed Crossrail tunnels and the existing Bakerloo line is between Oxford Circus station and Piccadilly Circus station beneath Regent Street.
The tunnel linings are bolted cast iron segments.
The crown of the BKNB and BKSB tunnels are approximately 24m below ground level and the tunnels are located within the London Clay. At the sub-surface level, about the WB TBM crossing, the BKNB and BKSB tunnels lie underneath the VLSB tunnel.
Figure 2 shows the positions of the assets in section.
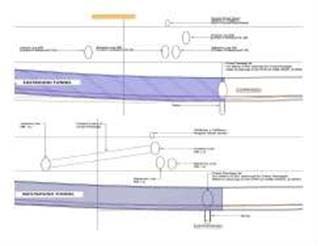
Figure 2. Section through LU assets showing vertical position relative to CRL western running tunnel.
TBM Parameters
TBM Characteristics & Parameters
The tunnel machines are an EPB type constructed and built by Herrenknecht AG, Schwanau, Germany. Earth Pressure Balance shields (EPB shield) are preferably used for cohesive soils with high clay, mud or silt contents which are characterised by low water permeability. The whole C300 route is covered by the London Clay formation. It is heavily over-consolidated and it decreases its thickness from west to east.
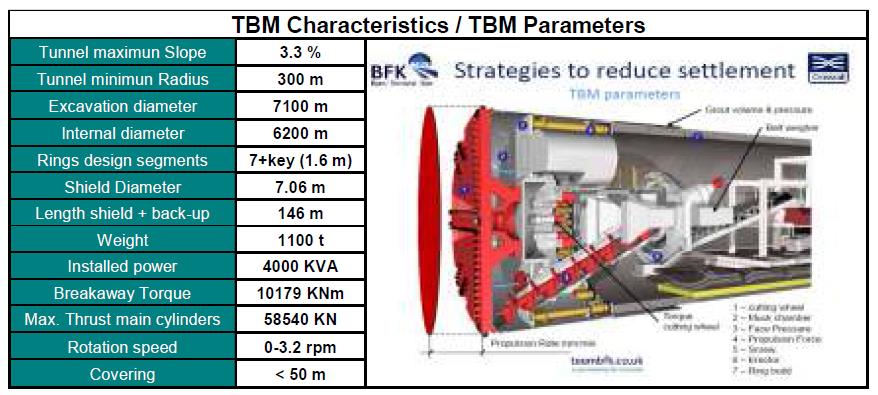
Figure 3. TBMs Characteristics/Parameters. Main characteristics of the TBMs.
The critical parameters that are required to control settlements at source during the excavation are: Pressure in the working chamber, grout injection (pressure and volume) and quantity of excavated material.
EPB face pressure
The soil excavated by the cutting wheel serves as the support of the tunnel face to avoid settlement, for that reason the ground excavated by the cutting head is mixed and accumulated under pressure in the cutting chamber. The ground is then extracted in a controlled manner with a screw conveyor. For controlling the stability of the tunnel face, there are installed earth pressure sensors which permit the face support pressure to be controlled precisely with continuous measurements. Shield advance speed and screw conveyor speed are the support pressure control variables (see appendix 7.2).
Grout Injection
The diameter of the cutter head is 7.1 m and the external diameter of the ring is 6.8 m. For that reason a gap is generated per advance at the back of the shield and control of surface settlement behind the TBM is also critical. The injection of grout is an effective tool in preventing potential surface settlement. Inadequate grouting of the void around the segments is a common cause of the settlements behind the TBM. Continuous grouting of tail void should be performed as TBM advances in order to compensate for volume loss.
For the C300 works, a two component cement grout (with additives) is used. They are mixed combining a retarded grout with an accelerator and injected by four grout lines (two on the crown and two on the invert), filling the gap between bored diameter and outer ring diameter. The procedure of the injection must be controlled taking into account the pressure, that depends on the pressure existing outside of the shield (see appendix 7.3) and the theoretical grout volume to fill the gap (4.8-5.2m3).
Scales
Tunnel face support is achieved through balancing of the ground pressure in front of the TBM with the pressure inside the chamber. When the required chamber pressure is reached the excavation progresses maintaining the pressure and monitoring the volume of excavated material. The goal is to maintain the same volume of material extracted from the excavation chamber as the volume of the material excavated at the tunnel face. Two belt scales are installed on the belt conveyor to measure and monitor continuously, the volume of the excavated muck per advance to achieve a correct control of the weight of excavated material to avoid the cutter head over-excavation.
Other Parameters
Other mechanical parameters are involved for keeping the above mentioned parameters within designed limits/targets, these are: Propulsion Force (Thrust per advance) and Cutting wheel Torque (or moment of force of the cutting wheel per advance).
The TBM is equipped with 22 pairs of thrust cylinders divided into 4 groups, pushing the machine forward whilst reacting against the last ring built. In each group one cylinder is equipped with a measurement system to visualise the average length of this thrust cylinder group during the advance. The measured pressure and extension length of the cylinders will be recorded at the PLC system of the TBM. By regulating the pressure at the different cylinder groups the machine will move forward at different speeds. The maximum advance force of the main thrust cylinders is 58,540 kN at a hydraulic pressure of 350 bar. The double cylinders with a maximum stroke of 2,500mm are connected with steel plates at their free ends, which are covered with plastic plates to reduce damage on the surface of the built-in segments.
The machine is designed to work with a nominal torque of 7020 KNm at 2.4 rpm, a value which is related with the rotation speed and the ground (foam injection).
Excavated material should be a homogenous mix of coarse and fine particles, improving overall plasticity of the material to make it conveyable and avoiding the adhesion of clay particles into the metallic structure of the cutting wheel or its tools. Required physical properties of an excavated material are achieved through conditioning it with a foam solution which consists of water with the addition of a polymer in a percentage of 3 %, creating a material of paste-like consistency. Air bubbles are generated and the grain friction is reduced. Additional benefits of ground conditioning include reduced water permeability of conditioned ground as well as reduced stickiness of the materials, providing efficient mining.
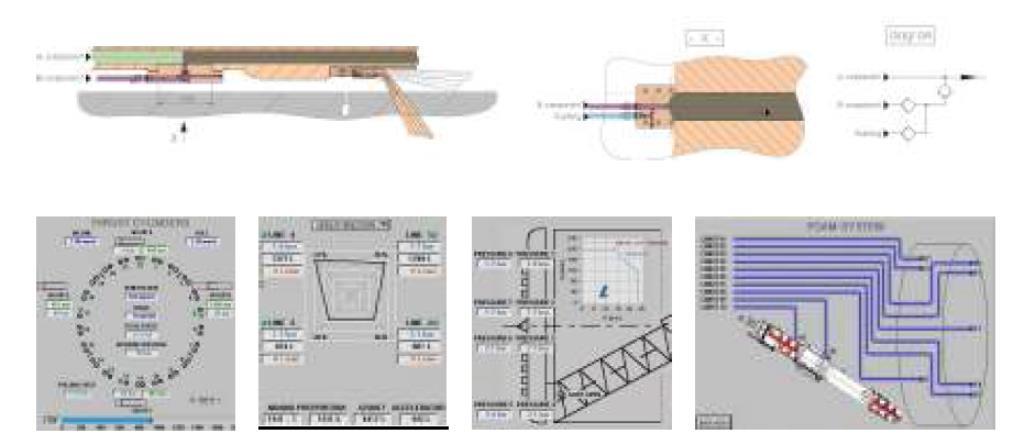
Figure 4. Principle of grout injection & PLC system to monitor TBM parameters.
Figure 4 shows the injection grouting in the gap generated by the excavation and a summary of the interface of the software installed to monitor the TBM parameters.
TBMs Parameters designed-observed
TBM monitoring data is analysed and during the daily Shift Review Group (SRG) the Drive Parameter sheet is provided to limit the values described before and summarised in the table below:
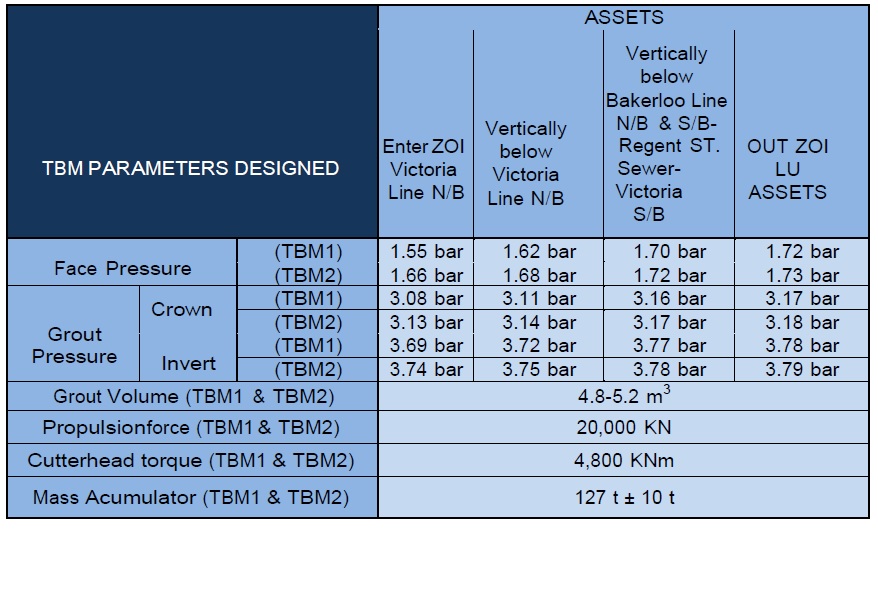
Table 2. TBM Parameters design. Limits for both TBMs.
As mentioned above, all these parameters are designed in relation with the ground the TBM is advancing through and all the assets involved. Under all the parameters described, the observed values are analysed in the graphs attached below.
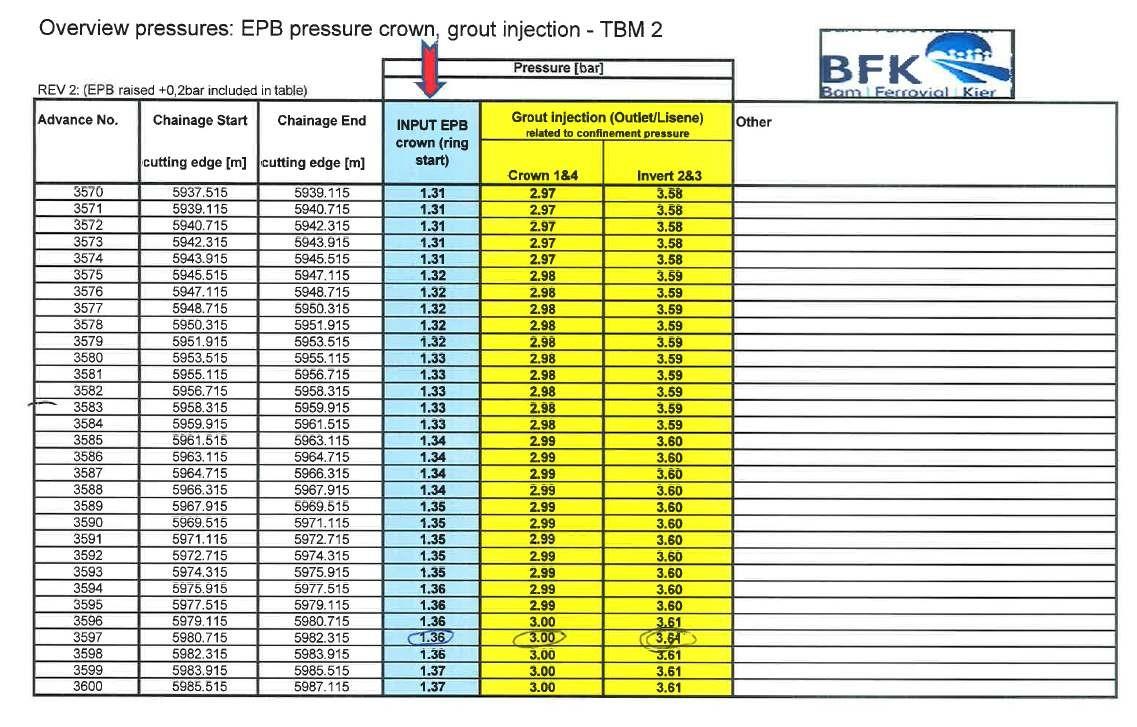
In westbound TBM the EPB face pressure designed for this area is between 1.55 – 1.72 bar and 1.61 – 1.73 bar in case of eastbound TBM. It is necessary to understand that these values are the minimum pressures required to keep support at the face, in others words it is the minimum value to avoid any settlement. As the graphs are showing, the EPB face pressure value in westbound TBM is always above the target defined and around 0.2 bar plus. Sensors 1 and 8, locates in crown showed an EPB average value of 1.95 bar in eastbound TBM. This means the EPB face pressure was maintained correctly through the area under study.
The grout pressures values are similar to the EPB values. The target pressure assumed in the crown for grouting is between 3.08 – 3.17 bar in westbound TBM and 3.17 – 3.18 bar in eastbound TBM. In the invert, grout pressure for westbound TBM is between 3.69 – 3.78 bar and 3.78 – 3.79 bar for eastbound. The grout pressure graph is showing the values reached in the area studied and the grout pressure triggers values in the crown and the invert. These triggers values are the maximum and minimum values permitted to reach in the area established in the TBM operating procedure for EPB mode tunnelling 50% of the target pressure. This is achieved in the case of eastbound TBM with an average of 2.32 bar in crown and 2.55 bar in the invert.
Low grout pressure must also be avoided to avoid any settlement at the back of the shield. The lowest grout pressure values must be approximately 0.5 bar plus the EPB Face Pressure value – in the case of westbound TBM, this is approximately 1.7 bar. As the graph is shows there are some rings with less than 1.7 bar. The worst case, around ring number 2418, the reason of this low grout pressure is due to problems with the brushes in the bottom of the shield, and the grout and the pressure were lost by the invert. TBM was stopped to change the brushes and solved the problem as soon as possible.
In the grout volume graph, the observed volumes show all the rings are injected with the correct values. There are a few points in both TBMs with high and low values through the target. All these points are due to short or long advance and the grout volume injected is a little lower or higher than usual. This is confirmed by the average volume of 5.01m3 per ring achieved in the eastbound TBM.
Is necessary to focus special attention in mass accumulator values as it’s a parameter providing direct information of the material is extracting from the face. In the area the study is focused on, the material shoved is always the same, London Clay Formation. With a density of 2 t/m3, the weight exported per 1.6 m of standard advance is around 117 (minimum target) and 137 tonnes (maximum target). In the graphs, all the values reached per ring are between the given triggers per standard advance, with a difference maximum of 2% between scales. Eastbound TBM is the machine that shows higher values with an average of 135 t.
In the rest of the parameters, the values designed are the same for both TBMs due to the same characteristics. Eastbound TBM achieved an average thrust of 17868 KN which is below the established limit of 20000KN. The same happens with the average torque of 3360 KNm which it is well within the limits of 4800 KNm. If we compare the thrust, torque and foam, we find that we have had an increase in the torque and the thrust if the foam injection decreased.
As shown by the graphs below, all observed parameters were within triggers.
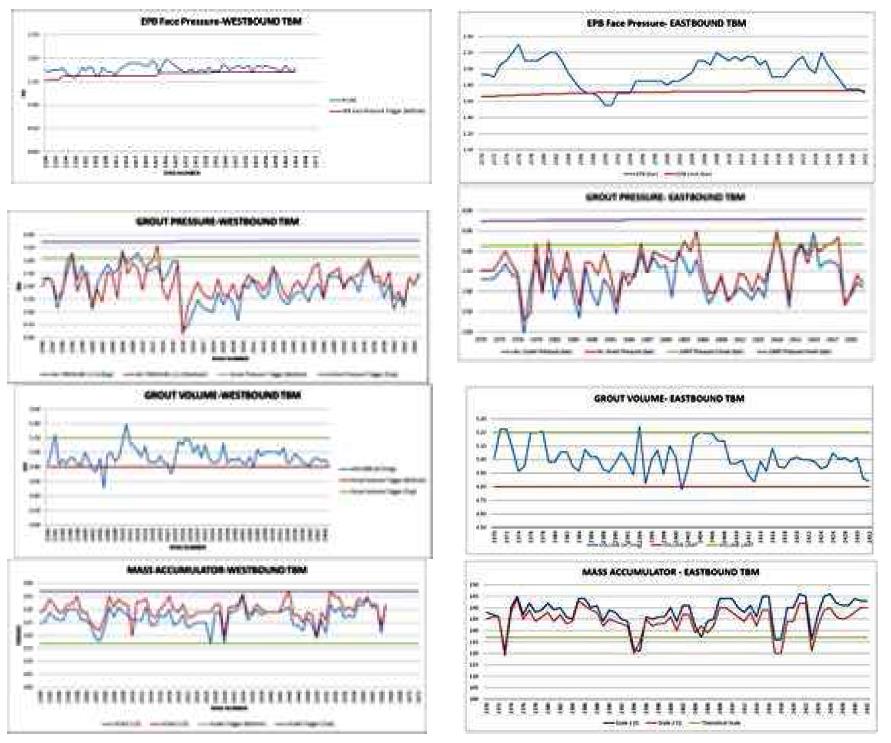
Figure 5. TBMs Graphs. Comparative of the main parameters reached in both TBMs.The WB TBM stopped on 05/05/2013 for 54 hours approximately 25m short of the VLSB by as the TBM crew were required for other works. WB TBM stopped at ring number 2425 (from 05/05/2013 at 10:30 am to 07/05/2013 at 17:20 pm) as the TBM crew were required for unrelated maintenance.
Instrumentation and Monitoring (I&M)
Introduction to I&M
The monitoring installed inside the Victoria and Bakerloo lines comprise of Electro-level beams, PLP’s (Precise Levelling Point), Tilt sensor arrays, Basset Convergence Systems, 3D Geodetic Prisms, Manual Track Survey’s and Retro Reflective Targets in both the North and Southbound running tunnels of the Victoria & Bakerloo lines south of Oxford Circus Station. This paper utilises data from the electro-levels for analysis of movements as these instruments provide the best accuracy and repeatability of all of the above instruments in these assets. Manual track surveys are also analyses to act as a confirmation of the electro-levels, these surveys are also required to check against the twist geometry of the tracks during passage.
An Electro-level Beam Sensor is attached to a rigid beam for installation in to the tunnel and measures rotation of structures in the direction perpendicular to the long axis of the beam. A beam provides a tilt reading, this tilt reading is then multiplied over the length of the beam providing differential vertical displacement for that beam. Both ends of the beam are ?xed using anchor bolts, multiple beams were placed end to end along the tunnel, allowing a displacement pro?le of the structure to be calculated from anchor point to anchor point. This can be seen in figure 6 below which shows the typical installation of electro-level beams in the Victoria and Bakerloo Line tunnels. Settlement
A data logger installed in the asset to allow real-time reporting from the electro-levels, provided readings every 30 mins during the passage.
Manual track surveys were executed using a 3d geodetic prisms and total station, where a reading is taken on the top of each rail along the track. These readings were taken nightly during engineering hours.
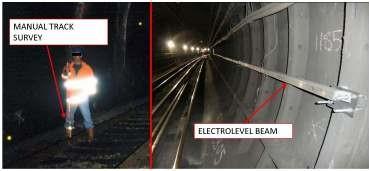
Figure 6 – Examples of instrumentation and monitoringAssets Displacements
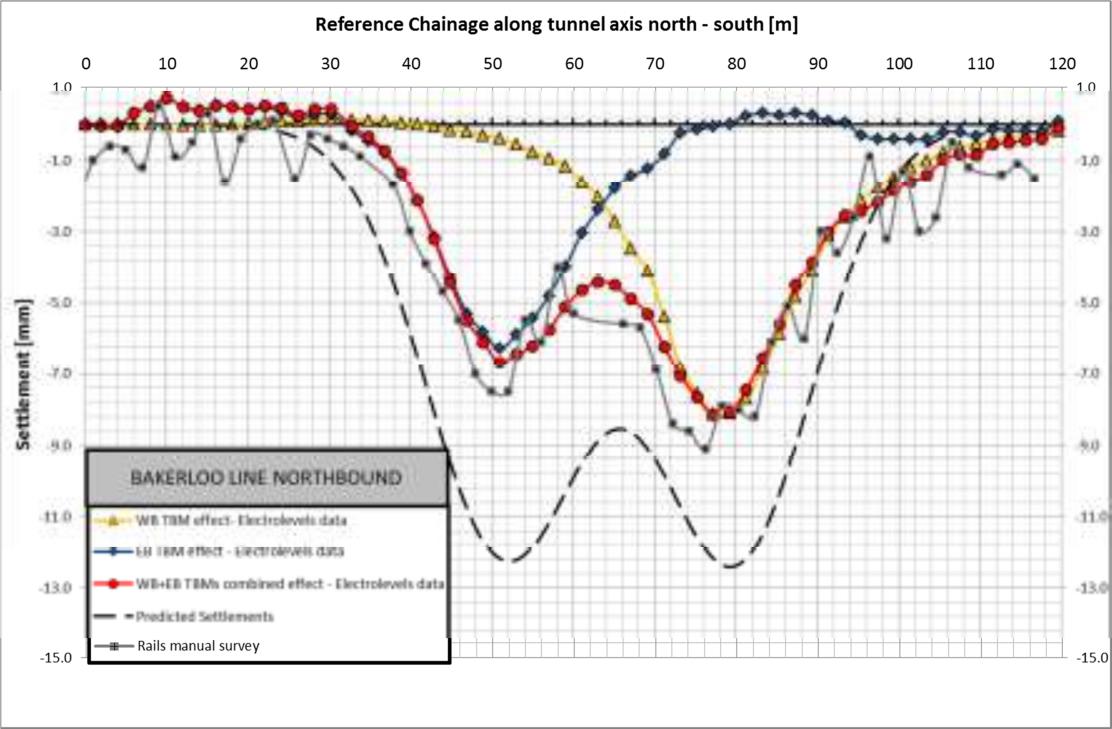
Victoria Line Northbound
The chart shows the settlement’s caused by the passage of both WB and EB TBM’s separately and their combined effects as recorded by the electro-levels. Induced settlements in the Victoria Line NB (VNB) varied between drives with the electro-levels recording an initial maximum 13.2mm of settlement due to the WB passage and 7.8mm due to the EB passage. When considering the settlements at the locations of the TBM crossings due to both TBM’s, the WB recorded 13.2mm and the eastbound 8.4mm. The difference can at least partly be attributed to the differences in minimum clearance between the WB and EB CRL tunnels and LU tunnel at crossing of 3.3m and 4.7m respectively. However, this amounts to 97% and 68% of predicted settlements for the WB and EB respectively at the locations of the observed maximum settlements on the electro-levels.
However, the maximum WB settlement does not occur at the predicted locations i.e. the location in where the CRL and LU tunnels intersect in plan – there is an offset of 4.4m. It was likely that there was an error in the calculation of the electro-level’s as a correction by the monitoring sub-contractors can be observed after the crossing of the WB drive occurring along the entire string of electro-levels – this consists of correcting each electro-level by introducing an offset in the value in each electro-level between two readings depending on the magnitude of error in that beam. This appears to have corrected the values for the EB passage, whose settlements do occur at the predicted location at the EB crossing.
When comparing the electro-level values to the manual rail survey, the recorded displacements are comparable, this is the case for all of the LU tunnels. The rail survey has a lower accuracy and precision than the data provided by the electro-levels, however the manual rail survey is more reliable, partly because BFK do not calculate and report the electro-levels and partly due to the fact that it is a manual reading.
For the WB passage, the rail survey shows the location of the observed maxima better fits with the location of the predicted maxima, this further supports the error in the electro-levels as described above.
The rail settlements amount to 84% and 72% of predicted settlements for the WB and EB respectively at the locations of the observed maximum settlements on the. The EB, we can conclude that the displacement results are comparable given the manual precision of +/-1mm (difference in maximum settlements. If we consider that the WB maximum settlements recorded from the electro-levels were of the correct magnitudes but that the actual true location of this was over the predicted maximum, then we can conclude that 81% of predicted settlements due to the WB passage were recorded by the electro-levels – this is comparable to the manual rail survey.
However, one should consider that the manual rail survey reported a higher settlement than the electro-levels over the same period for the VNB, VSB and BKNB (exception was BKSB).
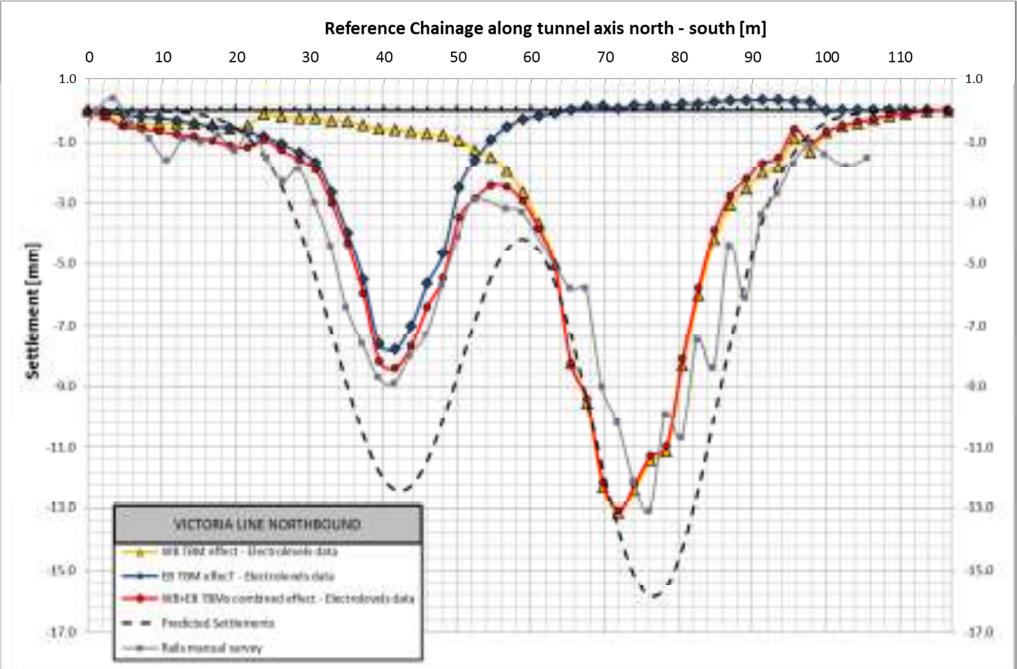
Figure 7 – TBM induced and predicted displacement profile in Victoria Line Northbound
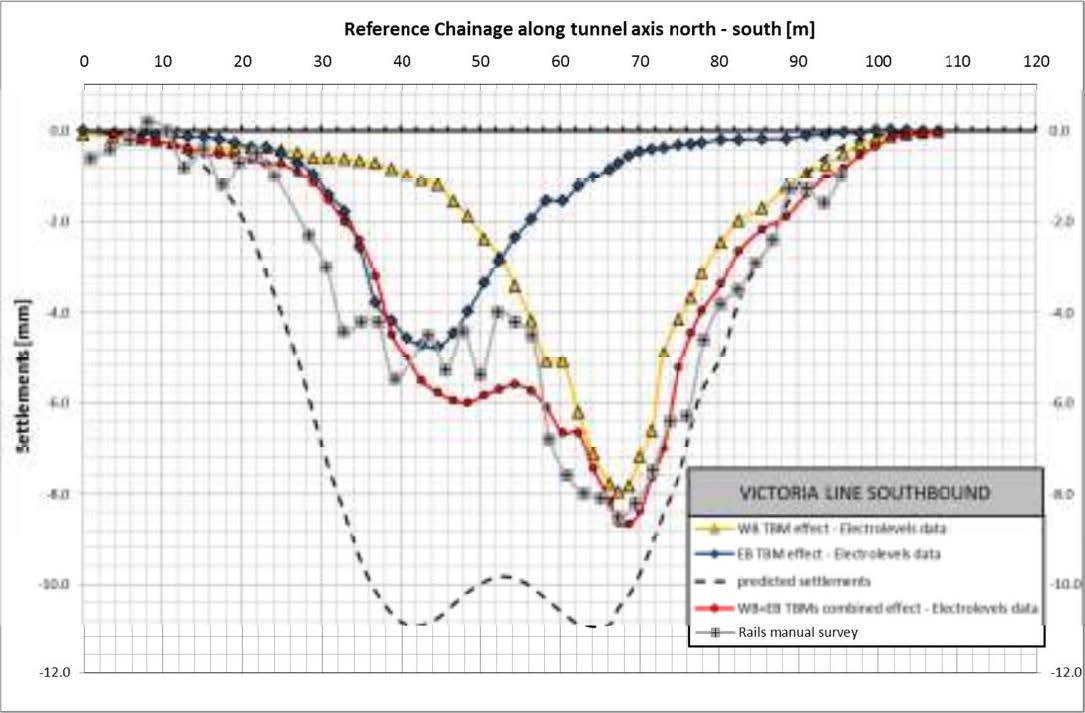
Victoria Line Southbound
Induced settlements in the Victoria Line SB (VSB) varied between drives with the electro-levels recording a maximum 8.0mm of settlement due to the WB passage and 4.7mm due to the EB passage. When considering the settlements at the locations of the TBM crossings due to both TBM’s, the WB recorded 8.7mm and the eastbound 6.0mm. Unlike the VLNB, there is very little difference between the minimum clearances between the WB and EB CRL tunnels and LU tunnel at crossing points 9.6m and 9.9m respectively.
Similar to the VNB, there is an offset of approximately 5.9m and 3.9m between the location of the observed maxima for the WB and EB respectively and the predicted maxima along the VLNB. Unlike in the VNB however, the rail survey doesn’t disprove these values and the settlement troughs are comparable.
When considering the combined effect of the TBM’s are recorded by the electro-levels, this
amounts to 79% and 54% of predicted settlements for the WB and EB respectively at the locations of the observed maximum settlements on the electro-levels (which are offset from the predicted maxima).This difference in behaviour with respect to the difference between WB and EB passage is difficult to explain. It cannot be attributed to TBM operating parameters which were very consistently within limits/targets between the two TBM’s and indeed both TBM’s achieved similar grout injection volumes, EPB and grout pressures – see Figure 5. The ground is considering to be homogeneous throughput the crossings and no reports to the contrary were given from the TBM crew.
The WB TBM stopped on 05/05/2013 for 54hours approximately 25m short of the VLSB by as the TBM crew were required for other works. However no additional displacements were observed in the VLNB or VLSB due to this stoppage as the TBM was sufficiently far away from all the assets and EPB was maintained throughout the stoppage.
The section of the tunnel lining about the crossing with the WB TBM and north of this location is consistently bolted cast-iron type. Approximately 11m south of the crossing, where the tunnel intersects the cross-passage, the rings are constructed with a concrete surround, to provide additional support at this weak point. This might provide an explanation for the additional settlements, however, the construction of the Bakerloo Line tunnels are consistent throughout and the difference in settlements between WB and EB TBM passages also exists.
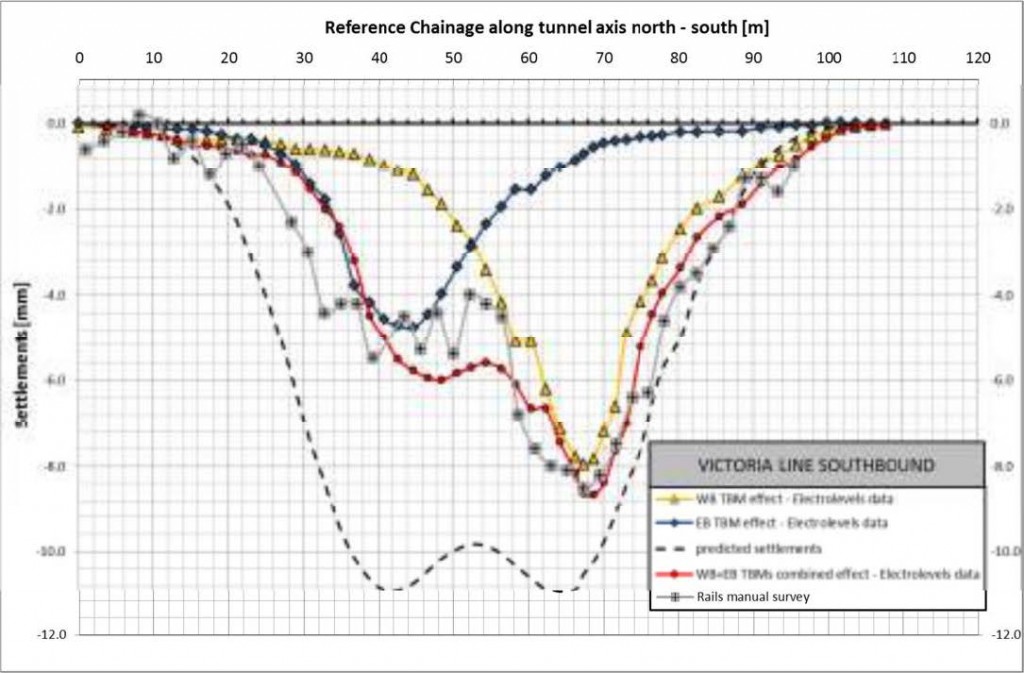
Figure 8 – TBM induced and predicted displacement profile in Victoria Line SouthboundBakerloo Line Northbound
Induced settlements in the Bakerloo (BKNB) varied between drives. When considering the settlements at the locations of the TBM crossings due to both TBM’s, the WB recorded 8.2mm and the eastbound 6.7mm. This amounts to 66% and 55% of predicted settlements for the WB and EB respectively at the locations of the observed maximum settlements on the electro-levels (which are offset from the predicted maxima).
The rail survey and the electro-levels are comparable, confirming the settlements on the electro-levels.

Figure 9 – TBM induced and predicted displacement profile in Bakerloo Line NorthboundBakerloo Line Southbound
Induced settlements in the Bakerloo (BKSB) varied between drives. When considering the settlements at the locations of the TBM crossings due to both TBM’s, the WB recorded 8.9mm and the eastbound mm. This amounts to 72% and 51% of predicted settlements for the WB and EB respectively at the locations of the observed maximum settlements on the electro-levels (which are offset from the predicted maxima).
The electro level readings between CH70-105 have been zeroed has the original values showed erroneous heave which was inconsistent with prediction and the manual monitoring.
The rail survey and the electro-levels are comparable, confirming the settlements on the electro-levels.
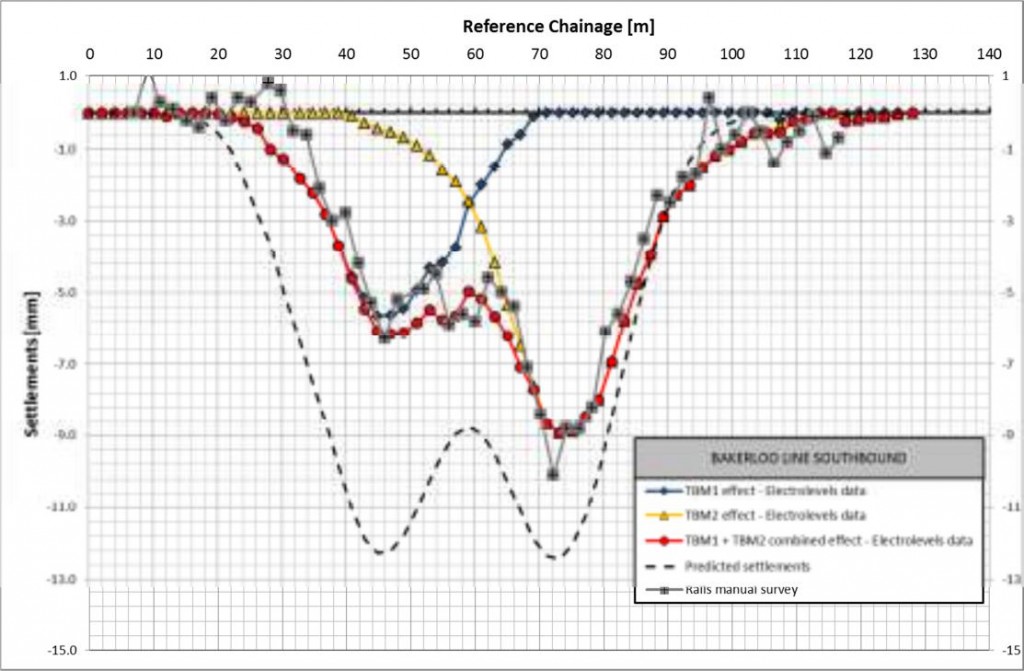
Figure 10 – TBM induced and predicted displacement profile in Bakerloo Line SouthboundFurther Analysis of Displacements
Figures 11 and 12 presents a chart show displacements from the electro levels located closest to the respective CRL TBM crossings with respect to the distance relative to the position of the cutterhead.
For the WB TBM (Figure 11), the chart shows that the displacements during the approach of the TBM begin when the cutterhead is approximately 10m from the axis of the asset. The settlements during this period are a maximum of 3mm. The majority of the total settlements then occur over the length of the TBM shield.
Minimal settlements are induced behind the tail of the TBM (i.e. during grouting), this infers that the performance of the grouting operation was excellent. The exception to this is the VLNB, which continues to show settlements during and after grouting – approximately 50% of total settlements are induced in this period. After investigating the grouting volumes and pressures and EPB in the zone of the VLNB, all values are consistent and within limits/to targets, apart from localised exceptions which are highly unlikely to have caused this settlements, especially when considering the same behaviours occurs in the EB TBM/VLNB crossing where there was no localised deviations from the operational parameters.
Figure 12 shows that the same conclusions as the WB, with the majority of settlements occurring over the settlements occur over the length of the shield and very little settlements occurring after the passing of the tailskin. This once again confirms the excellent performance of the grouting operation. The exception again as stated above is the VLNB.
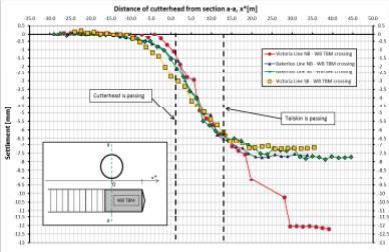
Figure 11 – WB TBM displacement with respect to distance from cutter-head
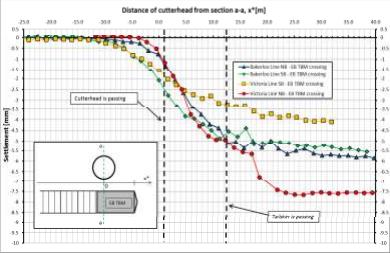
Figure 12 – EB TBM displacement with respect to distance from cutter-head
Conclusions
The analyses of the operating parameters and their comparison with the monitoring displacement results carried out in this paper, show that the general performance of the TBM’s during the critical crossing of the LU Victoria and Bakerloo Line assets was extremely successful. This can be considered an achievement given the minimal clearances and the complexity of the crossing. Additionally, an unforeseen stoppage occurred between assets creating another challenge to the works, however this appears to have had little or no effect with respect to settlements given that the EPB was maintained correctly throughout and a significant distance between the TBM and tunnel linings exists.
The induced displacements didn’t exceed predicted values and in almost all cases they were well within.
It is clear that the WB TBM induced more settlements than the EB TBM. In the case of the VLNB the settlements as a ratio to the predicted are comparable. For all the other assets, were the clearances were similar between both TBM’s, a significant difference in displacements exists.
There are many possible causes for this that were investigated. The cross checking of the EPB, grout pressures and volumes and excavated volumes values show no significant differences between TBM’s apart from a few localised values that are highly unlikely to affect displacements significantly.
Due to the uniformity of the foreseen geological conditions in this area and the relatively short distance between the LU tunnels the variability of the geotechnical parameters in the area should not be significant and it should not therefore significantly affect the TBM’s induced settlements.
The construction of the LU tunnels varies significantly with flexible construction in the VLNB, part rigid-part flexible construction in the VLSB and fully rigid construction in the BKNB and BKSB. Given that all other possible causes for this differential settlement behaviour that were investigated were shown not to be the cause, it could be concluded with some confidence that the varying structure of the assets were likely to be at least partly responsible for this behaviour. As the differential did not occur in the VLNB it can be concluded that something specific to the VLNB that was not specific to the VLSB and BKNB and BKSB lines, did not produce this differential.
Further analyses of the specific kind of structure in the assets could show the answer to understand the behaviour of the Victoria and Bakerloo Lines due to the interaction with Crossrail Western Tunnel during the investigated crossing.
Appendices
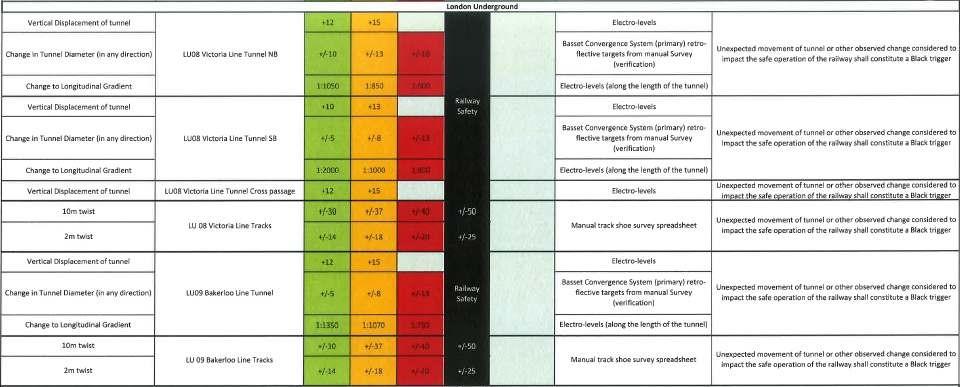
London Underground Asset Triggers
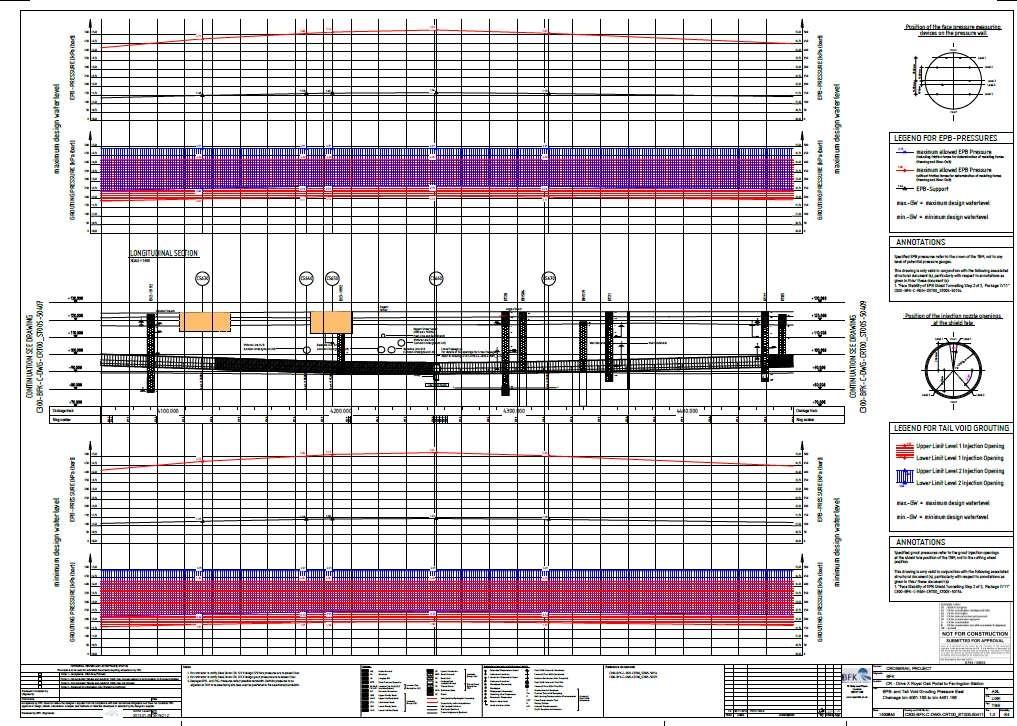
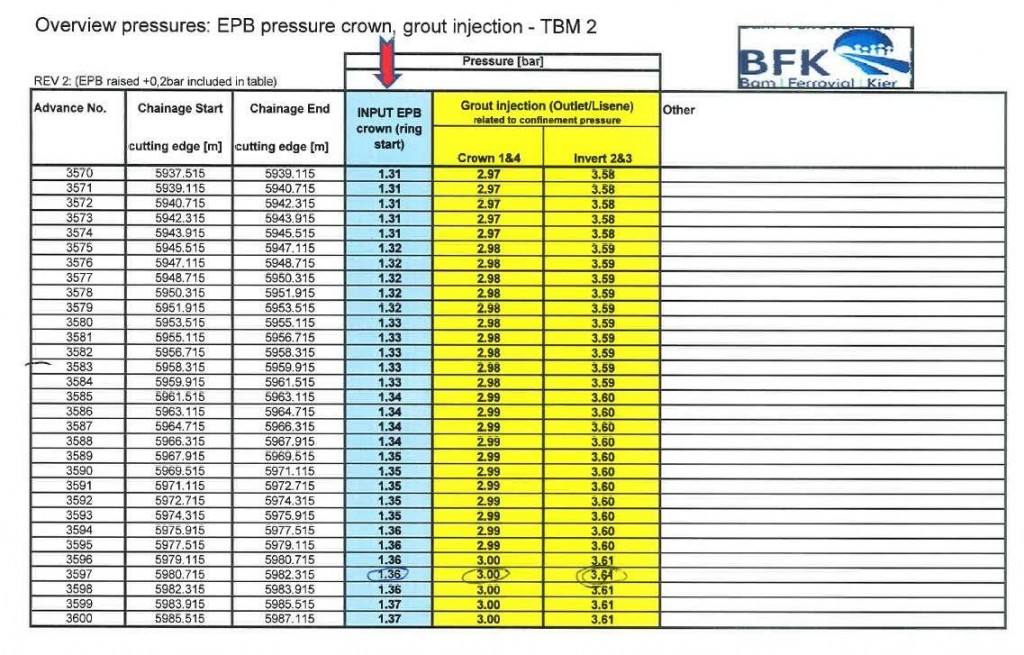
EPB & Grout Pressure Design
References
B. Maidl, M. Herrenknecht, U. Maidl and G. Wehrmeyer (2012). Mechanised Shield Tunnelling. Ernst & Sohn, Germany.
Crossrail (2013) C701-ITM-C-RGN-C125_WS084-50001 C701 Victoria and Bakerloo Line – Green Park to Oxford Circus Running Tunnels Installation Report, London
Crossrail (2012) C122-OVE-C2-RAN-C125-00011 Assessment of Ground Movements Effects: LU/08 Victoria Line South of Oxford, London
Crossrail (2012) C122-OVE-C2-RGN-CRG02-50002 Assessment of Ground Movement Effects LU09 Bakerloo Line South of Oxford Circus, London
Crossrail (2012) C122-OVE-C2-RSI-CR125-00002 Inspection for Analytical and Schedule of Condition: LU/08 Victoria Line South of Oxford Circus, London
Crossrail (2010) C300-PDP-C2-RGN-CRG03-00001. Geotechnical Baseline Report Contract C300. London.
Crossrail C300 (2012) Operating Manual S705/S706. Herrenknecht, Tunnelling Systems. Germany.
New Civil Engineer Magazine (2013) crossrail/crossrail-station-profile-bond-street/5208747.article (accessed 20/10/2013)
R. N. Craig and A. M. Muir Wood (Sir William Halcrow and Partners) (1978) A review of Tunnel Lining Practise in the United Kingdom. Transport and Road Research Laboratory. Department of the Environment Department of Transport. Crowthorne, UK, supplementary report 335.
-
Authors