Development of Pore Water Pressure in the Vicinity of SCL Tunnels in London Clay – Liverpool Street Station
Document
type: Technical Paper
Author:
Roser Soler Pujol, Dr Alfred Stärk Dipl Ing Dr Ing, ICE Publishing
Publication
Date: 07/09/2015
-
Read the full document
1. Introduction
When tunnelling in low permeability soils such as London Clay, the surface above the tunnel experiences an immediate (undrained) settlement caused by the excavation, followed by a slow secondary settlement, or consolidation settlement, that could extend for a long period of time.
According to Wongsaroj et al. (2013) [1], Mair (2008) [2] and Gourvenec et al. (2005) [3] the long-term settlement could be caused by the new tunnel acting as a drain, creating permanently reduced pore pressures around the infrastructure and resulting in an additional consolidation of the clay. It is assumed that the drainage effect happens if the lining is not at least 50 to 100 times less permeable than the surrounding ground and, in the studied case, the current sprayed concrete lining and the clay have quite similar permeability. Although an attempt of verifying reduced pore pressures around an old segmental lining tunnel at Kensington was done by Gourvenec et al. (2005) [3], this effect could not be clearly confirmed.
Long term settlement was initially observed at Liverpool Street Station C510 contract works after the first excavation stages and discussed with a CRL’s expert panel in autumn 2012. As a result, and following a suggestion of Professor Mair from Cambridge University, some piezometers were installed. To give the instruments a unique name, Professor Mair’s initials “RM” were chosen.
The purpose of this investigation is to assess the pore pressure conditions of the ground surrounding the constructed tunnels and its variation across time, throughout the analysis of the piezometer results.
2. Context
RM piezometers consist in a series of Vibrating Wire Transducers (VWT) installed in a total of 14 bore holes, RM01 to RM14, drilled at Liverpool Street Station. RM01 to RM06 are installed within the London Clay Formation whereas RM07 to RM14 are targeting Lambeth Group Formation, including both Clay from the Upper Mottled Beds and Sand Channels. For the present study, only RM01 to 06 have been taken into account, because the London Clay Formation is the perfect example of low permeability soil. Lambeth Group Formation might have a global different behaviour due to the inter-bedded Sand Channels.
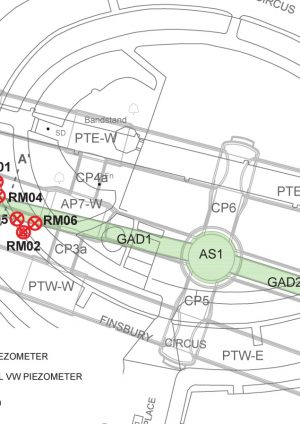
Bore holes RM01 and RM02 are located in Finsbury Circus surface on either side of Geotechnical Adit 1 (GAD1), as shown in Figures 1 and 2. Both are vertical bore holes equipped with two sensors targeting River Terrace Deposits and London Clay Formation, more specifically sub-unit A3 based on King’s classification [4]. The sensors targeting London Clay Formation are type “Geosense VWP-3000” fully grouted, and the sensors targeting River Terrace Deposits are “Geosense VWP-3001” with a gravel backfill and bentonite seal at the top.
 Figure 1 -RM piezometers plan view. The Geotechnical Adits (GAD1 and GAD2), tunnelled at each side of the Access Shaft 1 (AS1), are shadowed.
Bore holes RM03 to RM06 were drilled from inside the GAD 1, as shown in Figure 2, with a low angle and targeting London Clay Formation (Unit A3). Each borehole was equipped with 3 Vibrating Wire Transducers at 0.5 m, 1.5 m and 4 m distance from the extrados of the Sprayed Concrete Lining (SCL) (see Figure 2). The Vibrating Wire Transducers installed are “Geosense VWP-3000” model and are fully grouted with a cement and bentonite mix.
Data from piezometers RM01 to RM02 and from RM03 to RM06 is available since 16/05/2013 and 26/05/2013, respectively.
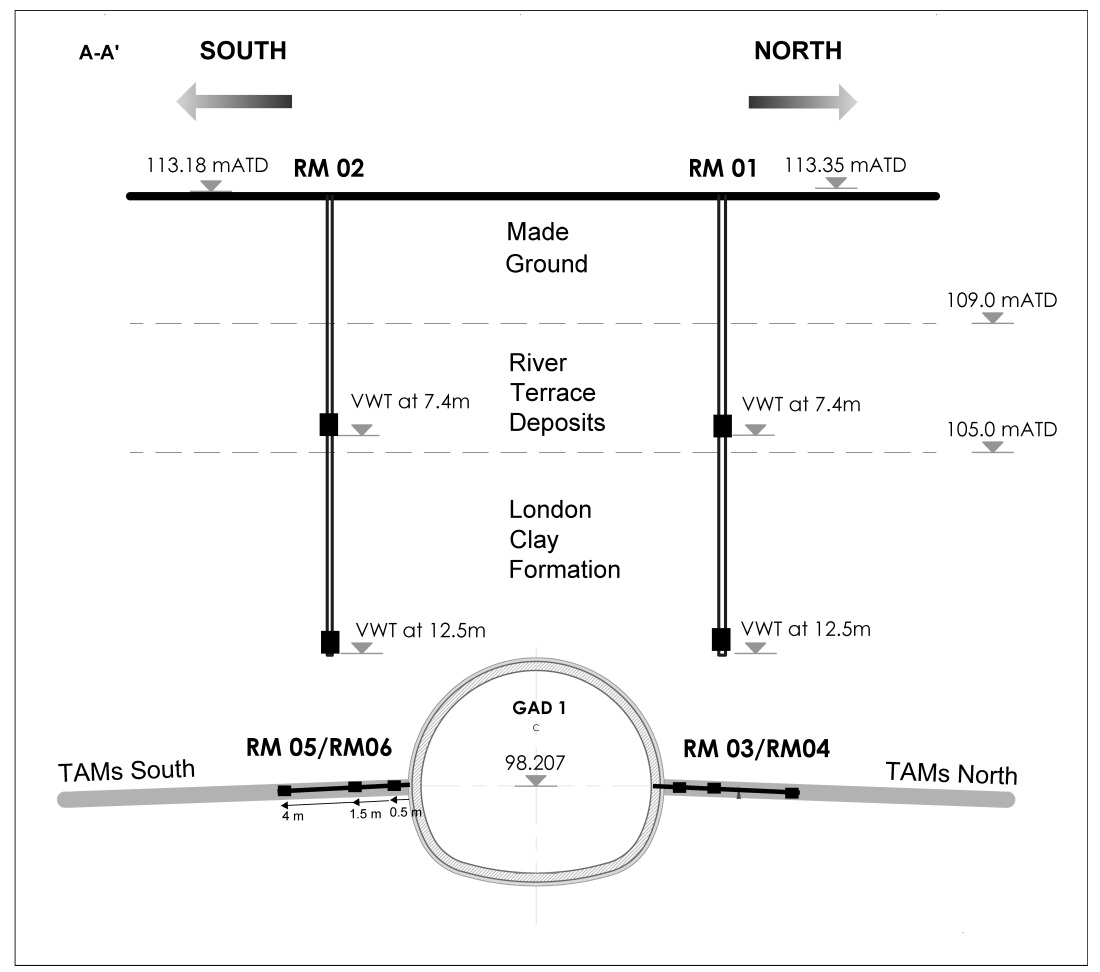 Figure 2 – Cross section sketch of bore holes RM01 and RM02 with VWTs location at 7.4 m and 12.5 m depth; and RM05 and RM3 with VWTs at 0.5 m, 1.5 m and 4 m distance from the tunnel.
3. Pore pressure in London Clay Formation
The piezometric pressure in London Clay Formation has, in general, not been stable for the period of time analysed. Figure 3 shows the distribution of the pore pressure in London Clay Formation (A3) and in the River Terrace Deposits in piezometers RM01 and RM02.
The ground water table in the River Terrace Deposits has been mostly stable between 106.5 and 107.2 m above Tunnel Datum, as it would be expected in this area. However the pore pressure in the London Clay Formation has been highly variable during the monitoring period, frequently disturbed by spikes.
In order to know the reasons of these changes in the piezometric pressure, all the data has been crosschecked with the following information:
- Grouting works in the surrounding area.
- Tunnel excavation periods.
- In tunnel depressurisation periods.
- Pre-construction pore pressures in London Clay.
- Data from historical piezometers.
As a result, 3 main effects have been noted in the majority of the Vibrating Wire Transducers targeting London Clay.
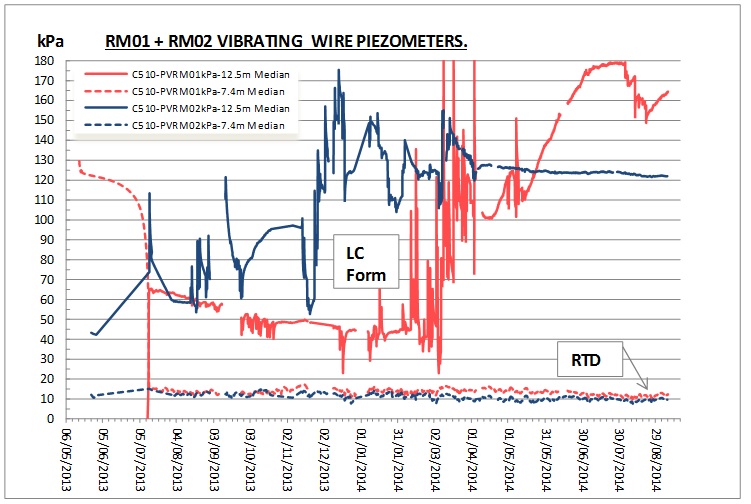
Figure 3 – Piezometric pressure obtained in RM01 and RM02 piezometers, both in London Clay Formation and River Terrace Deposits.
3.1. Grouting works effect on the pore pressure
As mentioned before, the Vibrating Wire Piezometers were installed within the Geotechnical Adit 1 (see Figures 1, 2) from where BBMV JV has been carrying out the compensation grouting and corrective grouting works during the construction of C510 SCL Tunnels in Liverpool Street Station. Figure 4 shows the location of the RM piezometers and the TAMs, from where the injections have been done.
The TAMs were drilled following the completion of GAD1 in February 2012, with entry points at axis level of GAD1 and inclined between 4 to 6 degrees downwards relative to the horizontal [5]. RM03 to RM06 were drilled, geometry wise, nearly parallel to the TAMs to fit in between.
Precondition grouting from the GADs started on August 2012, followed by active compensation grouting on October and November 2012 for AP7-East and AP7-West respectively. Active compensation grouting has been done along with the excavation face as the tunnelling proceeded. It must be noted that the exclusion zone was originally 5 m around the GADs, however this was changed to 2 m according to RFI approved on the 24/05/2013 [6]. Changes on the exclusion zone were made before the installation of the RM piezometers, therefore there should be no effect on the data for this reason.
At the North of the GAD tunnel the TAMs are named GAD1N, and GAD1S at the South. All straight lines are TAMs. For the sake of clarity only TAMs in the vicinity of the RM piezometers have been labelled.
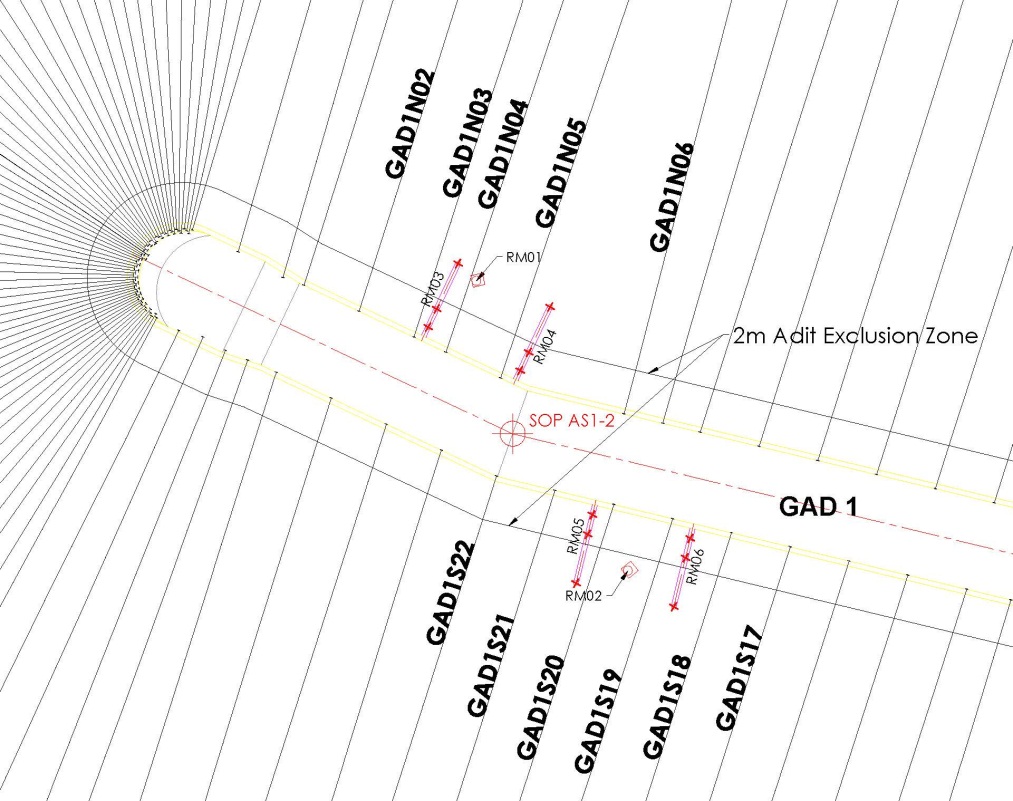
Figure 4 – RM piezometers and grouting TAMs location within the Geotechnical Adits.
To compare the volume of grout injected against the piezometric pressure, an area of 5 meters distance to the tip of the Vibrating Wire Transducer has been taken into account. Only the grout injected within this area has been crosschecked. As a result, Figure 5 shows how the majority of the spikes in the London Clay pore pressure are related to the grouting works.
It can also be noted that the piezometric pressure in VWT RM01 at 12.5m was initially higher, probably due to the larger volume of grout injected in the surrounding area in GAD1Ns, while the pore pressure remained lower in VWT RM02 at 12.5m, until corrective grouting took place between February and March 2014. Since then, the piezometric pressure in VWT RM02 at 12.5m has been rising until June 2014. On the other hand, VWT RM01 at 12.5m has remained more stable since March 2014 because there has not been much grouting around it.
Apart from piezometers RM01 and RM02, all the other VWTs in piezometers RM03 to RM06 have also been crosschecked with the volume of grout injected in the surrounding area confirming that the accused spikes in the pore pressure are related to the grouting.
It is also evident that, since mid or end of March 2014, there is a general increase in pore pressure. This is probably caused by the corrective grouting that was done between January and the end of March 2014 especially in GAD1N. After the mentioned corrective grouting, the closest sensors at 0.5m distance from the tunnel have been clearly affected. All, but piezometer RM06 sensor at 0.5m distance, show a clear excess in pore pressure above the rest of the sensors at 1.5 and 4m distance. This indicates a higher pressure close to the tunnel caused by the grouting.
To confirm the theory that the tunnel acts as a drain, a decrease in the pore pressure close to the tunnel would be expected. This means that sensors located at 0.5m distance from the tunnel would have to show a lower pore pressure than the rest of the sensors, but the information available until the present moment does not show anything similar because the piezometers have been clearly affected by grouting.
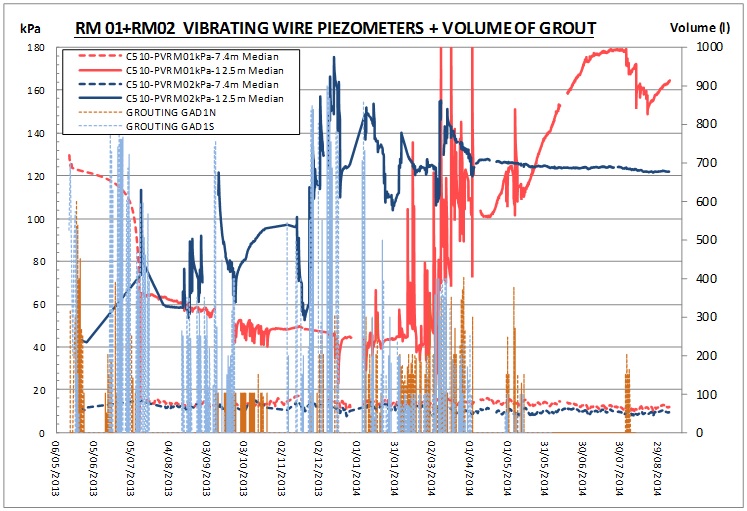
Figure 5 – Piezometric pressure in VWTs RM01 and RM02 compared with the volume of grout (in litres) injected in a surrounding area of 5 m distance.
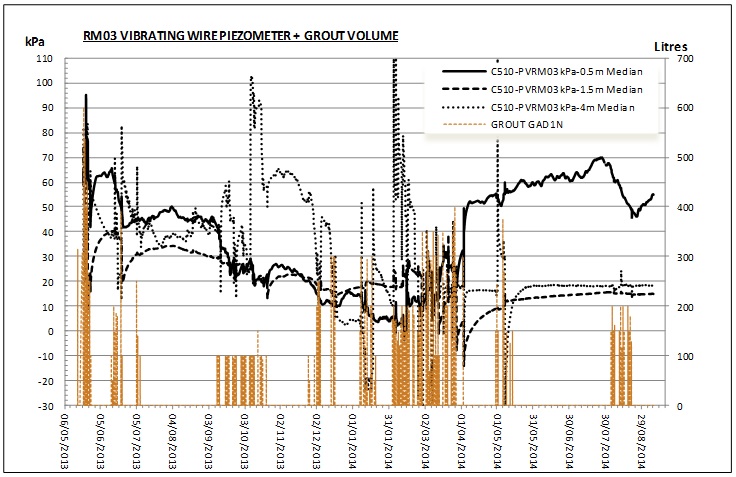
Figure 6 – Piezometric pressure in RM03 VWTs compared to the volume of grout (in litres).
3.2. Mining works effect on the pore pressure
Apart from the spikes in the pore pressure caused by grouting, there is another clear effect caused by the excavation of the platform tunnels and cross-passages below the sensors. When the excavation of the tunnels was nearly below the Vibrating Wire Transducer, the piezometric pressure showed a sudden drawdown which is explained by the relaxation of the ground or immediate settlement.
This effect is shown in Figure 7, where VWTs RM01 and RM02 have been compared with the excavation periods and advances. The pore pressure registered by VWT RM01 at 12.5m in London Clay is clearly affected by the excavation works of Platform Tunnel Westbound – heading West (PTW-W, South of GAD1, see figure 2) and VWT RM02 at 12.5m is also affected, but in a less pronounced way, by mining works of Platform Tunnel Eastbound heading West (PTE-W, North of GAD1, see figure 2). This difference is probably because VWT RM01 at 12.5m is closer in distance to PTW-W tunnel, than VWT RM02 at 12.5m to PTE-W tunnel. Tunnelling method, size and support of both tunnels are all the same. However, it is clear in both cases that when the excavation is closer (advance 72 in PTW-W enlargement and advance 99 in PTE-W enlargement, in bold, in Figure 7) the decrease in the pore pressure is larger.
The same influence has been confirmed in the other RM piezometers too, for example in Figure 8 piezometer RM03 has been crosschecked with mining works in PTE-W.
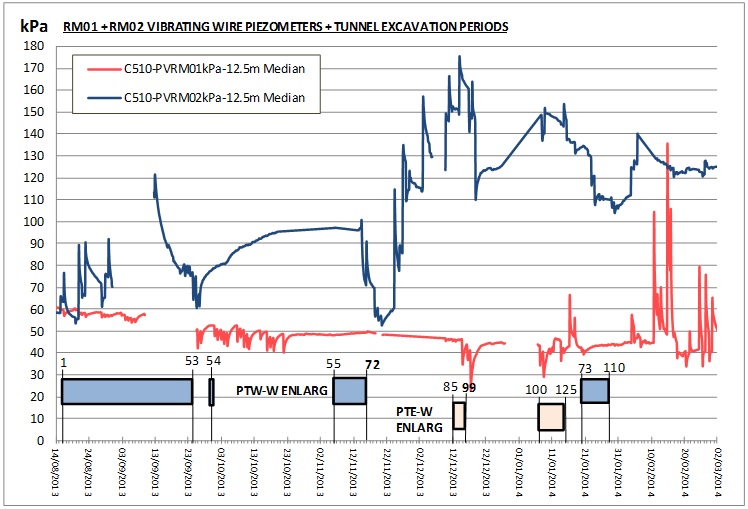
Figure 7 – RM01 and RM02 VWTs pore pressure against mining periods in PTW-W and PTE-W, detail of the period between August 2014 and February 2014.
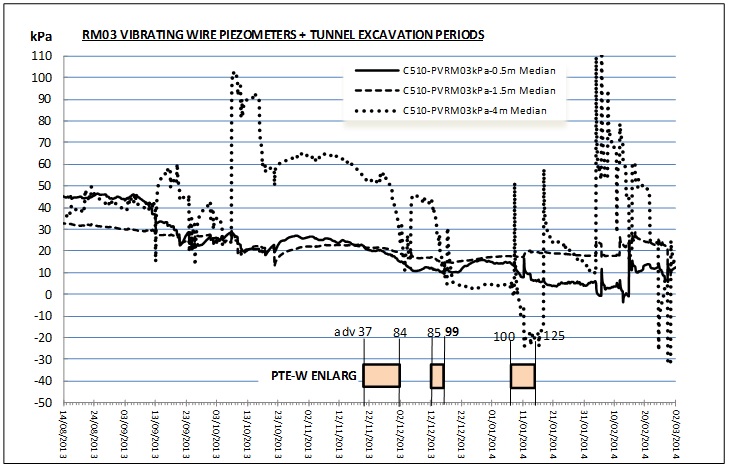
Figure 8 – RM03 VWTs piezometric pressure against mining works in PTE-W, detail of the period between August 2013 and March 2013.
In some piezometers, the furthest sensor located at 4 m distance is the most affected by the mining, as shown in Figure 8, because it is the closest to the excavation. It has also been observed that the decrease caused by the enlargement works is more pronounced than the one during the pilot, as it would be expected.
When the drop in pore pressure is not much interfered by grouting works, there is a pore pressure build-up after the excavation has finished. This can be seen in Figure 7 where there is a water pressure decrease in VWTs RM02 at 12.5 m due to the excavation of PTW-W advance 53 followed by a piezometric pressure build-up. Another example is in VWT RM01 at 12.5m after the excavation of PTE-W enlargement advance 99. When the excavation stops, the pore pressure rises back to its initial value.
The effect of in tunnel depressurisation has been also correlated with the piezometric pressure. However, it must be said that all in-tunnel pumping works targeted the permeable sand channels within the Lambeth Group. These sand channels were depressurised if present in a range of 4 meters below the invert of the Plaform Tunnels. No depressurisation works have been done in London Clay.
There is not a clear relation between in-tunnel pumping periods and the development of the water pressure in London Clay A3, except for the fact that the depressurisation periods have been carried out at the same time as the excavations. Considering the distance and the low permeability of the London Clay Formations A2 and specially A3, no relation would be expected.
3.3. Decreasing tendency in the water pressure
Apart from grouting and mining influence on the piezometric pressure, there is another effect which is a common decreasing tendency in the pore pressure in all of RM piezometers. This effect could be related to the draining tunnel given by Mair (2008) [2] and Gourvenec et al. (2005) [3].
Figure 9 shows the data collected from all of the horizontal RM piezometers. In a general overview, the pore pressure tends to decrease at a similar rate in the majority of the piezometers up until March 2014. After this period there is a change and the pore pressure rises after the corrective grouting done during January to February 2014, as previously seen.
An average of the pore pressure has been calculated for the period between May 2013 and February 2014 (Figure 10). VWTs RM05 at 0.5 and 1.5m have not been taken into account for the average because they are much more affected by grouting. The period since March 2014 has also not been taken into consideration because the influence of the corrective grouting is too high. Figure 10 shows the decreasing linear tendency obtained. The pore pressure average was initially between 65 to 70kPa (May 2013), and it was steadily decreasing to values close to 30 kPa in average up until February 2014.
Furthermore, considering the pre-construction geotechnical data in the area, the expected piezometric pore pressure at this depth should be at around 90kPa, according to the Crossrail Central Ground Water Level Monitoring Report Rev F (GLMR) [7].
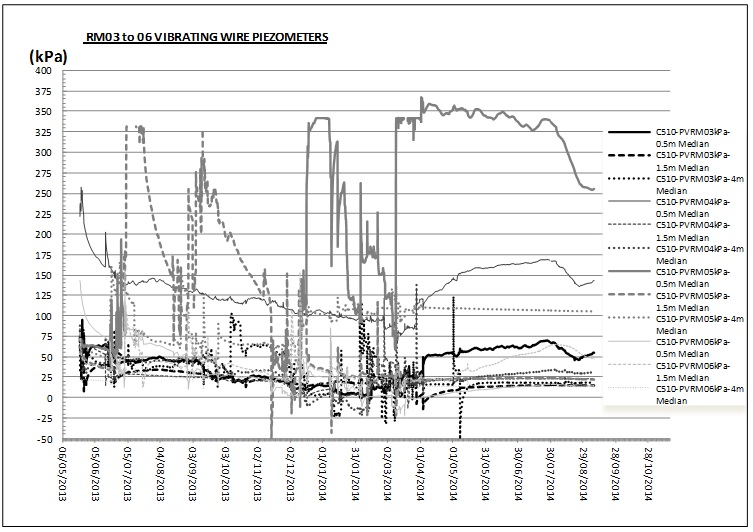
Figure 9 – Piezometric pressure for Vibrating Wire Piezometers RM03 to RM06.
Figure 11 shows the pre-construction theoretical pore pressure profile recommended by the GLMR [7] and the average piezometric pressure in London Clay (piezometers RM03 to 06) at the end of February 2014. By then, the pore pressure in London Clay close to GAD 1 was much lower than the expected one.
Since March 2014 the pore pressure has been affected by the corrective grouting as shown by the results of the piezometers, therefore, it is still unclear if the initial tendency will continue in the future, leading to permanently reduced pore pressures once the excess of hydrostatic pressure from the grouting has been dissipated.
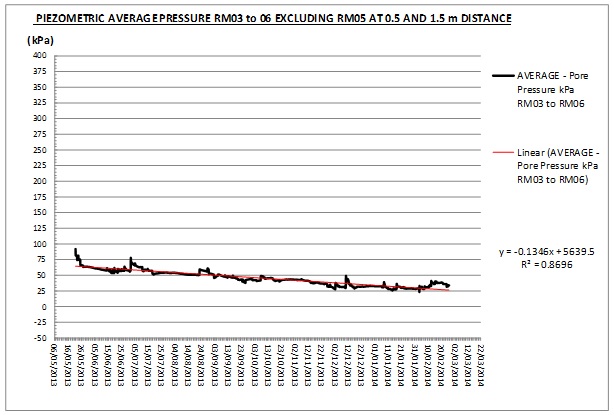
Figure 10 – Piezometric pore pressure average from VWTs RM03, RM04, RM05 and RM06 (May 2013-Feb 2014). Sensors in RM05 at 0.5 and 1.5 m distance have not been taken into account.
![Figure 11: Piezometric pressure profile based on GLMR Rev F[7] including pore pressure obtained in VW piezometers RM01 at 7.4m, RM02 at 7.4m and RM03 to 06 in February 2014, and pore pressure from Historical CRL piezometers L30Rii, L39Rii and L40Ri.](https://learninglegacy.crossrail.co.uk/wp-content/uploads/2016/09/7D-018-Figure-11-1.jpg)
4. Historical CRL Piezometers
An assessment of various historical Crossrail manual piezometers has been also carried out in order to confirm the results obtained with the RM Vibrating Wire Piezometers.
Three manual surface piezometers targeting London Clay Formation have been monitored since September 2012 and November 2012 respectively, by BBMV C510 JV: L30Rii, L39Rii and L40Ri. Piezometer L30Rii is close to PTE-E while piezometers L39Rii and L40Ri are at least 100m away from the current tunnel excavations (see Figure 12).
L39Rii and L40Ri piezometers are targeting the top of London Clay A2 Formation at 90.43 and 88.72mATD respectively, while piezometer L30Rii targets the base of London Clay Formation A2 at 76.0mATD.
Graph in Figure 13 compares the development of the pore pressure in the manual CRL piezometers with the average pressure obtained in the RM horizontal VW piezometers. It shows how groundwater pressure in piezometer L40Ri has been homogeneous throughout time, which means that this piezometer has not been affected by the construction of the tunnels. Pressure in piezometer L39Rii has not been as homogeneous as in piezometer L40Ri, but changes and tendency are neither similar to the RM VWTs average.
However, the general tendency of pore pressure in L30Rii shows an incipient decrease similar to the one obtained for RM VW piezometers, interrupted by punctual spikes. These spikes are due to the grout injected in the surrounding area as shown in Figure 14.
In Figure 14, the piezometric pressure has been compared with the volume of grout injected in a surrounding area of 5 meters around L30Rii like in RM VW piezometers. The spikes in the pressure correlate with the grouting periods.
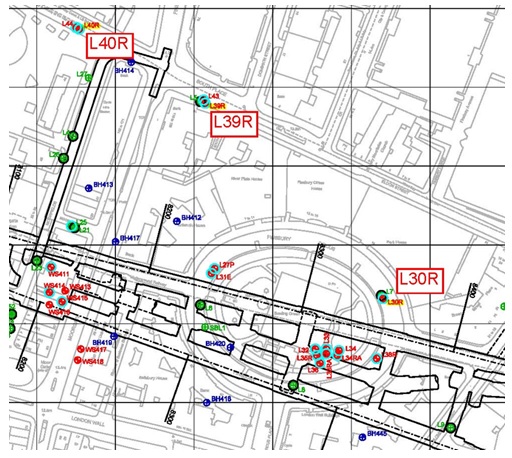
Figure 12 – Historical CRL boreholes L40R, L39R and L30R location.
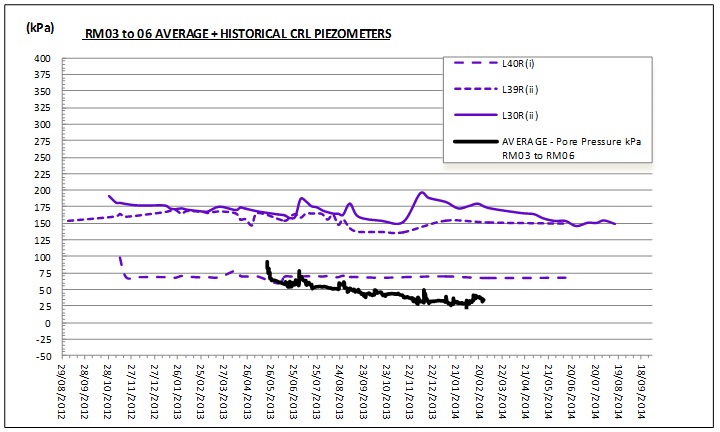
Figure 13 – Piezometric pore pressure average (from VWTs RM03, RM04, RM05 and RM06 (May 2013-Feb2014) excluding VWTs RM05 at 0.5 and 1.5m distance) compared to the pore pressure obtained in historical CRL piezometers L40Ri, L39Rii and L30Rii
Finally, the pre-construction piezometric pressure has also been compared to the GLMR ReV F [7]. Following the pressure profile in Figure 11, the initial pore pressure in piezometer L30Rii was higher than the current one. The same is happening in the case of L40Ri, although it is not for L39Rii, in which the current pore pressure is higher than the expected one.
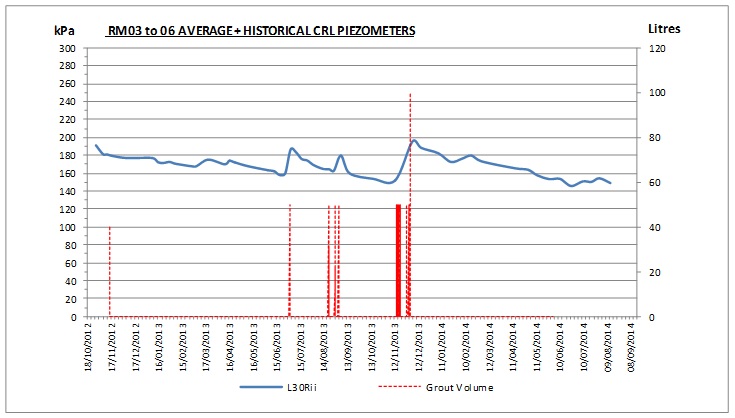
Figure 14 – Piezometric pressure in L30ii against volume of grout (litres) injected in the surrounding area (5m distance)
Piezometer L30Rii is, in general terms, confirming the results obtained with RM piezometers. Pore pressure in London Clay close to the tunnel is permanently reduced, possibly due to the fact that the tunnel is acting as a drain. Furthermore, the pore pressure is being reduced both in London Clay Sub-Unit A3, in RM piezometers, and in London Clay Sub-Unit A2, in piezometer L30Rii.
In the case of piezometers L40Ri and L39Rii, the effect of the tunnel is not present or clear probably because the piezometers are too far away or out of the zone of influence of the tunnel.
5. Conclusions
After analysing the results obtained through RM Vibrating Wire Piezometers, it has been noted that the piezometric pressure in London Clay Formation has been affected by the construction works in the area close to the tunnels.
On one hand, the pore pressure has been affected by the compensation and correction grouting in the surrounding areas of the TAMs. A clear correlation between the injections and the changes in pore pressure can be established.
On the other hand, it has been observed that the groundwater pressure registers a pronounced decrease when the tunnel excavation advances below the sensor, due to the relaxation of the ground at the face of the excavation. It has also been noticed that the pressure builds-up once the top head excavation moves ahead.
Finally, the piezometric pressure in London Clay Sub-Unit A3 has been in general terms decreasing in the majority of the piezometers with the same slope in the nearby area of GAD1 between the period of May 2013 and February 2014. This effect has also been noticed in one historical manual piezometer close to PTE-Eastbound tunnel (L30Rii), confirming that the decreasing tendency is also taking place in London Clay Sub-Unit A2. The overall tendency can probably be related to the fact that the tunnel has been acting as a drain as Wongsaroj (2013) [1], Mair (2008) [2] and Gourvenec et al (2005) [3]; explain.
This could be the reason for the long term settlement observed in the area. However, to date, there is only little experience on long term settlement and it is unclear whether it will continue or fade out with time. Yet a lot of questions need an answer, for example: the long term effect of the corrective grouting; or whether backfilling the Geotechnical Adit Tunnel will have any influence on the pore pressure conditions. It must be said that within this paper the contribution of the three main tunnels to the change in pore pressure and long term settlement could not be analysed. For all these reasons, further monitoring and investigation will be needed.
References
[1] Wongsaroj, J.; Soga, K.; Mair, R.J. (2013): Tunnelling-induced consolidation settlements in London Clay. Géotechnique 63, n.13, 1103-1115
[2] Mair, R.J. (2008): Tunnelling and geotechnics: new horizons. Géotechnique 58, n.9, 695-736
[3] Gourvenec, S.M.; Mair, J.R.; Bolton, M.D.; Soga, K. (2005): Ground Conditions around an old tunnel in London Clay. Geotechnical Engineering 158.
[4] King, C. (1981): The Stratigraphy of the London Clay and Associated Deposits. Backhuys, Rotterdam, Tertiaty Research Special Paper No.6.
[5] BBMV C510 (2013): Crossrail Limited, Liverpool Street Station Geotechnical Adit Bore-hole Arrays (C510-MRG-C-DWG-C101-50001 2.0).
[6] BBMV C510 – Crossrail correspondence (2013): Geotechnical Adits Exclusion Zone (LIS-CRL RFI-C510-00291)
[7] Geotechnical Consulting Group (2010): Crossrail Limited, Crossrail Central: Groundwater Level Monitoring Report Rev F (CRL1-GCG-C2-RGN-CRG03-00001). -
Authors


Dr Alfred Stärk Dipl Ing Dr Ing - BeMo Tunnelling
Dr Alfred Stärk is Chief Geotechnical Engineer and Engineering Manager at BBMV for Crossrail Contract 510 ‘Whitechapel and Liverpool Street Station Tunnels’ since March of 2011. He started his career at the University of Hanover, Germany, where he worked as assistant professor and consultant for 10 years. In 2002 he joined BeMo Tunnelling, Innsbruck, Austria. He now has 25 years of experience in large-scale tunnelling, mainly with sprayed concrete lining in soft ground.
