The Geology and Geotechnical Properties of the Thanet Sand Formation – an Update from the Crossrail Project.
Document
type: Technical Paper
Author:
Chris Menkiti, John Davis EurGeol CGeol MSc DIC, K. Semertzidou, C.O.R. Abbireddy, D. W Hight, J. D. Williams, Mike Black BSc(Hons) MSc CSci CGeol FGS, ICE Publishing
Publication
Date: 07/09/2015
-
Read the full document
1. Introduction
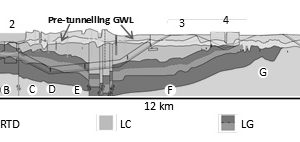
Crossrail is one of the most significant infrastructure projects undertaken in the UK with a projected usage of 200 million journeys/ year. It will provide a high capacity train service operating at a peak frequency of 24 trains per hour and bringing an extra 1.5 million people within 45 minutes of central London. The central underground section is tunnelled to pass beneath the built up city and to avoid existing infrastructure such as piles and metro tunnels (Figs 1 & 2). Tunnelling and station excavations of up to 40m depth have been necessary, deeper than previous infrastructure works in London. As a result of the increased depth and extensive lateral extent, the Crossrail works encounter or are influenced by the Thanet Sand (TS) Formation over a wide area, from shallow exposures in the east, where its base is at a depth of 18m or less, to deep conditions in the west where its base is 40m deep or more (Fig. 1).
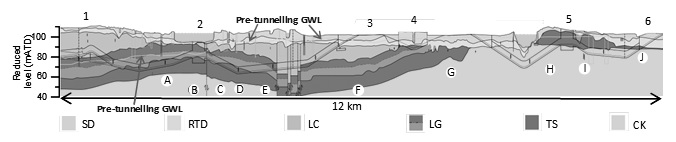 Figure 1 – Geological section along southeast branch of the Crossrail tunnel alignment; 1 Stepney Green Junction, 2 Canary Wharf Station (aka Isles of Dogs Station), 3 Custom House, 4 Connaught Tunnel, 5 Woolwich Station, 6 Plumpstead Portal. Geological sequence shown (top to bottom): Superficial Deposits (SD=Made Ground, Alluvium, Langley Silt), River Terrace Deposits (RTD), London Clay (LC), Upper Lambeth Group (LG, dark brown), Lower Lambeth Group (LG, light brown), Thanet Sand (TS) and Chalk (CK). GWL = Groundwater Level.
In London, surface exposure of the TS Formation is limited. As a result, there has been limited opportunity for detailed study (e.g. Ventouras & Coop, 2009). Yet it is a stratum of important engineering and financial significance, being part of the principal aquifer of London and increasingly being a medium for tunnelling and piling as infrastructure goes deeper underground and spreads outwards from the city centre. Crossrail offers, therefore, a unique opportunity to improve our understanding of the TS. Since 2000, high quality drilling and interpretation of some 372 new boreholes, mostly for the project, but including some third party boreholes, have provided a wealth of information.
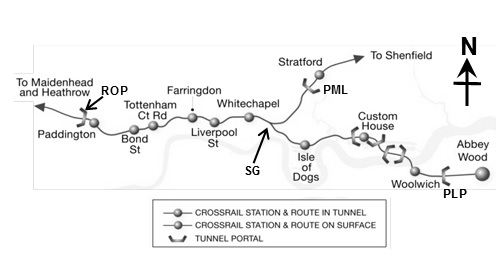
Figure 2 – Plan alignment of Crossrail tunnelled section involving 2 x 21km, 6.8m outer diameter running tunnels. ROP = Royal Oak Portal, SG = Stepney Green Junction, PML = Pudding Mill Lane Portal & PLP = Plumstead Portal.
This, augmented by observed performance during tunnel construction, has allowed a significant improvement in the interpretation of the geotechnical parameters and engineering behaviour of the Thanet Sand in the London area. This is the focus of this paper.
2. Geology and Hydrogeology
The TS Formation in London is a sequence of upwardly-coarsening fine-grained, green-grey or grey-brown sand, within the Palaeocene series of the Palaeogene period. It was laid down about 58 million years ago in a coastal inter-shelf environment adjacent to an arid Chalk upland to the northwest.
The TS overlies the Chalk in the London area and generally thins to the west, mainly due to later uplift, tilting to the southeast and erosion. The average thickness in the Crossrail area is 15m. The lower section of the TS formation has higher fines content in many locations and is a clayey SAND or sandy CLAY. The upper boundary of the TS is an erosional surface and is unconformable with the overlying Upnor Formation (UF) of the Lambeth Group (LG). This boundary is intensely bioturbated (i.e. reworked by animals and plants) and can be very diffuse. This interface can therefore be difficult to distinguish, also because the UF can have a similar lithology to the TS. For the Crossrail Project and the interpretation presented in this paper, the presence of pebbles, obvious glauconite, shells and clay/ silt laminae is carefully checked for at the boundary zone in the logging process. Where these occur, the zone is classified as UF not TS. (Glauconite occurs in the TS too, but in very low concentrations at the TS-UF interface relative to concentrations found in the UF.)
The basal unit of the TS Formation in London is the Bullhead Beds – a conglomerate of angular to rounded coarse flint gravel and nodular flint in a matrix of clayey, fine to coarse sand. Flint nodules can be up to 500mm in size and are difficult to recover in boreholes. The Bullhead Beds’ thickness as inferred from Crossrail boreholes is 0.1 – 1.2m.
At the eastern end of the alignment, where the TS is shallow, the cover of Lambeth Group and London Clay is absent (Fig. 1). The TS in this zone was observed to be weathered, where it is subjected to tidal variations in ground water level. Weathering, which can extend through the full thickness of the TS, occurs as light brown or orange-yellow staining; weathering was observed up to 1.5km from the current River Thames river wall.
The TS and Chalk comprise the principal aquifer in London, called the deep aquifer. Over most of London, it is separated from the shallow aquifer formed by the River Terrace Deposits (RTD) and Made Ground by the low permeability London Clay and Lambeth Group clays (e.g. Fig 1 Locations A to F). The TS and Chalk are in hydraulic connection and have a depressed groundwater table due to historic pumping over the last 200 years. To the east, where the TS is shallow, the upper and lower aquifers merge and the TS is in hydraulic connectivity with the RTD (Locations G to J).
Occasionally, deep drift-filled hollows, such as the Blackwall hollow (originally described by Berry, 1979), penetrate down to the deep aquifer and can locally provide vertical connectivity between the shallow and deep aquifers. This was evidenced on Crossrail as a 1m amplitude tidal response in the TS and Chalk near Blackwall, despite a clay cover of 20 – 30m between the two aquifers outside this drift-filled hollow.
3. Mineralogy, Fabric and Gradation
The sand grains comprise sub-angular quartz (70-85%) with some glauconite and feldspar. Montmorillonite is dominant within the clay fraction. The orange staining in the weathered TS is due to haematite and goethite formed by weathering processes. From thin section studies, Ventouras & Coop (2009) report a dense fabric that is not locked or cemented. This is consistent with the strength envelopes discussed in Section 4.3.
Figs 3 & 4 show particle size information for the TS. A consistent and uniform grading is shown across London, along the Crossrail alignment. The bottom 5 – 6m of the stratum has higher fines content and plots towards the upper bound line in Fig. 3. Typically clay content of the TS ranges from 0 – 20% and fines content from 0 to 70%. The southeast branch of the alignment (SG to PLP in Fig. 2) has more fines and clay in the basal layer, with clay content in the bottom 2m reaching 35% – 40% (Fig. 4). Nicholson et al (2002) measured a similar trend at Canary Wharf.
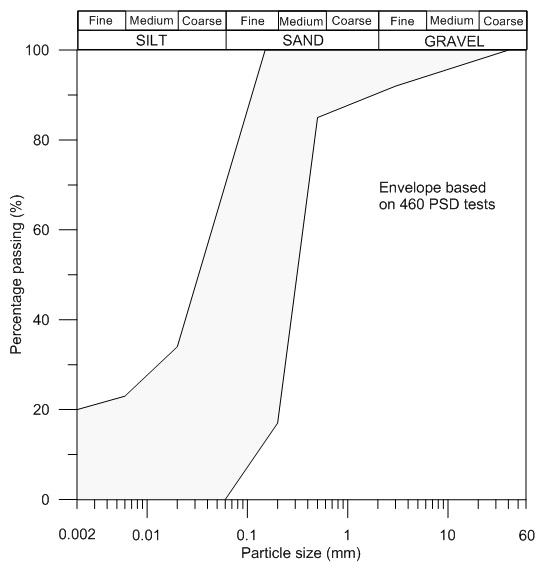
Figure 3 – Particle size distributions
4. Geotechnical parameters
4.1 Index parameters
Bulk density from 330 tests on “undisturbed” rotary core samples was 1.88 Mg/m3 with a standard deviation of 0.09 Mg/m3. Average bulk density in-situ is likely to be around 1.9 Mg/m3 due to a possible slight bias from partial de-saturation of the rotary cores. The specific gravity was measured as 2.65 +/- 0.1. The relative density from subsamples trimmed from the centre of “undisturbed” rotary core samples was 84% +/-9%. For this determination, the minimum density was determined according to Kolbuszewski (1948) and the maximum density using a vibratory hammer in a CBR mould.
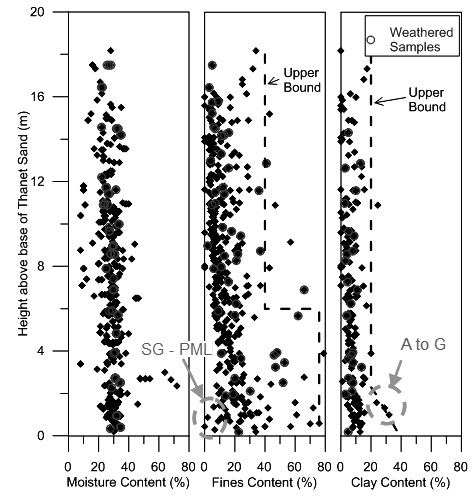
Figure 4 – Index properties plotted as height above base of TS. Indicative upper bound lines shown. Fines content in the lower 2m, with values of 10% or less are from the northeast branch (SG to PML in Fig. 2). The high clay content (20 – 0%) shown above in the bottom 2m are from the southeast branch, Zones A to G in Fig. 1. Moisture content from “undisturbed” rotary core samples.
4.2 Strength
SPT values measured on Crossrail varied from 20 to 200 in the upper sandier layers and 40 to 140 in the bottom, silty/ clayey 6 to 8m. There is some evidence for a higher mean value in the upper sandier zones than in the lower clayey sections.
The effective stress strength parameters from a large number of shearbox and drained and undrained triaxial compression and extension tests are shown in Figs 5 and 6. No cohesion was seen. A curved failure envelope with peak friction angle in compression (’p) varying with stress level was observed. At low stress levels of up to 400kPa, ’p was up to 42o and reduced to 37o to 39o for stress levels of 400 to 700kPa.
At higher stress levels, up to 2.5MPa, ’p could reduce to 35o. Ventouras and Coop (2009) measured comparable values of 34.1o to 38.7o for stress levels of up to 1100kPa.
In triaxial extension, a similar peak friction angle of 39o was measured (Fig 5). This contrasts with Ventouras & Coop (2009) who measured 30o in extension for a single sample. The reason for this differing finding is not known.
Critical state friction angle was measured as 33o +/-1o from shearbox tests (Fig. 5). There was no significant effect of weathering or fines content. This critical state strength measurement is consistent with the angle of repose of 33o +/-1o measured by pouring dry sand on a glass plate. It is also similar to a value of 32.3o reported by Ventouras & Coop (2009), which did not vary with stress level up to ~20MPa.
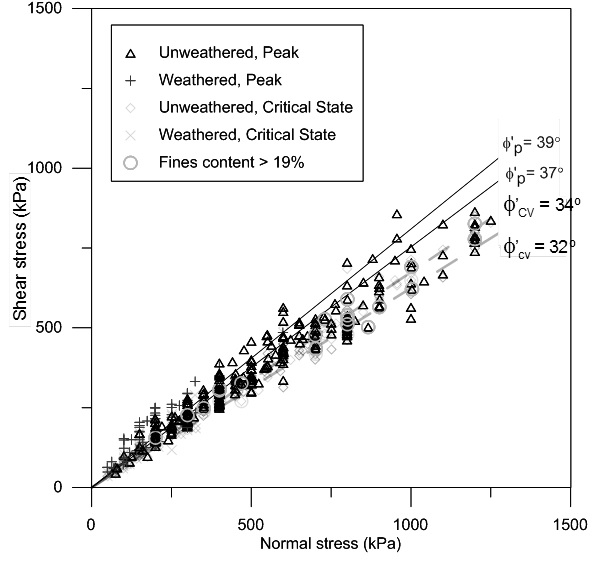
Figure 5 – Direct shear box tests on “undisturbed” rotary core samples and disturbed samples tamped to the in-situ density.
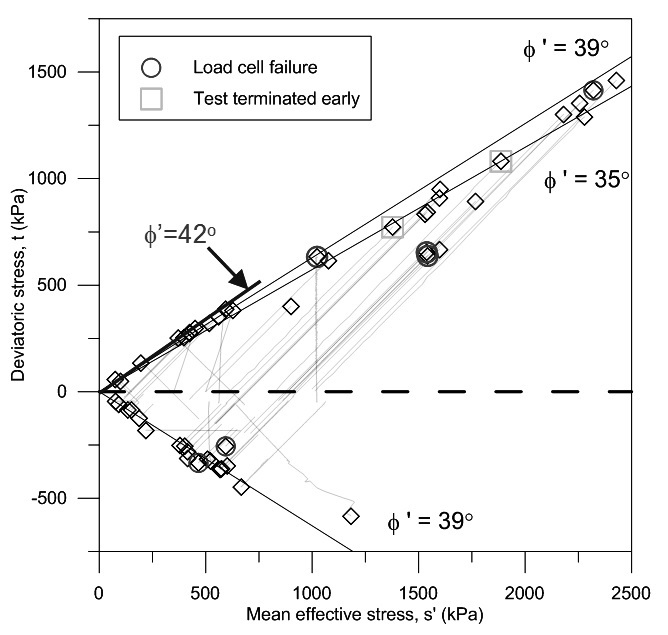
Figure 6 – Stress paths and peak strength from shear stage of triaxial tests on “undisturbed” rotary core samples. Samples were consolidated isotropically and anisotropically to in situ conditions and then sheared. Some tests on deep TS samples were terminated early because the load cell reached capacity. In a few tests, the load cell was overloaded and failed in compression or extension (connection failure).
4.3 Stiffness
Stiffness degradation curves for TS were obtained from triaxial tests with local instrumentation and from in-situ pressuremeter tests.
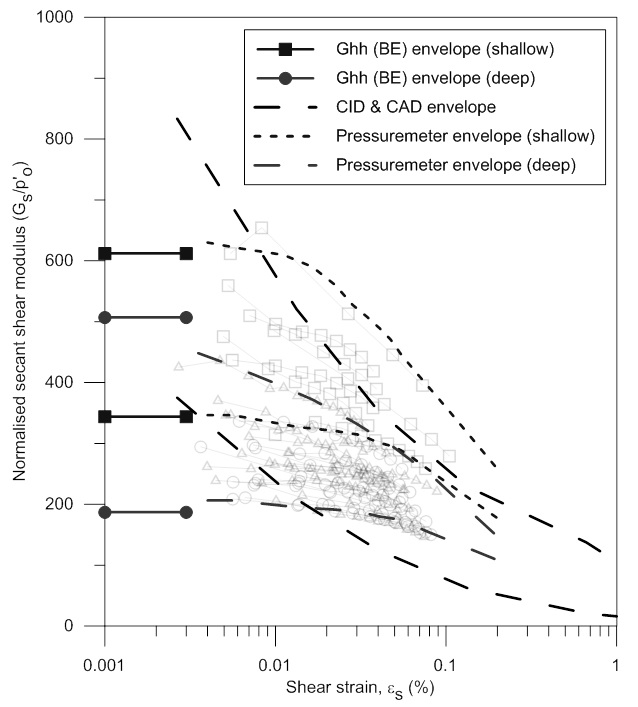
Figure 7 – Stiffness degradation curves normalised by mean effective stress at start of shear (p’o). Shallow TS have a base at depths up to 18m (e.g. Locations H to J in Fig 1). Deep TS have a base at depths of 40m to 60m (e.g. Locations A to F in Fig 1).
In sands, the pressuremeter tests were drained and effective stress levels increased significantly during the test. Stiffness was therefore interpreted from load-unload loops using the method of Jardine (1992) but incorporating Bellotti et al (1989) to account for the large changes in stress level. Results are shown in Fig 7. A non-linear response with good correlation between the in-situ and lab data is shown. The shallow TS shows a higher normalised stiffness, possibly due to a higher degree of over consolidation. No effect of weathering on stiffness was observed. The pressuremeter test shears the soil in a horizontal plane. The horizontal small strain shear stiffness, Ghh, from good quality bender element tests on triaxial samples are compared to the pressuremeter data in Fig.7 and can be seen to match very well.
4.4 Ko profile
Data on the in-situ stresses in the TS is presented in Fig 8 as Ko, the coefficient of earth pressure at rest. Ko was derived from high quality in-situ pressuremeter tests and theoretical modelling (Burland et al, 1979) that reproduced the last significant geological processes, namely deposition of the full London Clay thickness, followed by its erosion to current local thickness and then deposition of the RTD and SD layers and the pre-tunnelling groundwater conditions (see Fig. 1). Profiles for the deep and shallow TS are given together with a nominal design line.
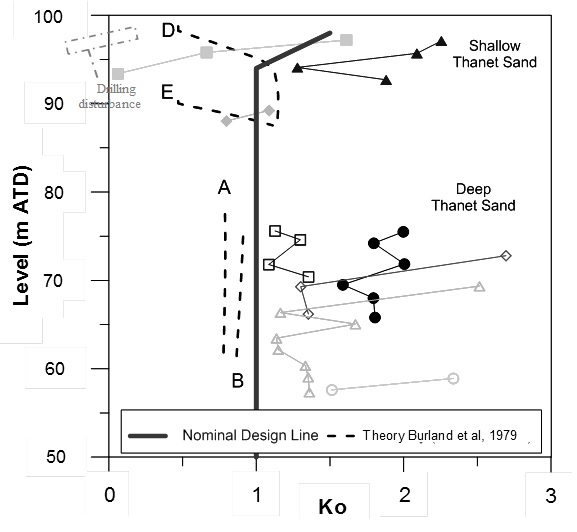
Figure 8 – Coefficient of earth pressure at rest (Ko) measured at boreholes in TS using pressuremeters with displacement measuring feeler arms (self-boring & high pressure dilatometer types). Theoretical values derived for local conditions at Locations B & C (deep TS) and H & J (shallow TS), see Fig. 1. Levels; 100m ATD (metres above tunnel datum) = 0m Above Ordnance Datum.
4.5 Permeability
The permeability of the TS was determined from various means as shown in Fig. 9. The most reliable information on mass permeability was from pumping tests at stations and portals where dewatering was necessary for construction. Horizontal permeability of the TS was measured to be about 10-5 to 10-6 m/s. The higher value may reflect nearby geological complexities such as faulting and drift filled hollows. The clayey basal units of the TS, where it exists, has a lower permeability of about 10-7 m/s. This reduces the vertical permeability of the whole TS formation. This is illustrated by experience from dewatering at Canary Wharf area, which has been ongoing for several years for various projects with abstraction from the CK and under-drainage of the overlying TS. The clayey TS basal layer maintained a perched water table in the TS that slowly declined but was still sustained for 5 years.
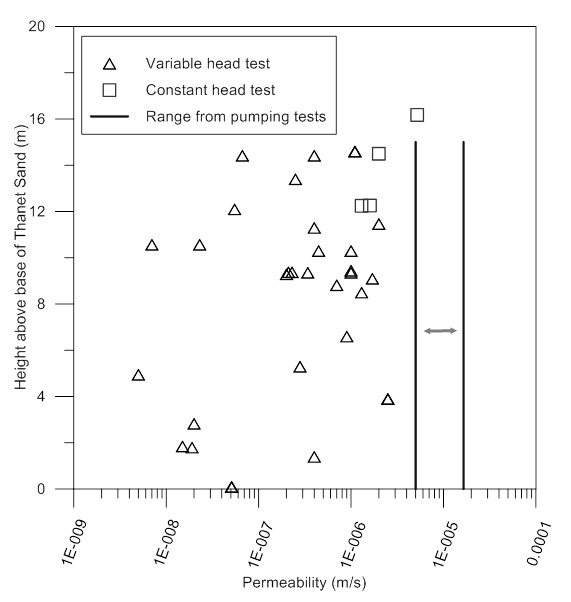
Figure 9 – Permeability from laboratory tests (constant head) and in-situ tests (variable head tests in piezometers and field pumping tests).
5. Observed engineering behaviour
Nicholson et al, (2002) noted that the bearing capacity of piles founded in the TS base (where the material is a clayey sand/ sandy clay) is significantly lower than that for higher up in the stratum where the TS is a sand. This can lead to a reduction in pile capacity with depth. For tunnel boring machine works, however, the TS was observed to be benign. Typical volume losses for earth pressure balance TBM passage (full-face in TS) was 0.5% to 1% (Location A, Fig 1). For the slurry TBM, volume loss was much lower, no more than 0.25%, but the stretch in full-face TS was limited (Location I, Fig. 1).
Suitable dewatering was required for open face tunnelling, but this was achievable. The TS could retain suctions from lowering of the water table. When augmented with vacuum wells, vertical faces with good stand-up time were obtained, which facilitated open face construction (Fig. 10).
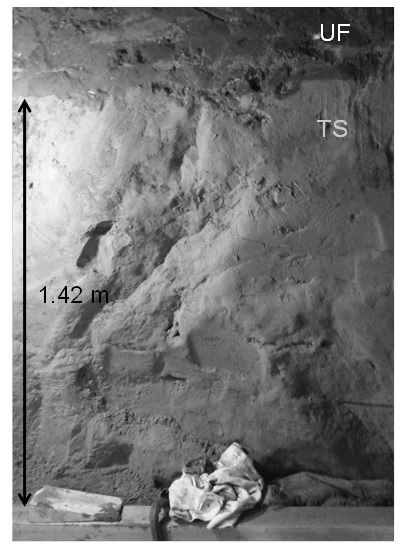
Figure 10 – Photograph of TS in excavation for Cross Passage 13 (point D in Fig. 1). The upper TS stood as a stable face with clear tool indentations in an open excavation, with vacuum well facilitated dewatering. Note UF-TS interface.
6. Conclusions
The unique opportunity provided by the Crossrail project has been used to investigate the TS Formation and update the geotechnical parameters and construction experience to date. This could be useful for other projects in similar ground. The TS was found to be a dense competent sand, with variations in fines content that to differing engineering responses. There was no discernable effect of weathering on particle size distribution, bulk density, strength and stiffness.
References
- Bellotti, R., Ghionna, V., Jamiolkowski, M., Robertson, P. K. & Peterson, R. W. (1989). Interpretation of moduli from self-boring pressuremeter tests in sand. Geotechnique 39, No.2, pp. 269-292.
- Berry F. G. (1979) Late Quaternary scour-hollows and related features in central London. Quarterly Journal of Engineering Geology and Hydrogeology. Vol. 12, pp. 9-29.
- Burland, J. B., Simpson, B. & St. John, H. D. (1979). Movements around excavations in London Clay. Proc. 7th Eur. Conf. Soil Mech., Brighton, 1, pp. 13-29.
- Jardine, R.J. (1992). Some observations on the kinematic nature of soil stiffness. Soils and Foundations, Vol. 32, No. 2, pp. 111-124.
- Nicholson, D., Chapman, T. & Morrison P. (2002). Pressuremeter proves its worth in London’s Docklands. Ground Engineering, March pp. 32-34.
- Kolbuszewski, J. (1948). An experimental study of the maximum and minimum porosities of sands. Proc. 2nd ICSMFE, Rotterdam, Vol. 1, pp. 158-165.
- Ventouras, K. & Coop, M. R. 2009. On the behaviour of Thanet Sand: an example of an uncemented natural sand. Geotechnique 59, No. 9, pp.727-738.
-
Authors

Chris Menkiti - Geotechnical Consulting Group
Geotechnical Consulting Group

John Davis EurGeol CGeol MSc DIC - Geotechnical Consulting Group
John was seconded to the Chief Engineers Group within Crossrail from Geotechnical Consulting Group LLP from 2009 until July 2016.
Within the Chief Engineers Group John was responsible for all Crossrail geotechnical matters east of Farringdon. Whilst at Crossrail John was also closely involved with the production of Geotechnical Baseline Reports for all the major Civils contracts. Prior to Crossrail John spent 20+ years as a geotechnical designer working on a diverse range of structures across the world, these included deep basements, embankments, tunnels, slopes and retaining walls. John was seconded to London Underground for a couple of years in the mid 90’s where he led a research programme on the impact of rising groundwater on the tube network.
K. Semertzidou
GCG
C.O.R. Abbireddy
GCG
D. W Hight
GCG
J. D. Williams
GCG

Mike Black BSc(Hons) MSc CSci CGeol FGS - Crossrail Ltd
Mike is the Head of Geotechnics within Crossrail’s Chief Engineer’s Group. Mike’s role is to provide technical and professional leadership for all geotechnical aspects for the tunnelling and civil engineering sub-surface infrastructure work. He has been on the Crossrail Project since 1993 and has been involved in all stages of development of Crossrail from feasibility design, through the Parliamentary Bill process, ground investigations, civil design and construction. Prior to joining Crossrail, Mike worked in the oil and gas industry in the North Sea, the Channel Tunnel, the A27 Brighton & Hove Bypass and the Jubilee Line Extension.
https://www.linkedin.com/in/mike-black-4aa9b81b?trk=hp-identity-name
