Ground Improvement Measures in Advance of Drive G TBM Arrival at Victoria Dock Portal
Document
type: Technical Paper
Author:
Juan Ares, Garry Savage, ICE Publishing
Publication
Date: 31/08/2016
-
Read the full document
Introduction
Drive G tunnels
Drive G are 0.9 km tunnel drives between Limmo Peninsula shaft and Victoria Dock Portal, forming part of the C305 Eastern Running Tunnels. The Tunnel Boring Machines (TBMs), Jessica and Ellie, were launched in June and September 2014. Jessica and Ellie were previously used to construct the 2.7 km tunnel drives from Pudding Mill Lane portal, near Stratford, to Stepney Green. The machines were then dismantled, lifted out of the shaft and transported by road from Stepney Green to Limmo Peninsula, where they were re-launched to drive the Drive G tunnels. These were the only machines on the Crossrail project to undertake two separate tunnel drives.
From the Limmo Peninsula Shaft, the running tunnels were driven eastwards passing beneath the DLR Woolwich and Beckton branches, the running tunnels and portal structure of the LU Jubilee Line, and the A1020 Silvertown Way viaduct. The tunnels then ascended at maximum gradient of 3.3% towards the Victoria Dock Portal, excavating through a 100 m section of superficial deposits above London Clay, which had been previously treated by permeation grouting and soil mixing techniques. The TBMs broke through in the portal with only 3.5 m cover (half a diameter) in August and October 2014, respectively.
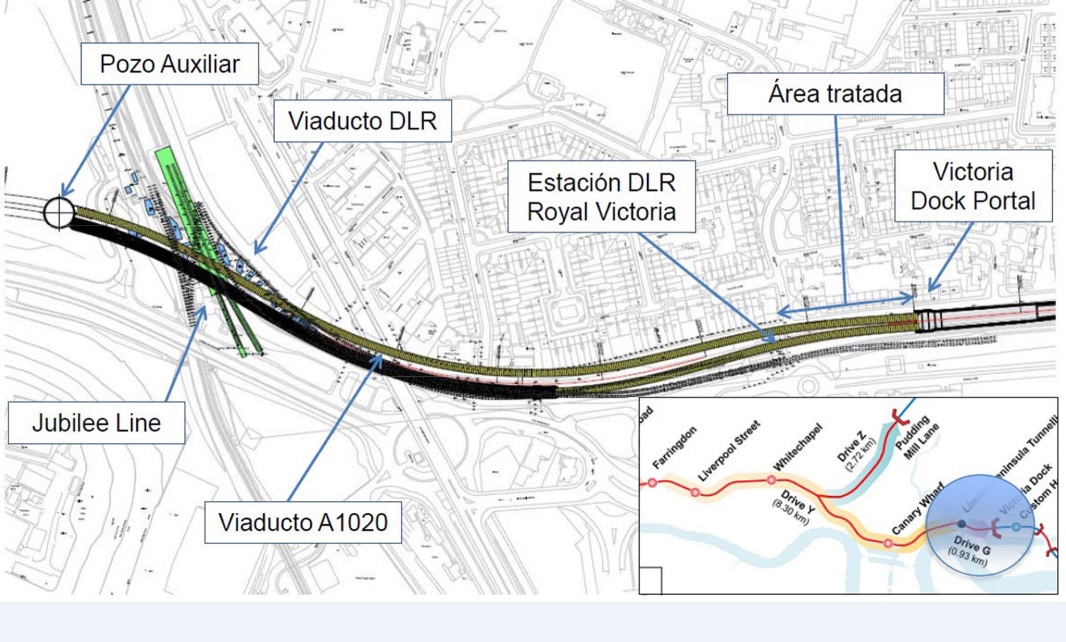
Figure 1 – Drive G running tunnels Mitigation measures
Advance Works were required near Victoria Dock Portal in advance of TBM arrival, including construction of an anti-flotation slab at the surface immediately to the west of the portal headwall and treatment of the superficial deposits above the London Clay to maintain stability of the TBM face for the tunnelling works.
The main purpose of this treatment was protecting the nearby third party assets that were very sensitive to ground settlement and distortion by improving the stability of the excavation face thus mitigating the potential risk of over excavation and enabling better control over the ground movement.
Approaching the portal, the thickness of solid geology/cover above the tunnel reduced. As a result there was an area with a length of approx. 340 m with a low cover of solid geology (<1D) that was vulnerable to settlement and heave.
Only the last 125 m for Eastbound and the last 150 m for Westbound could be treated to provide a cover of solid geology of at least 2 m. Grouting of the River Terrace Deposits (RTD) and the Alluvium was essential to provide an undrained shear strength to prevent ravelling and cavitation, which at this shallow depth could result in a sinkhole at the surface.
Ground movement predictions also indicated the need to undertake physical mitigation works at the DLR Royal Victoria Station. In this case, the connections between the lifts, the stairs and the footbridge were released to allow these elements to move independently as the TBMs passed underneath, reducing the risk of undesirable stresses if they remained connected. The base of the footbridge column bolts were also released and temporary cross bracing installed. The connections will be reinstated after post-tunnelling movements have substantially ceased.
Several measures were also undertaken on utilities themselves:
- Temporary diversions of the 1400 mm sewer (including laterals) and 15” water main were put in place to facilitate re-lining and replacement works.
- Non-destructive testing (NDT) was carried out on the water mains in Victoria Dock Road to give indication of whether the pipes would fail under the settlement caused by TBM From the results of the NDT, it was decided that the 15” water main running up Victoria Dock Road was liable to failure under TBM settlement and therefore needed to be replaced.
- The 1400 mm diameter sewer was lined using a CIPP (Cured in-place pipe) This is currently the largest CIPP liner installed in the world, over the greatest length.
- The 14 domestic gas main on Victoria Dock Road was in poor condition and susceptible to failure under settlement cause by the TBM It was internally lined using welded MDPE (Medium density polyethylene) pipes.
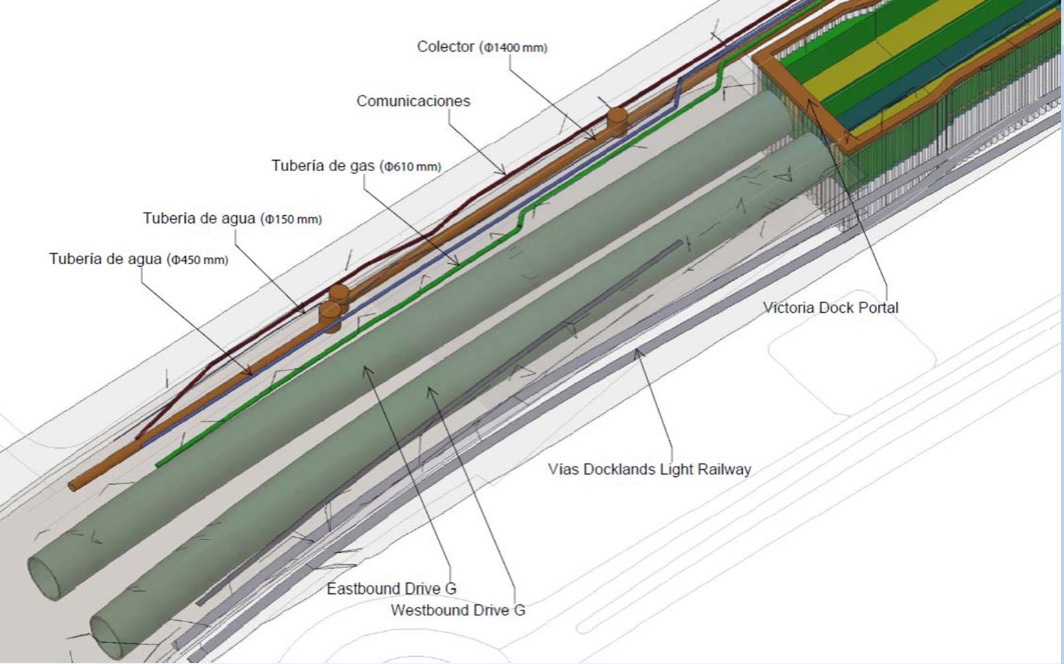
Figure 2 – Overall view of running tunnels and stakeholder assets Ground treatment at Victoria Dock Portal
Detailed design
A series of collaborative weekly workshops between the Project Manager, the Asset Protection Engineer, the Contractor and the specialist subcontractor Geocisa) were set-up, with the aim of reaching an engineering agreement on what “the best achievable solution” for the ground treatment was. Furthermore, Crossrail along with the Central Engineering Group reviewed the proposals for ground treatment with the Expert Panel in order to gain endorsement for the ground treatment scheme, which significantly differed from the original design intent mainly due to the as-built position of NGG IP gas main and the lack of access to certain locations, in particular under DLR Royal Victoria Station and Victoria Dock road.
Within the agreed solution for this area, there were four different zones which require a different methodology and approach (see figure 3).
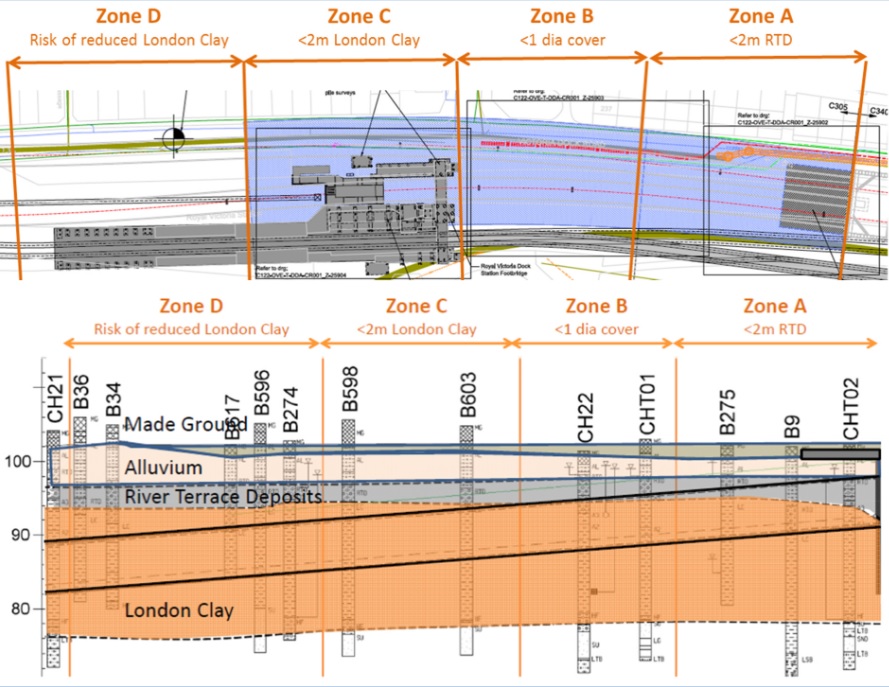
Figure 3 – Different zones of the ground treatment Zone D [1]
Zone 20 m before the tunnels reach the DLR station where the cover of London Clay above the tunnel is more than 2.0 m. The main risk in Zone D was the confirmation of reduction of London Clay on top of the EB tunnel that was shown in the historical borehole B617 carried out on November of 1988, which showed deep deposits of RTD.
An extra geological investigation based on Cone Penetration Tests (CPTs) was performed to confirm the levels of the different soil layers in Zone D. The results of all of them showed defined levels of these soil layers, and the possibility of finding RTD below crown level as suggested in B617 was very unlikely. In any case, and in order to take into account any residual risks, the TBM chamber was full, the advance rate was reduced to 40 mm/min and the fluid addition was increased during excavation. The RTD formation was eventually not encountered and face pressure was kept at target value of 1bar.
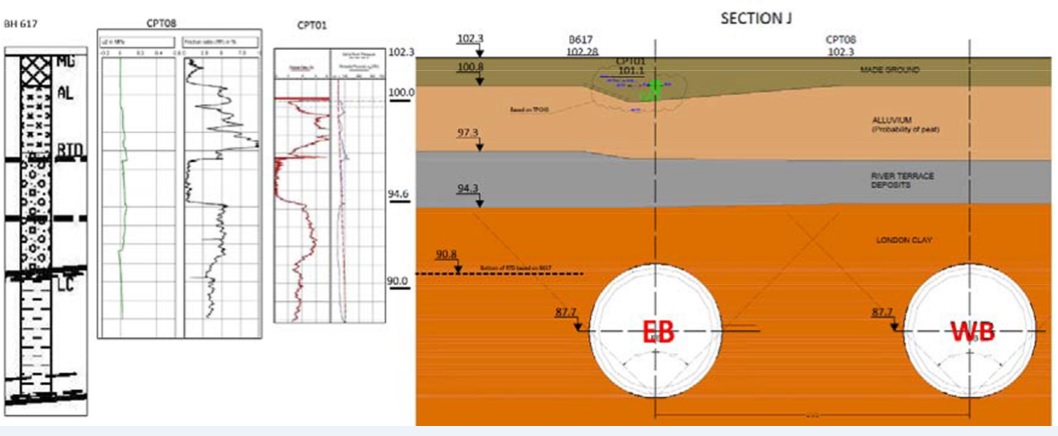
Figure 4 – Zone D typical cross section, borehole B617 and CPTs 01 and 08 Zone C [2]
Approximately 60 m zone at DLR Royal Victoria Station where London Clay cover decreases from ~2 m to ~0.5 m. The ground improvement strategy was for limited permeation grouting undertaken where practicable through a series of vertical PVC TaMs (i.e above the Westbound tunnel only) to provide a minimum of 2 m solid geology.
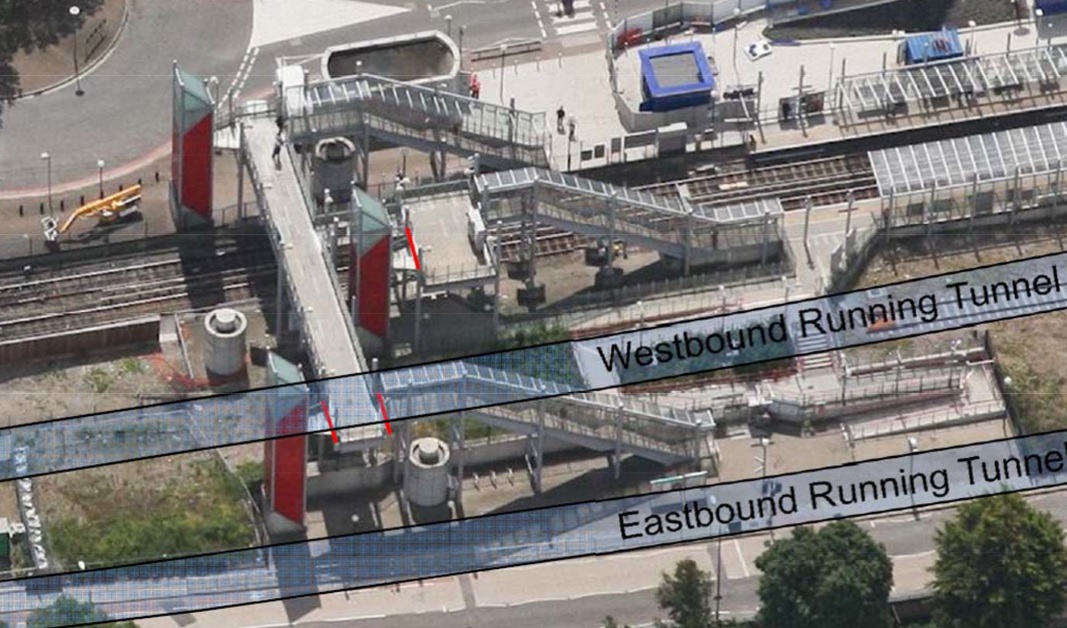
Figure 5 – Drive G tunnels beneath DLR Royal Victoria Station 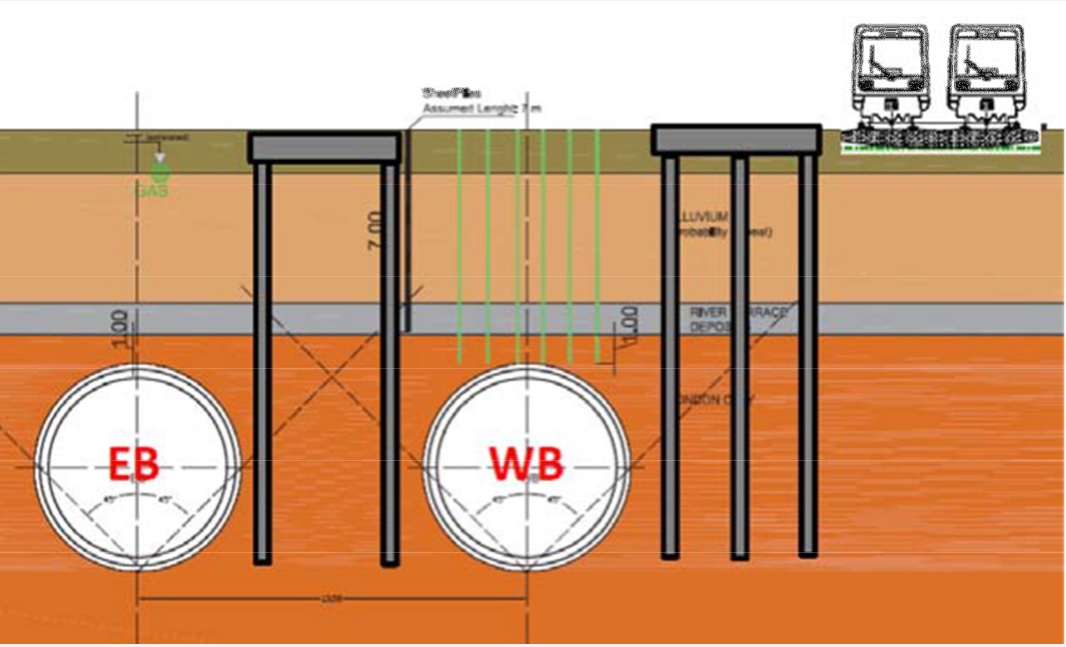
Figure 6 – Zone C typical cross section, station foundations and treated area above WB tunnel In this zone, the extent of ground improvement was limited due to the presence of piled foundations and sheet piles under Royal Victoria Station and the presence of services in the pavement and footpath along Victoria Dock Road. Preventing drilling to the north of Royal Victoria Station, access was only vertically from the surface.
Zone B [3]
Approximately 65 m zone between Zone A and DLR Royal Victoria Station where ground cover is less than one TBM diameter (from ~8 m to ~6 m) but was feasible to provide a minimum of 2 m solid geology. The Eastbound TBM passed under Victoria Dock Road utilities. A sub-horizontal steel TaM barrier was built under the utilities to mitigate the settlements. A micropile barrier was built along the DLR boundary on the south side of the site to act as a settlement trough cut-off barrier.
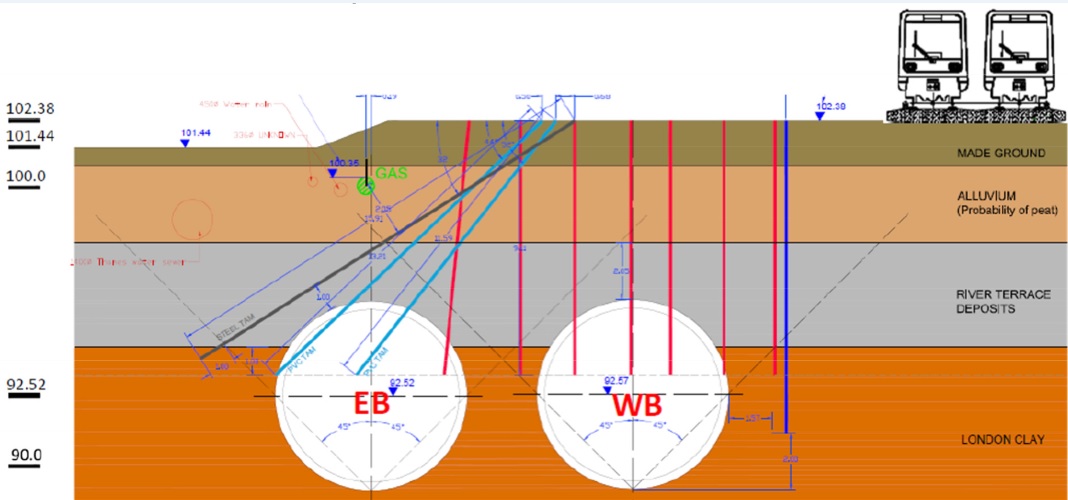
Figure 7 – Zone B typical cross section, utilities and DLR tracks Zone A [4]
Approximately 60 m zone at the end of Drive G where ground cover from TBM crown to surface reduces from ~6 m to ~4 m (less than one tunnel diameter), and at the same time the RTD comes into TBM face. At this location the NGG 600 mm gas main passed over the Eastbound tunnel with circa 4 m radial clearance. The ground improvement strategy was for permeation grouting undertaken in the RTD. A sub-horizontal steel TAM barrier and micropiles were undertaken under the utilities to mitigate the settlements. A micropile barrier continued along the DLR boundary on the south side as for Zone B. In the 30 m close to the portal, where the NGG gas main was diverted from above the EB tunnel crown, soil mixing techniques were used to treat the alluvium and made ground. The adjacent 8 m of alluvium were treated by means of silicate permeation grouting. Jet grouting was disregarded as it was an aggressive technique and at risk of damaging 3rd parties’ assets.
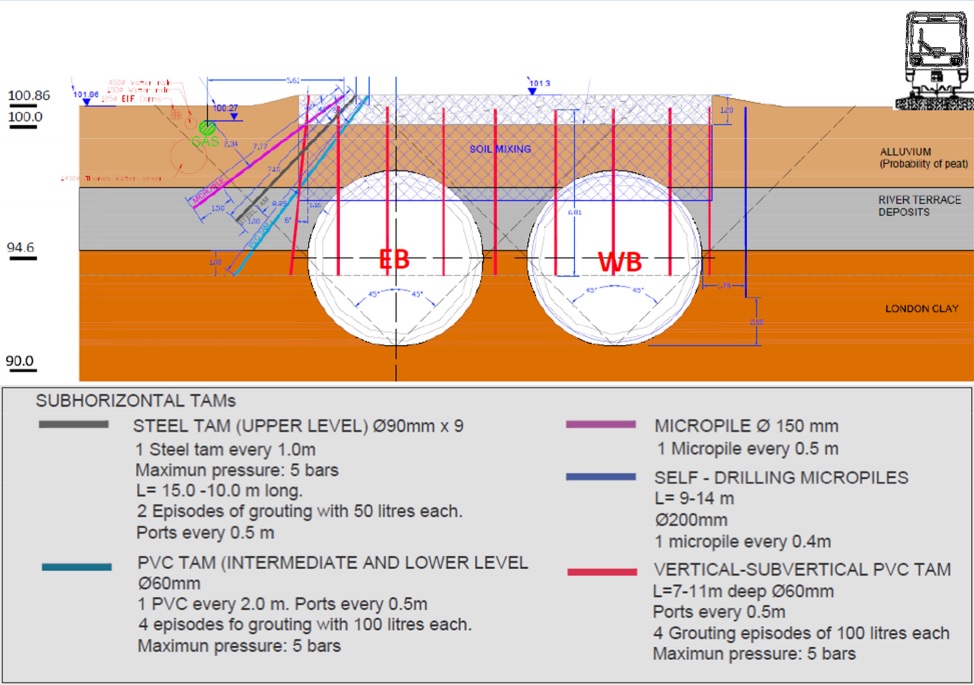
Figure 8 – Zone A typical cross section, utilities and DLR tracks Verification of the detailed design
In order to verify the effectiveness of the ground treatment detailed design, different scenarios and methodologies were developed, such us empirical correlations (where the settlement trough can be represented by a Gaussian distribution curve), a Plaxis 2D non- linear finite element model (to estimate the benefits of the micropile walls and the sub- horizontal TaMs, but where the volume loss is still a pre-defined factor) and eventually a series of FLAC3D numerical models (where the inputs are soil parameters, groundwater conditions, ground improvement works, TBM operational parameters and the outputs volume loss, settlement and distortions).
With regards to the empirical methods, for which the settlement troughs depends to a large extent on the value of the trough width parameter “K” that relates to the cohesion of the soil, the depth of the tunnel and the inflexion point of the trough, there are a significant amount of studies for deep tunnels excavated in granular or cohesive materials. However, the information available for tunnels excavated in very shallow cover is limited and variable. In addition to this, brown field conditions such as existing foundations, cut-off barriers, etc, cannot be incorporated into this type of ground movement assessment.
A second analysis was then carried out using a Plaxis 2D non-linear finite element model, where the main variable is the volume loss. With this parameter, the surrounding ground properties and the brown field conditions, the settlement trough is no longer a Gaussian curve and the impact on third parties assets can be more accurately assessed, keeping in mind the limitation that the volume loss is always an input to the model.
Due to the sensitive circumstances and acknowledging that the empirical methods and Plaxis 2D input either the volume loss or the trough width parameter K, a series of three-dimensional analysis (FLAC3D) were developed [5]. This numerical model allows modelling the EPB machine excavation and operational parameters, cut-off wall barriers (micropiles and steel TAMs), protection slab, soil and groundwater conditions, ground treatment and the Victoria Dock Portal, to evaluate anticipated volume loss based on different scenarios and the effects on the existing Royal Victoria Station, DLR tracks and nearby utilities (such as 1400 mm Thames Water Sewer and 600 mm Gas Main). One of the main advantages of using 3D models for calculations is that it is not necessary to simulate the effect of the tunnel’s face by using a relaxation factor, as it is done in 2D models in which the convergence-confinement method is used.
The 3D model covered up to 11 scenarios based on a the combination of failure of ground treatment properties (reduce soil mixing’s deformation modulus, reduce permeation grouting’s deformation modulus and cohesion in RTD, reduce flexural stiffness of cut-off walls) and failure of the TBM EPB’s performance (reduction of the face pressure by 50%, increased hardening time of the bi-component, incomplete backfilling of the tail gap), in order to evaluate the different settlement mechanisms independently.
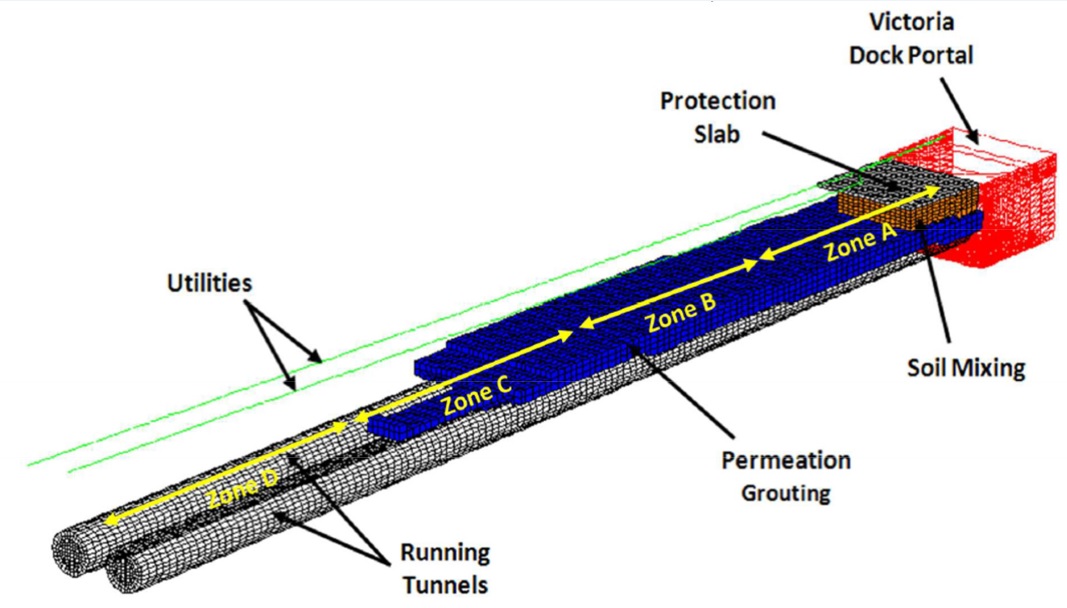
Figure 9 c – Detail of the FLAC3D numerical model: Ground Improvement, protection slab and utilities The conclusions obtained from the numerical models covered, among others, the following aspects:
Settlement trough and Volume loss
- If the ground is improved, the risk associated to an inefficient TBM operation is reduced
- Ground improvement (permeation grouting and soil mixing) reduces markedly the volume loss nearby Victoria Dock
- The protection slab particularly reduces the transmission of ground loss to the surface
- Although the volume loss is not particularly reduced by the cut-off walls, the maximum values of the settlement trough are confined between the barriers reducing the impact on the 3rd party The area of influence of the settlement trough is reduced by the cut-off walls.
- The volume loss (measured at the surface level) will be close to 1% during the excavation of the second tunnel due to the alteration of the ground by the first TBM
- An increase in the hardening time of the bi-component will not produce an important increase of the volume loss at surface level or the ground loss at tunnel
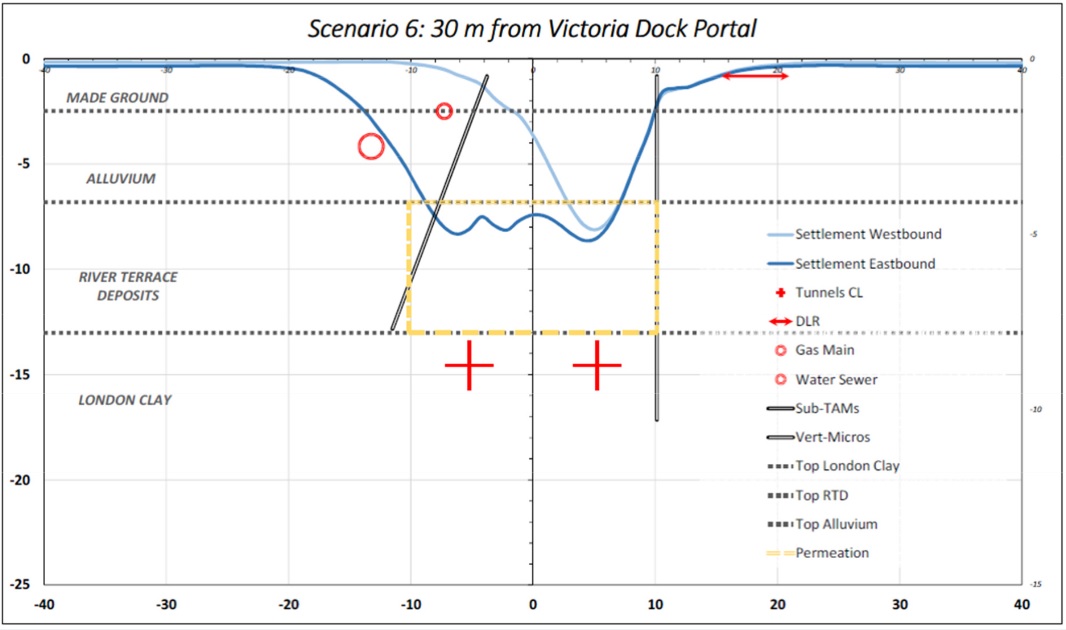
Figure 10 – Settlement troughs of one of the scenarios 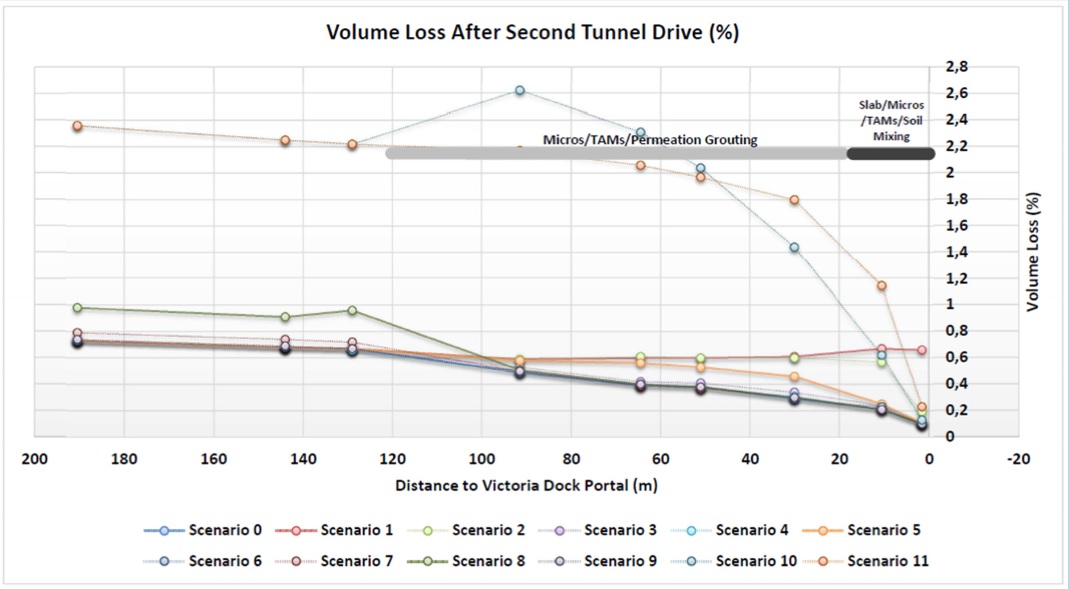
Figure 11 – Anticipated Volume Loss for each scenario analysed (second TBM) Figure 11 clearly reflects the reduction of volume loss due to the permeation and soil mixing ground treatments, as well as protection slab installed close to Victoria Dock Portal, even if the TBM fails to operate correctly. This also proved the need for a careful operation of the TBM, with both the injection of bentonite through the shield and the filling of the void between the segment lining and the ground with bi-component working correctly.
Impact on utilities
- Permeation grouting, soil mixing and cut-off walls contribute to reducing the settlement experienced by the
- Settlement on the water sewer reduces as Victoria Dock Portal is approached because the area of influence of shallow tunnels is
- Efficient and consistent control of the TBM parameters reduces settlement as well as distortion/differential
- Point A (figure 12) illustrates an increase in the longitudinal slope in the contact between the ground improvement area and the untreated
- Point B (figure 12) shows a peak in the longitudinal slope associated to the interruption in the vertical
- Point C (figure 12) highlights the benefit of the ground treatment and cut-off barriers to protect the gas
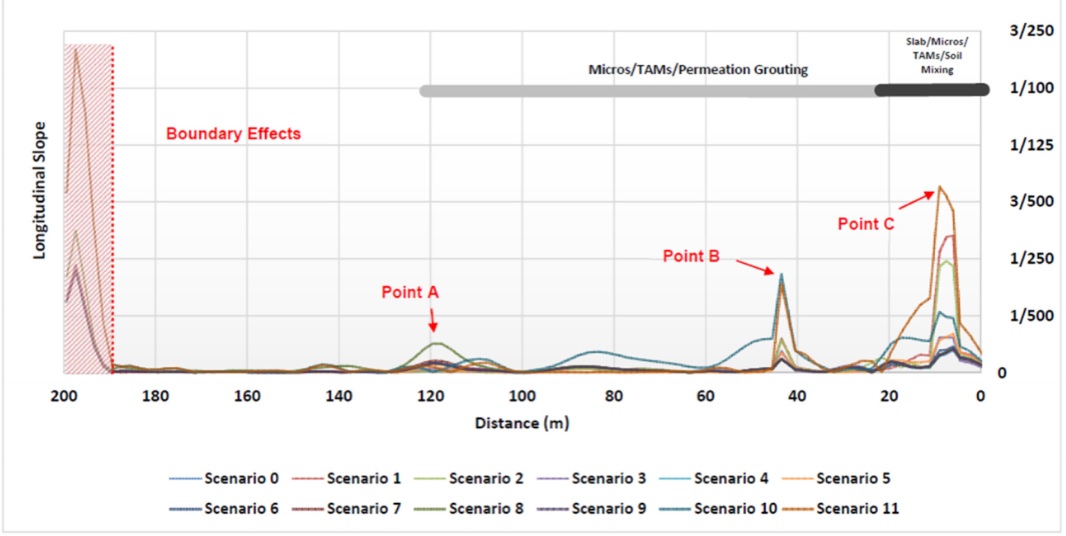
Figure 12 – Φ610 Gas Main – Longitudinal slope Impact on DLR tracks and Royal Victoria Station
- Vertical displacements decrease close to VDP because the zone of influence is smaller for shallow tunnels.
- Efficient and consistent control of the TBM parameters reduces settlement as well as distortion/differential movement.
- Point A (figure 13) illustrates an increase in the longitudinal slope in the contact between the ground improvement area and the untreated soil.
- Point B (figure 13) demonstrates the benefit of improving the soil close to VDP.
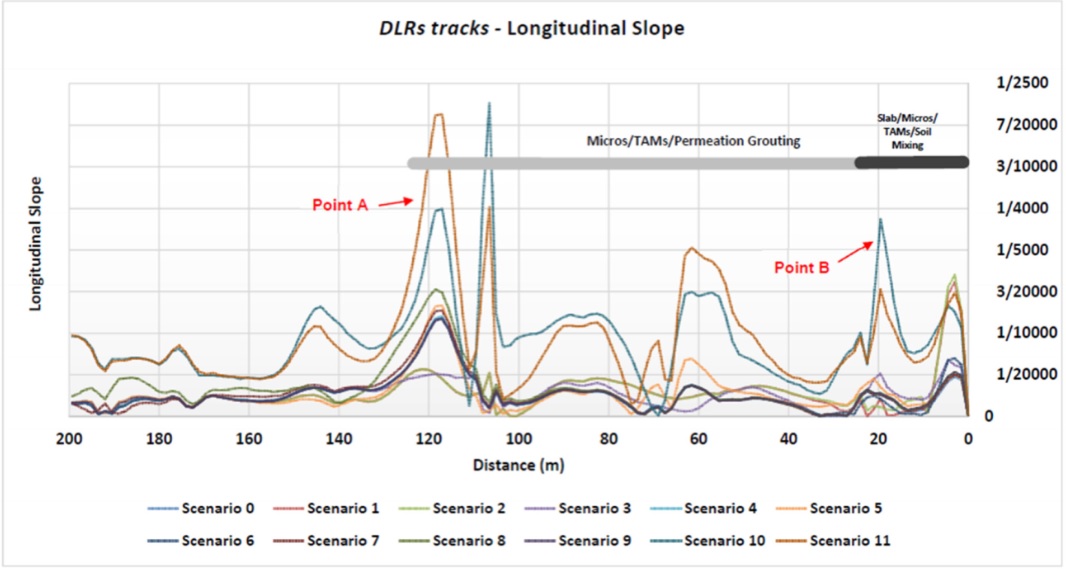
Figure 13 – DLR tracks longitudinal slope Implementation on site
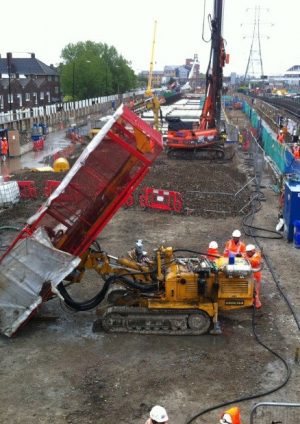
Permeation grouting in RTD
In order to improve the properties of the RTD, the most suitable technique was permeation grouting, as the fines content was less than 15%. This type of ground improvement increases the cohesion of the ground by injecting grout to fill the voids. The grout mix was a combination of a cement-bentonite low viscosity mix and chemical grouts.
For the TaM pipe installation, a temporary casing was used to minimise movement and the TaM installed in the corresponding drill-holes using the drilling machine. The injection process was carried out in a hit and miss basis once all the TaM pipes were installed and the sealing injection complete. The injection parameters and the movements experienced on the 3rd parties’ assets were reviewed on a daily basis at Shift Review Group meetings (SRG) and depending on the results the way forward would be amended as required.

Figure 14 – Permeation grouting nearby Victoria Dock Portal For most of the grouting episodes, refusal was achieved by pressure, being the average volume and pressure per port and episode of 67 litres and 3.9 bar respectively. The average ratio between the injected volume of grout and the volume of soil to be treated was 16.9 % (target was 15-20 %).
In order to validate that the target parameters (Unconfined Compressive Strength and permeability) were achieved, 17no CPTs (Cone Penetration Tests) were carried out during the execution of the ground treatment with a different number of episodes and also a series of boreholes, with shear vane tests in the alluvium and 10no. Lefranc permeability tests in the RTD[6,7,8].
Wet soil mixing in Alluvium and Made Ground
Lessons learnt from Pudding Mill Lane ground treatment indicated that permeation grouting was not a suitable improvement measure for Alluvium and Made Ground, creating heave on ground and utilities and not reaching the desired ground strength. Wet soil mixing improves of weak soils by mixing them with cementitious binder slurry, creating a series of columns of increased strength and reduced permeability. To build these columns, a rotatory drill with radial mixing paddles advanced until the target depth, from which it grout is injected through ports located at the drill kit.
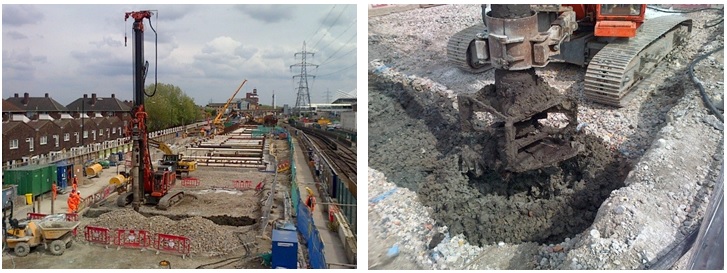
Figure 15 – Soil-mixing at Victoria Dock Portal A total of 258 columns were necessary to treat this area. The diameter of the soil mixing columns was 1.50 m and the overlap between them was 20%. It means a maximum centre to centre column spacing of 1.2 m for 1.5 m diameter columns. The column length was 3-4 m with a target maximum level of penetration into the RTD of 0.5 m. Drilling parameters such as the penetration rate and torque were used to verify the penetration, considering that the penetration rate decreased whereas the torque increased when drilling through the RTD.
The column distribution on the nearest 15 m to the portal was block pattern (figure 16) because in this area the TBM face pressure would decrease from 1 to 0 bar for breaking through into the portal in an unpressurised mode. In the zone between 15 and 30 m away from the portal, the distribution was a grid pattern (figure 16), and in order to create a smooth transition between the treated and non-treated alluvium, a series of vertical TAMs were grouted in the alluvium using silicate grout for 8m just immediately after the soil mixing area.
In a similar way to the permeation grouting, in order to validate that the target parameters were achieved in the soil-mixed area, 9no CPTs (Cone Penetration Tests) were carried out but there was no need to carry out additional permeability tests as the Alluvium already met the specified value[9].
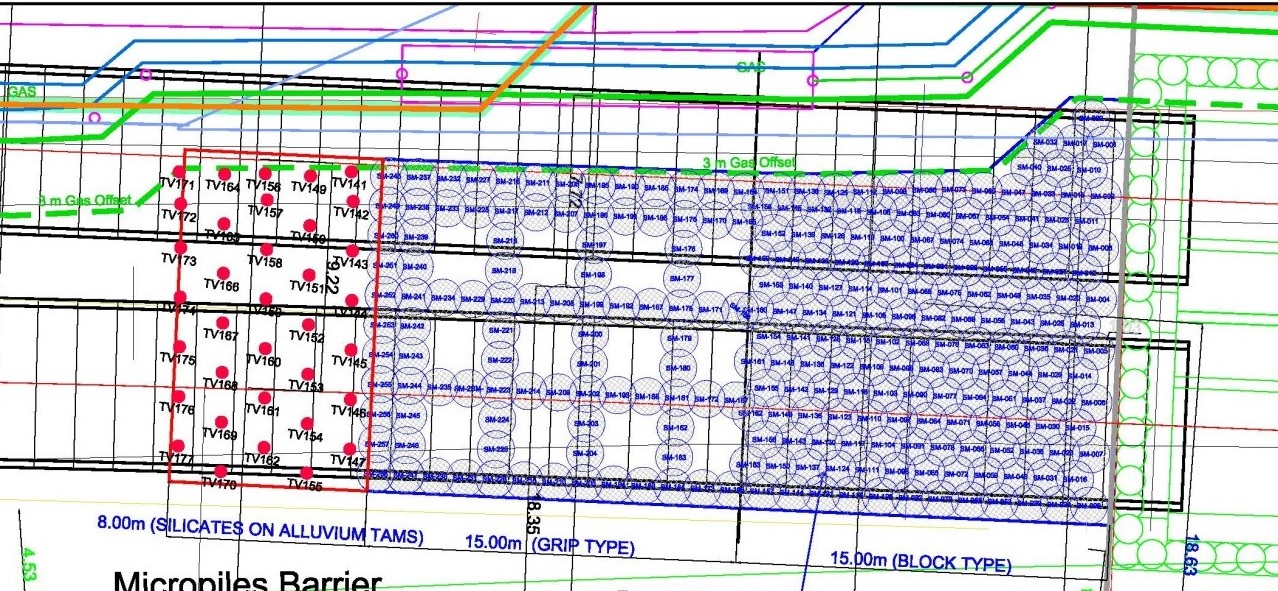
Figure 16 – Soil Mixing plan Settlement trough cut-off barriers
In addition to the permeation grouting and soil-mixing treatments, it was decided to create additional protection measures to the nearby assets by creating a physical barrier between the cause of the movement (tunnel excavation and ground treatment) and the assets to be protected (DLR tracks and utilities).
As the settlement of the wall would be less than the adjacent soil, the settlement on the opposite side of the source of movement would be reduced, as shown in figure 10.
A micropile cut off barrier was installed between the tunnels and the DLR track. The length of these D200 microplies piles varied between 9 and 12.5 m, separated 400 mm and at a safe distance from the tracks of 8 m. The micro-pile cut off barrier was executed using the self-drilling technique that consisted of drilling a hole in the ground, installing steel tube reinforcement and grouting it in the same operation so the potential movements were minimised. On the other hand, following a similar approach, the PVC TaMs were supplemented by inclined steel TaMs which front protrude into the London Clay (Fig 17).
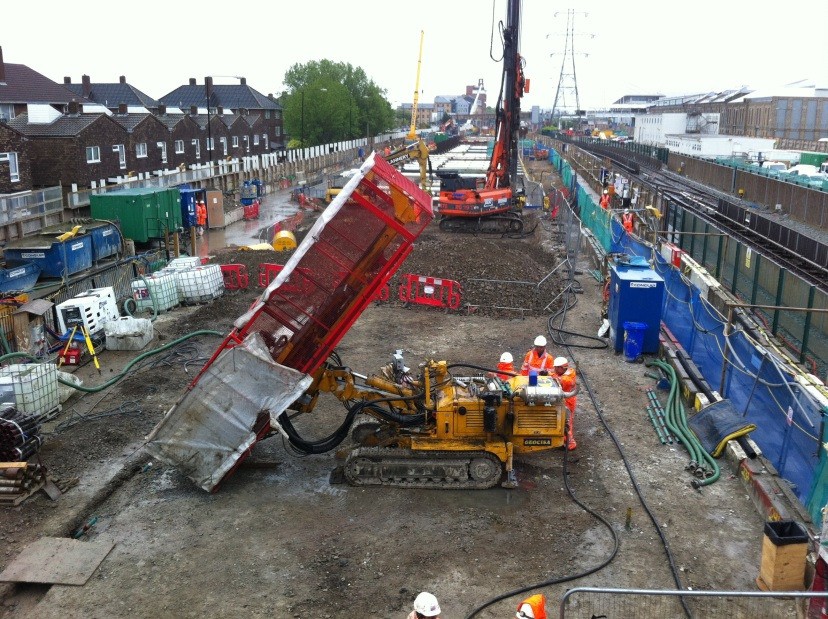
Figure 17 – Inclined steel TaM barrier Anti-flotation slab
In addition to the permeation grouting and the cut off barriers, an anti-flotation slab was cast on top of the soil-mixed area (Fig. 18). The main objective of this slab was to ensure the stability of the tunnels in this shallow location against a potential uplift before the first stage concrete was cast inside the running tunnel. The slab was also used to support the 600 t crane needed to lift the TBM shield and gantries outside the portal, and actively helped to minimise volume loss and hence to protect third party assets.
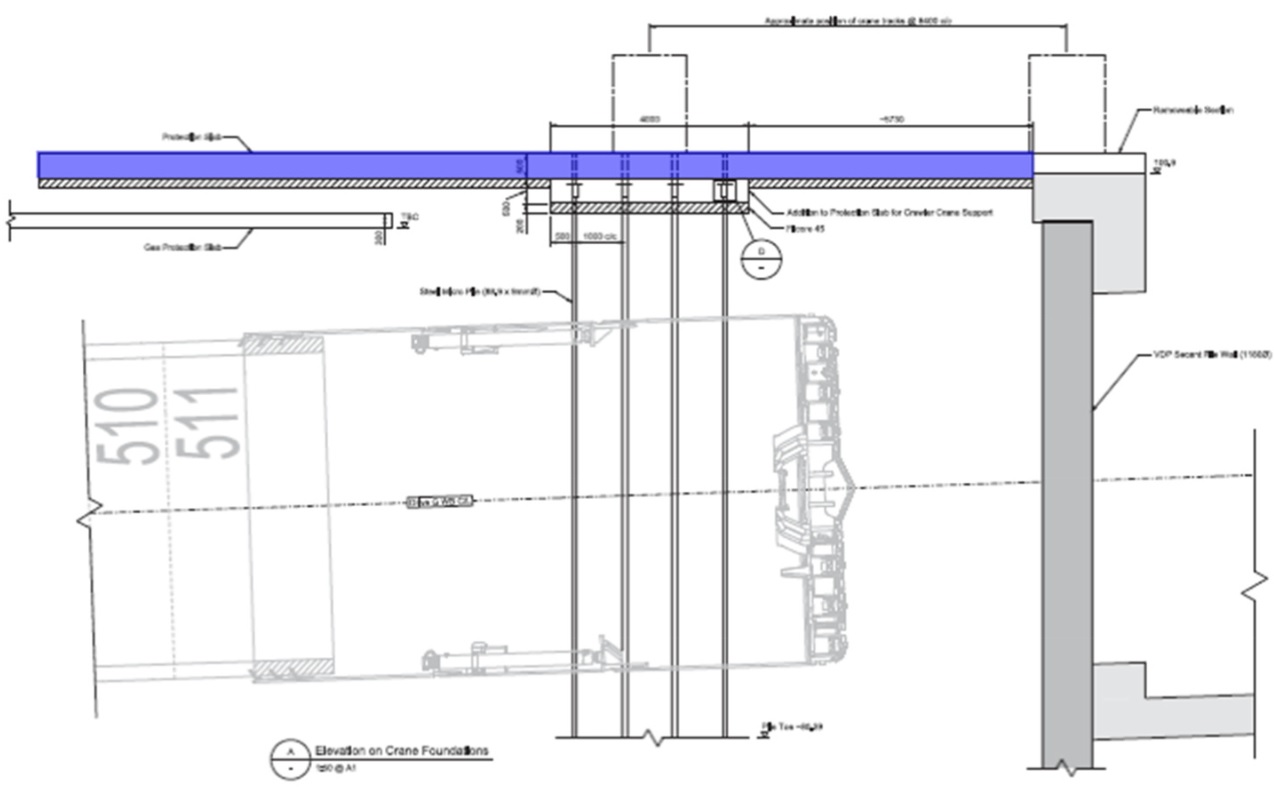
Figure 18 – Anti-flotation slab next to the portal Eastbound tunnel eye treatment
Following breakthrough of the WB TBM, there were observations that the water ingress was more than expected given the amount of ground treatment carried out. Whilst not a major concern it was decided that to mitigate the risk of a similar scenario during the EB breakthrough further measures should be explored. This was mainly due to the close proximity of the 600 mm IP gas main and the other utilities. The outcome was for further grouting in the EB soft eye in the portal, targeting the RTD and alluvium.
TBM excavation
TBM operational parameters
Drive G consisted of a variety of face conditions, each one demanding a different approach in evaluating the minimum and maximum allowable pressures to minimise against face loss/collapse and blowout/heave respectively. OTB Engineering, in conjunction with the Dragados-Sisk JV, developed the TBM operational parameters[10].
“As the TBM’s approach VDP the thickness of solid geology cover above the tunnel diminishes. As a result there is an area with a length of about 340m of less than one diameter and sensitive to settlement and heave. Only the last 124m for Eastbound and the last 144m for Westbound could be treated to provide a cover of solid geology of at least 2 m thickness. As the thickness of treated RTD reduced above the crown so reduced the ability to limit deformations (settlement/heave).
Ideally it would be best to provide as much face pressure as possible to limit deformation; however this runs the risk of creating heave, a delicate balance was required. What becomes critical is the chamber variation, as this could create excessive settlement if not enough or heave if too much. There is also risk that both could occur at the same location, weakening the ground; previously heaved ground could become focus for excessive settlement.
In order to determine the safe face pressure necessary, the maximum and minimum face pressure capacity needed to be determined.
Minimum face pressure
A minimum face pressure is required to prevent face loss/settlement. Approaching VDP, mixed face conditions occurred when the alignment entered the River Terrace Deposits and Alluvium which are unfavourable as a tunnelling medium. This combined with the fact that the tunnel’s gradient towards the surface diminishing the solid geology cover presented a critical design case where the applied face pressure is of a great importance in order to secure the stability of the face and the surface above. In mixed ground conditions the minimum face pressure applied should normally be equal to the pore pressure at the invert plus an allowable variation in face pressure.
However, where the overburden is limited, face pressures plus the variation in face pressure can exceed the overburden. Hence the importance and contribution of the ground treatment, as it is essential to isolate these pore pressures away from the tunnelling face and provide undrained shear strength.
Maximum face pressure
The maximum face pressure is required to limit potential blowout/heave.
The maximum face pressure in this particular case for low cohesive materials at the tunnel crown and face in combination with the low cover gives the most onerous design case.
Given that most areas were treated by grouting the RTD layer and some with some extra support by soil mixing of the alluvium, the danger of untreated pockets of ground still existed. Therefore there was still potential to have untreated material at the crown/face that could have resulted in face loss and settlement at the surface and potentially a sinkhole.
As there is no traditional (limit equilibrium) method to evaluate such a complex distribution of forces acting on different types and layers of materials at a low cover (<1D), the ultimate face pressure that the ground could sustain was determined by numerical analysis modelling. The software used for this analysis was PLAXIS 3D. The danger of the treated RTD suddenly changing to Alluvium on the face was considered to be the worst possible scenario for the model.
The analysis comprised 6 excavation steps each 1.6 m long (ring length) representing the effect of continuous tunnelling. Jacking forces of 635.5 kPa and grouting pressures of 100 kPa (at crown) were assumed. Groundwater conditions were modelled with head of 3.3 m above the tunnel crown.
In order to investigate the effects and their limit, the analysis was run for different face pressures applied at the tunnel crown (50-200 kPa). The results for each face pressure were plotted against vertical displacement at the surface (Figure 18).
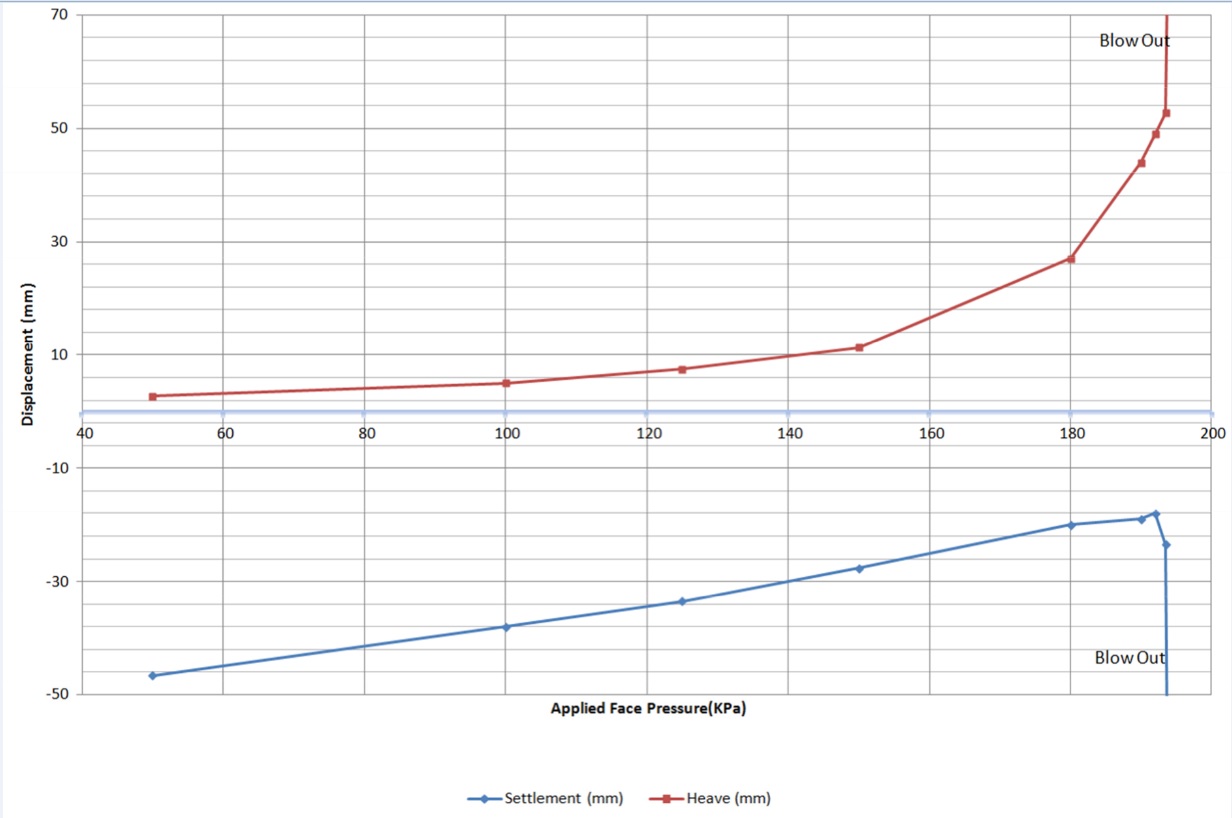
Figure 18 – Resulting heave and settlement due to tunnelling at different face pressures. The results showed that the optimum face pressure was 100 kPa. With a face pressure variation of 50 kPa, the deformations are limited. Excessive deformation occurred with face pressures in excess of 180 kPa”.
Ground movement and asset protection
Instrumentation and monitoring
For asset mitigation, Instrumentation and Monitoring (I&M) also played a part in addition to the physical measures described above. The purpose of which were as follows:
- Design verification
- Provide assurance to Stakeholders
- Adapt work sequence/parameters to mitigate impact
Due to the nature of the works, lessons learnt from Pudding Mill Lane and the trials undertaken, it was identified that the original design was not adequate or sufficient. Movements from the ground treatment works were very quick and localised despite the relatively low pressures used. At the start of the ground treatment phase only levelling points were installed. The only way to effectively monitor these was to monitor them at a high frequency (3 points per TaM as often as possible). This required a dedicated survey team and also on site processing and review of data and updating of the deflection ratio calculation to measure against the trigger values. Therefore it was agreed that a line of automatic electrolevels was the best solution.
Site monitoring using levelling points was extended from the original design to create a perimeter around the site and therefore the ground treatment area. This was to ensure any movement was detected as installing points in the treatment area would have been very difficult to maintain.
The first section that was installed was between the DLR tracks and micropile barrier location on the south side of the site. This enabled monitoring of any movement as a result of this activity but also served as verification that the barrier worked as a cut off for movement.
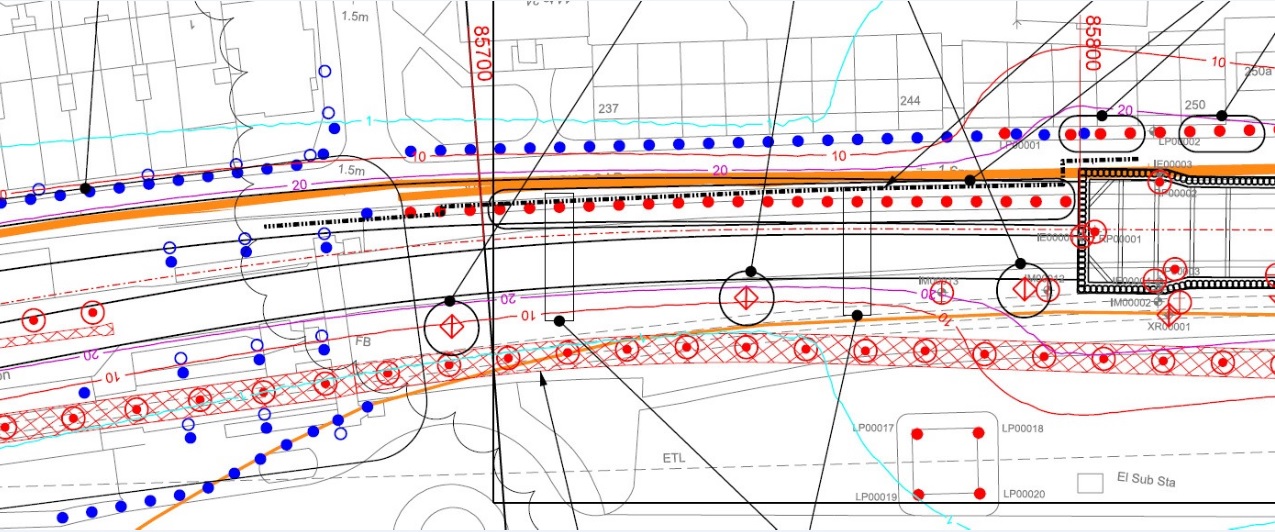
Figure 19 – I&M design drawing Asset protection
- DLR Tracks
- Automatic prisms installed on rails
- Manual track levelling
- Manual levelling of studs between micropile barrier and DLR tracks
- DLR Station
- Automatic prisms on station structure
- Manual prism readings on station structure
- Tiltmeters on lift shafts
- Sockets/LP’s on station structure immediately adjacent
- Utilities Victoria Dock Road
- Levelling points on north side of Victoria Dock Road
- Levelling points on south side of Victoria Dock Road
- Electrolevel beams along south side of Victoria Dock Road
The main focus of the I&M during the crucial phase of the work was to have 24/7 review and report of the automated data for both the automatic system on the DLR tracks and the electrolevel line. Measures were put in place for quick response should triggers be breached.
This was especially important for the EB passage and the data from the electrolevel line. The start of the line, needed manual readings taken during the zone of influence every 2-3 hours to ensure the entire line was showing accurate readings.
Volume loss
To calculate volume loss 3 small transects were installed in the ground treatment zone:
- Transect 2E – 120m away from the portal close to the DLR station
- Transect 2F – Approx. 60m away from the portal
- Transect 2G – 20m from the portal close to the anti-floatation slab
Volume Loss Summary
Transect 2E 2F 2G WB (%) -0.04 -0.15 -0.16 EB (%) 0.08 -0.03 -0.48 Distance to portal (m) 120 60 20 Ground Treatment zone B B/A A/Soil Mixing Table 1 – Volume loss summary for ground treatment area
Notes:
- Volume loss is calculated as prescribed in the Specification for the Control of Ground
- Where only 5-6no. of points were installed over the tunnel alignment, theoretical zero points either side of the respective tunnel centreline was taken as the depth to invert at the transect
- Negative values are volume
Conclusions
A series of ground improvement measures were undertaken nearby Victoria Dock Portal to limit settlement and volume loss due to the excavation of the Drive G tunnels.
To demonstrate the effectiveness of the design and assess the magnitude of settlement and volume loss accounting for all the protective measures installed, a FLAC3D numerical model that analysed several failure scenarios was created. This numerical model provided a quantitative measure of the volume loss range and the protection offered by the inclined steel TaM barrier and micropile cut off-wall, which is not viable to obtain either from empirical methods or from 2D models.
In addition to that, the results showed that for shallow tunnels the volume loss is not a reliable parameter to measure damage to third parties. On the contrary, it is more adequate to establish detailed trigger levels for each specific asset for both settlement and longitudinal distortions.
A comparison between the results obtained from the numerical models and the insitu monitoring systems allowed us to establish that the ground treatment measures were correctly implemented, that the TBM were successfully operated and the small amount of heave experience is likely due to a slight excess of face pressure, bentonite injection or bi- component injection. In shallow cover, a small pressure increase could be rapidly translated into heave on surface.
In summary, Drive G tunnels were completed with fantastic results in terms of safety (Target Zero achievement), quality (Right First Time), ground movement, asset protection, on programme and within budget. Each one of the factors has been instrumental in attaining this significant milestone.
References
[1] Dragados-Sisk JV and Geocisa UK (2013). Ground Treatment Design Report. Zone D (C305-DSJ-C2-RGN-CR144_PT003-50007 Rev 2.0).
[2] Dragados-Sisk JV and Geocisa UK (2014). Ground Treatment Design Report. Zone C (C305-DSJ-C2-RGN-CR144_PT003-50006 Rev 3.0).
[3] Dragados-Sisk JV and Geocisa UK (2014). Ground Treatment Design Report. Zone B (C305-DSJ-C2-RGN-CR144_PT003-50005 Rev 4.0).
[4] Dragados-Sisk JV and Geocisa UK (2014). Ground Treatment Design Report. Zone A (C305-DSJ-C2-RGN-CR144_PT003-50004 Rev 3.0).
[5] Dragados-Sisk JV and Intecsa-Inarsa (2014). Victoria Dock Portal Volume Loss and Ground Loss Analysis FLAC3D numerical model (C305-DSJ-C2-RGN- CR144_PT003-50018).
[6] Dragados-Sisk JV and Geocisa UK (2014). Validation Report Zone C (C305-DSJ-C2-RGN-CR144_PT003-50021 Rev 1.0).
[7] Dragados-Sisk JV and Geocisa UK (2014). Validation Report Zone B (C305-DSJ-C2-RGN-CR144_PT003-50017 Rev 4.0).
[8] Dragados-Sisk JV and Geocisa UK (2014). Validation Report Zone A (C305-DSJ-C2-RGN-CR144_PT003-50016 Rev 2.0).
[9] Dragados-Sisk JV and Geocisa UK (2014). Validation Report Soil Mixing Zone A (C305-DSJ-C2-RGN-CR144_PT003-50020 Rev 3.0).
[10] Dragados-Sisk JV and OTB Engineering (2014). Drive G Limmo to Victoria Dock Portal TBM Operational Parameters (C305-DSJ-N2-RGN-CR144_WS155-50123 Rev2.0).
-
Authors

