Noise and Vibration Controls for the TBM and Temporary Construction Railway
Document
type: Case Study
Author:
Andrew Bird BSc (Hons) MIOA, Colin Cobbing BSc(Hons), CEnvH, MCIEH, MIOA, Pranav Bhalla, Dave Clark, Bruno Guillaume, Tom Howden, Graham Parry, Richard Sullivan, Steve Summers BSc, MSc, CEng, MIOA
Publication
Date: 18/10/2016
-
Read the full document
Introduction
This case study considers ground-borne noise and vibration (GBN&V) from tunnel boring machines (TBMs) and from the construction trains that were used to deliver materials to and from the TBMs. The requirements for GBN&V are described. This is followed by a section that presents the results of noise and vibration monitoring carried out for the TBMs. It then goes on to describe the train and track specifications used for the construction railway and present the results of noise and vibration monitoring. Complaints arising from the passage of TBMs and construction trains are reported.
Background
Crossrail is Europe’s biggest underground construction project to date. The project is building a new east-west railway for London and the South East. The route will link existing railways from Reading and Heathrow in the west, and Shenfield and Abbey Wood in the east.
The surface railways are linked via 42 kilometres of new railway tunnels and a further 14 kilometres of station and interchange tunnels.
Eight 1,000 tonne tunnel boring machines (TBMs) bored the 42km of 6.2m diameter rail tunnels under London. The machines were operated by “tunnel gangs” of 20 people, working in shifts around the clock to construct the tunnels, carving out around 3.4 million tonnes of earth over 3 years between 2012 and 2015.
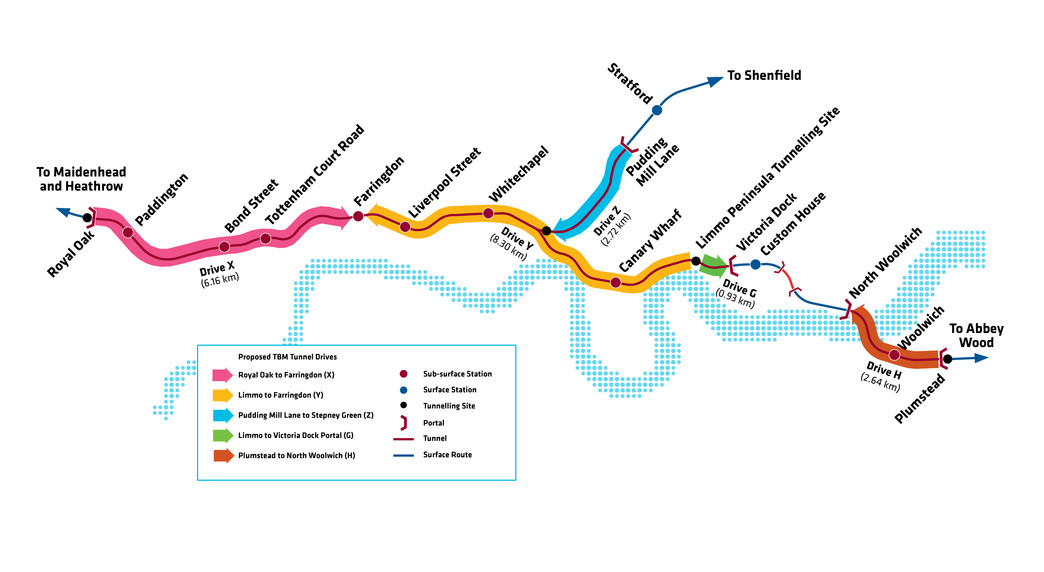
The tunnels weave between existing underground lines, sewers, utility tunnels and building foundations from station to station at depths of up to 42m. The pair of tunnels, one each for eastbound and westbound services, stretch from a portal at Royal Oak in west London, under the West End and the City of London linking up Crossrail’s central stations, before splitting into two routes in east London. In the north east the tunnels continue to a portal at Pudding Mill Lane. In the south east the tunnels run to Victoria Dock portal and then under the Thames to Woolwich.
Figure 1 illustrates the Crossrail tunnelling drives.
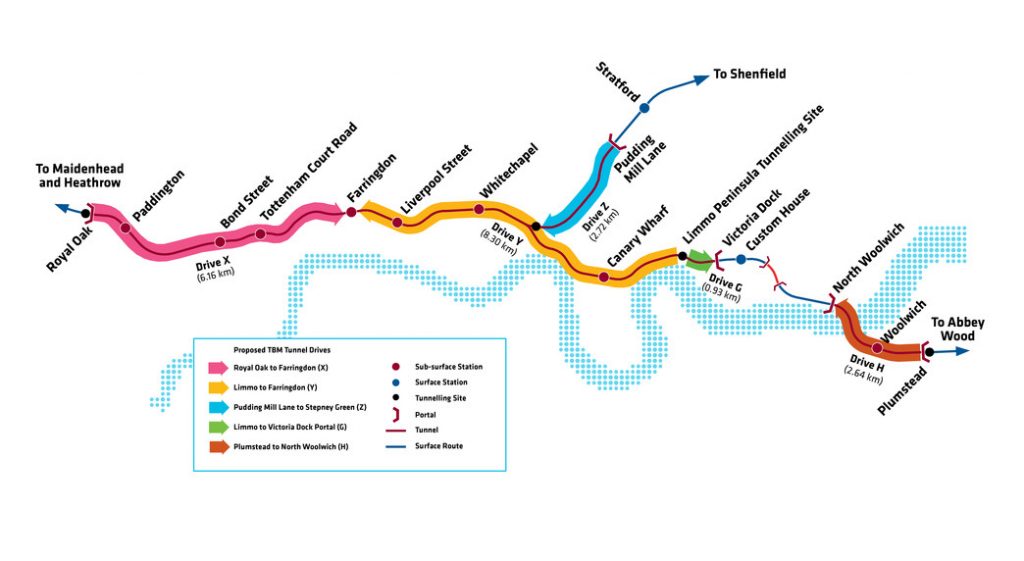
Figure 1 – Crossrail Tunnelling Drives
Figure 2 below shows inside a completed tunnel and visible tunnel segments. Over 200,000 concrete segments were required to line the running tunnels. Seven segments and a keystone were used to make up every tunnel ring, locked together to build a concrete tube reinforced with steel fibres, built to last for hundreds of years.
Each segment weighs 3 tonnes and each keystone weighs 1 tonne.
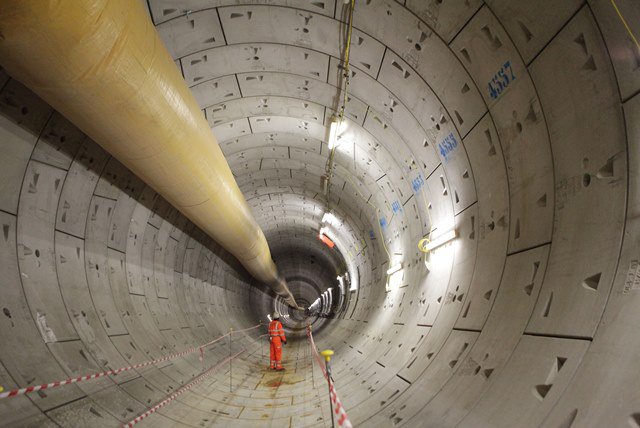
Figure 2 – Crossrail Tunnel
Route Conditions
The 42km of bored tunnels are located below some of central London’s most sensitive buildings, such as recording studios, theatres, auditoria, hospitals and schools.
Ground conditions include river terrace deposits, London clay, Lambeth group, Thanet sand and chalk, along with various obstructions such as piles, tunnels softeyes and diaphragm walls (D.walls). A section through the ground conditions is shown in Figure 3 below.
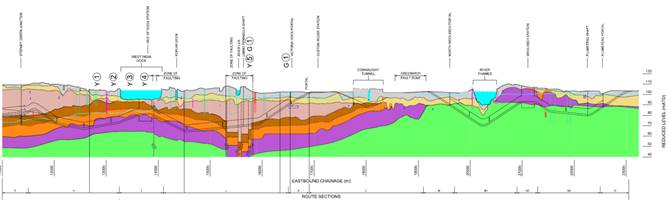
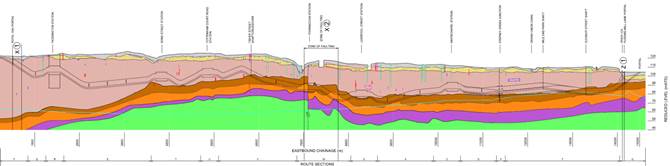
Figure 3 – Section of Ground Conditions along the Crossrail route
Commitments for Ground-borne Noise and Vibration
Crossrail Act 2008
The Crossrail Bill was first introduced in Parliament in February 2005 for consideration by the House of Commons and the House of Lords. The Bill was enacted on 22nd July 2008 after it completed all the Parliamentary stages and received Royal Assent to become the Crossrail Act (2008).
The Crossrail Act provides the powers to build the railway but the powers are conditional upon meeting the Environmental Minimum Requirements (EMRs). The key document containing the parliamentary assurances relating to groundborne noise and vibration (GBN&V) from the construction railway is the Crossrail Information Paper D10 Groundborne Noise and Vibration[1].
The relevant paragraph in IP D10 (2.7) and the EMR (Annexe 1 – Construction Code, Clause 5.3.8) includes the following noise requirements:
“endeavour to ensure that the groundborne noise from the operation of the temporary construction railway that is experienced by any theatre, large auditorium/concert hall, studio, place of meeting for religious worship, court, lecture theatre or small auditorium/hall, does not exceed the levels to which it is already subject by the presence of London Underground, other railway and road transport operations, or the levels listed in Table 1, whichever is the higher noise level, during the periods for which the buildings are in use.”
The numerical design criteria referred to are reproduced in Table 1 below.
Building Level/Measure Residential buildings, Offices1, Hotels1, Schools, Colleges, Hospitals, Laboratories, Libraries 40dB LAmax,S Theatres 25dB LAmax,S Large Auditoria/Concert Halls 25dB LAmax,S Sound recording studios 30dB LAmax,S Courts, Lecture theatres, Places of meeting for religious worship2, Small Auditoria/halls 35dB LAmax,S Notes: 1. Significance criteria not included in the Scope and Methodology set out in Appendix A2, Vol. 5 of the Crossrail Environmental Statement, added here for clarification.
2. Meaning a place the principal use of which is for people to come together as a congregation to worship God or do reverence to a deity.
Table 1 – Operational groundborne noise criteria (reproduced from Information Paper D10)
For completeness, the vibration criteria have been included. These are daytime vibration dose values (VDV) (07:00 – 23:00 hours) <=0.31 ms-1.75, night-time (23:00 – 07:00) <=0.18 ms-1.75, and (where there are appreciable levels of existing vibration), an increase in VDV of 40%.
The key paragraph in the EMRs (Clause 5.3.8 of the Construction Code – Annex 1 to the EMRs) included the following project requirements:
Temporary Construction Railway
(a) The alignment, jointing and mounting of the temporary construction railway will be installed, maintained and operated in a manner so as to minimise the transmission of vibration and groundborne noise from the passage of rail vehicles.
(b) All diesel locomotives will be fitted with efficient exhaust silencers. [2]
Although noise and vibration commitments were made for the temporary construction railway as described above, none were made for the passage of the TBMs. The reasons for this are twofold:
- At a typical progress rate of 100m a week, the duration of the passage of a TBM past any one sensitive receptor is relatively short such that its impact is not considered to be significant;
- There is little that can be practically done to control GBN&V from TBMs because of safety and settlement reasons.
Groundborne Noise & Vibration from the Tunnel Boring Machines
Eight TBMs were used to build the new rail tunnels: six Earth Pressure Balance Machines (EPB) and two Slurry Machines to cater for differing ground conditions. The slurry machines differ from EPB machines in three major ways: they have a sealed, pressurised, air-locked chamber behind the cutter head; they have inlet pipes; and use an outlet pipe rather than a conveyor system to remove the earth.
The TBMs were 148 m long with a total weight of 980 tonnes. The cutters heads had a rotation speed of up to 3.2 rotations per minute and applied a nominal thrust force of approximately 58,000 kN (the equivalent force needed to lift 2,900 London taxis).
TBM GBN&V is sensitive to various parameters, including the distance to the cutting face, geology at the cutting face, geology along the transmission path, TBM type, thrusting pressure, rotational speed, cutter disc arrangement, etc.
There are two major dynamic excitation sources inside the TBM – the cutter force and the supporting forces. The cutter force is the dynamic impulsive forces acting on the excavation face by the cutter discs. The supporting force is acted by the hydraulic cylinders on a supporting structure, in order to provide the thrusting pressure to push the TBM forward. The supporting structure depends on the TBM types. For both Crossrail TBM types, this support is provided by the completed rings embedded behind the TBM as it advances.
Both of these forces occur when the TBM is advancing forward (referred to as the ‘shove’ phase), however during the overall build cycle, once the TBM has advanced forward one ring width, approximately 1.6 metres, the jacks stop pushing and the cutting head stops rotating. At this point (referred to as the ‘build’ cycle), pre-cast concrete tunnel segments are inserted and bolted together within the rear section of the TBM shield while the TBM is stationary. Once in place, the hydraulic cylinders engage the newly constructed ring and the TBM recommences tunnelling forward and the cycle is repeated.
TBM GBN&V Measurements
Anderson Acoustics Ltd undertook noise and vibration measurements from the TBMs as soon as they started to bore under occupied buildings. The purpose was to record the levels and understand whether adverse impacts from noise and vibration were likely to arise and to obtain information that could be used to inform residents of noise and vibration levels that might be expected during the passage of the TBMs. Noise and vibration from the TBMs was measured at three locations to the south of the new Paddington station, namely:
- Basement Vaults on Spring Street;
- Basement Garage on Sussex Gardens; and
- Sussex Square gardens (external).
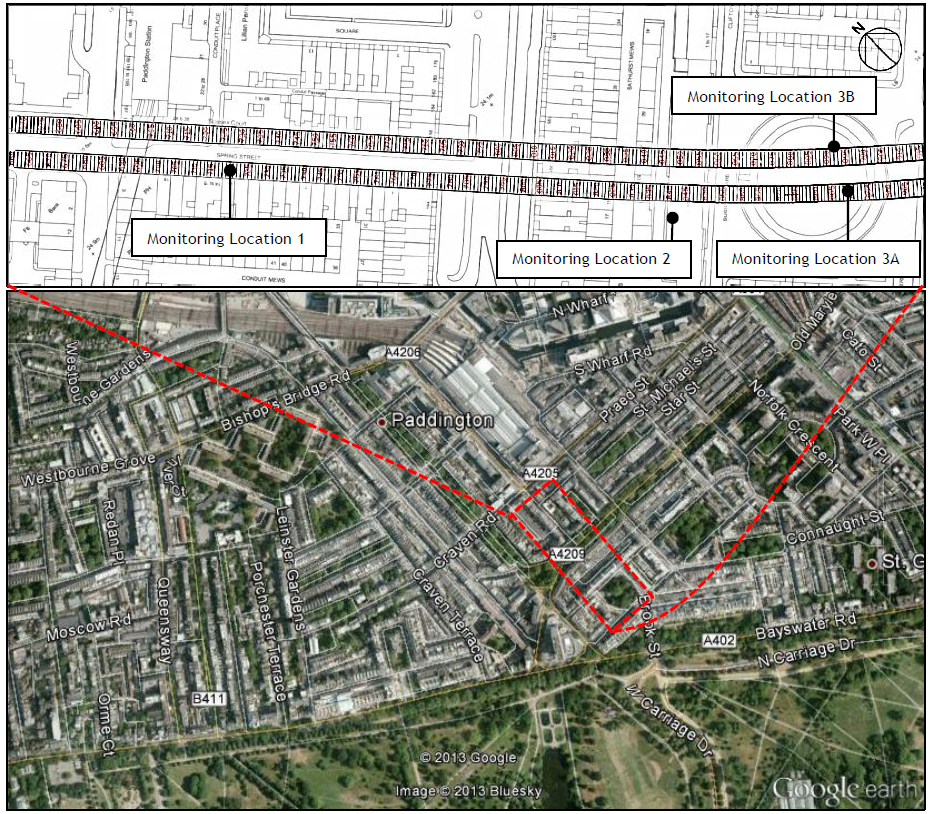
Figure 4 – TBM measurement locations
These measurement locations were directly over the tunnel alignment and at a relatively shallow tunnel depth. The following Figures 5-10 provide an image of each measurement location along with details of the TBM activity relative to the measurement position.
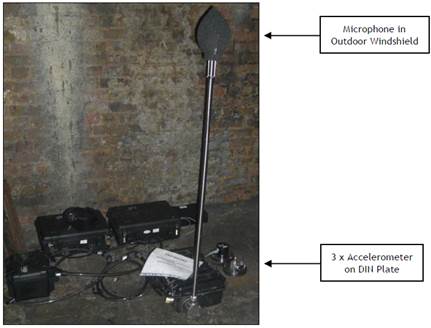
Figure 5 – Location 1 – Basement vaults of 13 Spring Street
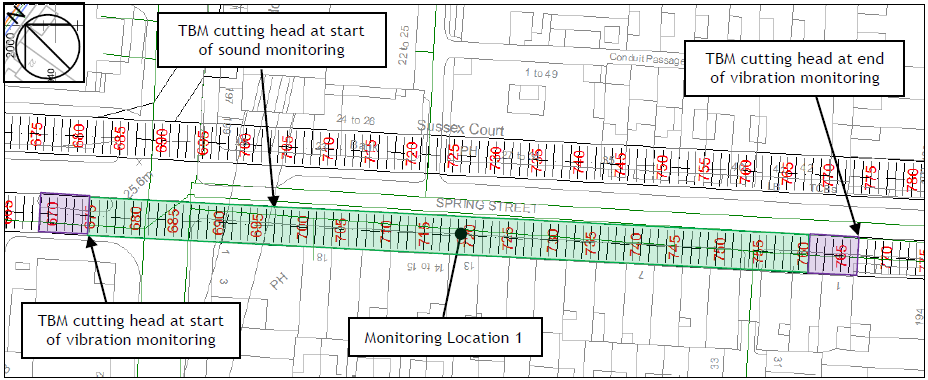
Figure 6 – Location 1 – TBM activity relative to measurement position
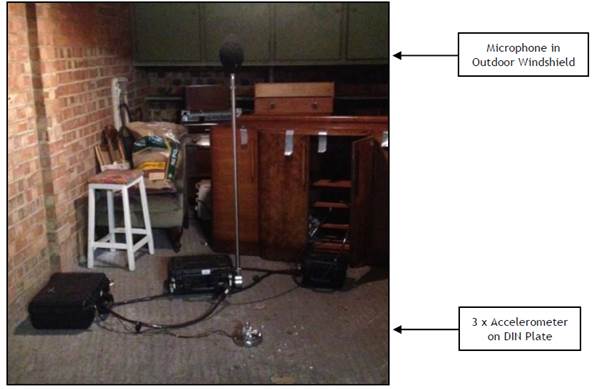 Figure 7 – Location 2 – Basement Garage on Sussex Gardens
Figure 8 – Location 2 – TBM activity relative to measurement position
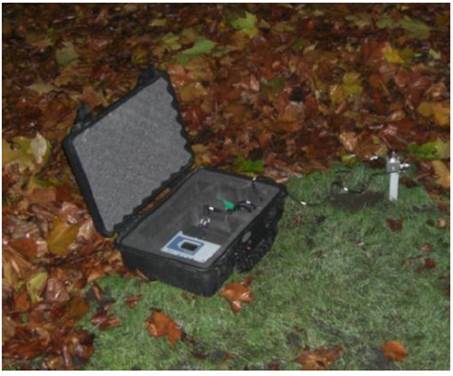
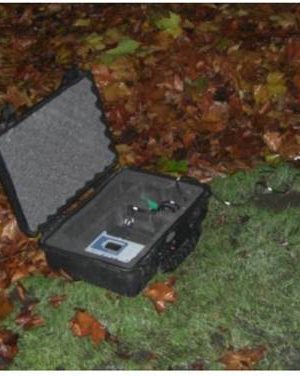
Figure 9 – Location 3A Monitoring Equipment Setup
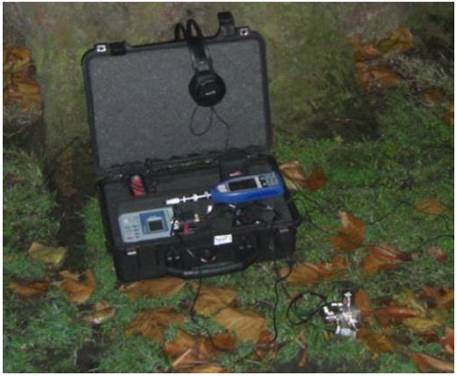
Figure 10 – Location 3B Monitoring Equipment Setup
TBM Monitoring results
In this report vibration velocity is provided in decibels (dB) using a reference vibration velocity of 1×10⁻⁶ mm/s. As standard, re-radiated noise is provided in dB using a reference sound pressure level of 2×10⁻⁵ Pascals.
Vibration velocity levels were measured at all three monitoring locations as the TBM passed by.
Generally the highest vibration velocity levels were measured when the TBM cutting head was directly below the monitoring locations, except at location 2 as detailed below. The highest vibration velocity levels measured were as follows:
- Location 1 = 60 dB(A) with TBM at approx. depth of 14 m below measurement position.
- Location 2 = 71 dB(A) for Cutting Head at approx. depth of 19 m, 80 dB(A) for Tail End of Main Shield at approx. depth of 20 m
- Location 3A = 50 dB(A) with TBM at approx. depth of 25 m below measurement position.
- Location 3B = 46 dB(A) with TBM at approx. depth of 25 m (+ 20 m perpendicular) below measurement position.
Subjective vibration was not perceived by the noise and vibration specialists undertaking the monitoring during numerous visits to the measurement locations whilst the TBMs were operational below. This is to be expected given that the measured vibration levels were well below guidance levels for the onset of perceptible levels of vibration.
Re-radiated noise was only audible during the TBM shove events and was not perceived or measured during other phases of the overall tunnelling cycle, such as during the ring build stage. Although the noise was audible for short periods of time, it was not clearly audible or intrusive. Re-radiated noise of TBM shove events was audible at monitoring locations 1 and 2, during periods of low background noise. At location 2 this was generally at night as it required lower background noise than at location 1, due to the increased depth of the tunnel.
Generally the highest noise levels were measured when the TBM main shield was directly below the monitoring locations. The highest noise levels measured were as follows in terms of A-weighted equivalent continuous sound pressure level (LpAeq, t):
- Location 1 = 40 dB(A) with TBM at approx. depth of 14 m below measurement position.
- Location 2 = 35 dB(A) with TBM at approx. depth of 20 m below measurement position.
The results of the TBM pass-by at Location 1 are presented graphically in Figures 11 and 12 below, with ring 719 being directly below the measurement location.
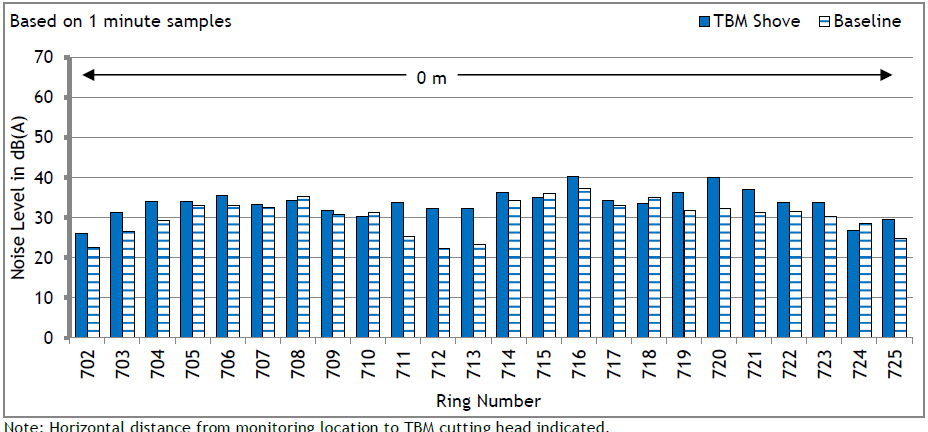
Figure 11 – Location 1 – Noise results for TBM pass-by
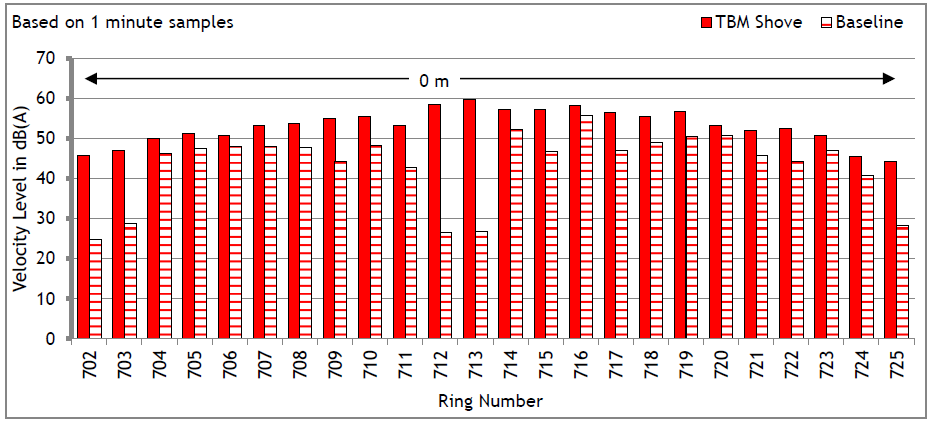
Figure 12 – Location 1 – Vibration velocity results for TBM pass-by
The frequency content of the re-radiated noise measured at locations 1 and 2, as well as subjective observations taken whilst in attendance on site at location 1, suggested that the reradiated noise was not caused by the interaction between the TBM cutting head rotating against the ground/soil.
The re-radiated noise appeared to be tonal as the frequency content was largely dominated by the 400 Hz 1/3 octave band. This was also perceived on site and would suggest that the re-radiated noise was excited by the 12 drive motors which are understood to rotate at approximately 3000 RPM to drive the TBM cutting head. These motors are located behind the head within the main shield. This observation was reinforced by the measurement of the highest noise levels when the main shield of the TBM was directly below the monitoring location.
In summary, the findings indicated that the TBM shove events may be audible as reradiated noise. Where such events were audible, this will be mainly due to the tonal characteristics, as the measured overall A-weighted noise levels are comparable to guideline internal noise levels recommended by WHO and in BS8233. During those periods when TBM noise was audible, the re-radiated noise was perceived as very low levels for up to 1 day, and only during the shove phase of the TBM shove-build cycle. Vibration due to TBM operations was not perceptible in occupied rooms near to the tunnel alignment.
Complaints regarding TBMs
Crossrail required the tunnelling contractors to distribute information sheets warning of the passage of the TBM around 2 weeks in advance and separately for other key items of tunnelling work such as ‘breakthroughs’ when the TBMs arrived at the stations and broke through the diaphragm walls. Therefore surrounding stakeholders along the entirety of the route had been forewarned of the approaching TBM and likelihood of audible noise.
Very few noise and vibration complaints were received for normal TBM tunnelling operations. There were a total of three, one relating to noise and vibration and two to vibration only. The properties of all three complainants were in the same area, located directly above the route, and were successfully addressed by the contractor’s community relations representative calling to explain that the TBM was in the area and would be gone within a couple of days.
Such a low number of complaints is likely to be a result of one or all of the following factors:
- The soil types (predominantly clay and sands) encountered on the Crossrail route were relatively benign in terms of the level of GBN&V generated on the surface
- Providing advanced notification may have reassured anyone who did hear the TBM as to the source of the noise
- The transient nature of the work avoided prolonged exposure to GBN&V
Noise and vibration complaints were also received as a result of the TBM passing through the diaphragm walls at Bond Street Station and Tottenham Court Road Station and at Farringdon when the TBMs broke into the station adits, these were isolated activities of relatively short duration.
The low number of noise and vibration complaints from normal tunnel boring activities should reassure those living above future tunnelling projects that adverse noise impacts from the TBMs are unlikely in these ground types at these tunnel depths.
Construction Railway
The TBMs are serviced by small mining trains running on a narrow gauge railway (900mm), which are used to supply all temporary and permanent materials including the tunnel segments.
Arup-Atkins JV developed the reference design that was provided to the tunnelling contractors. It comprised of three different track types. The track types are shown in Figures 13 to 15 below and are briefly described as follows;
- Track Type A: Rail and rail pad fixed directly to a steel sleeper, which itself was bolted directly to the base of the tunnel (this was designed to give a 5dB improvement by comparison to the HS1 track (previously known as the Channel Tunnel Rail Link), mainly as a result of better joint quality;
- Track Type B: As for Track Type A but with the inclusion of a resilient baseplate such as a Pandrol Vanguard baseplate; and
- Track Type C: Rail and rail pad on concrete sleepers and ballast laid on a resilient ballast mat
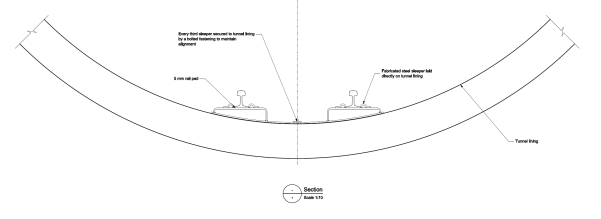
Figure 13 – Reference Design Track Type A
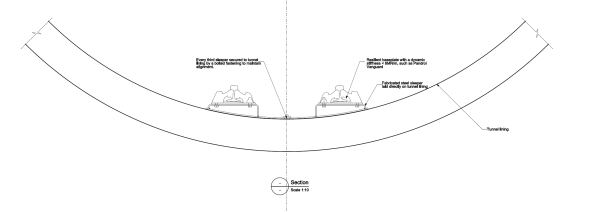
Figure 14 – Reference Design Track Type B
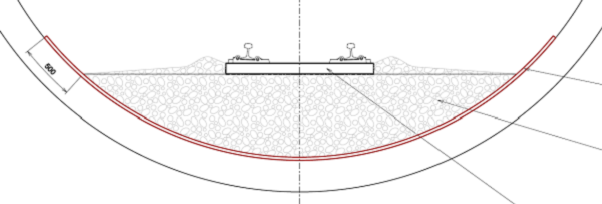
Figure 15 – Reference Design Track Type C
Track Type C reflected specifications that were agreed during the Parliamentary stages of promoting the Crossrail Bill to protect the Barbican Concert Hall and particular recording studios in the Soho area.
A model for predicting GBN&V from the construction railway was used to establish the type of track system required at each location along the lengths of the tunnels. Arup’s proven GBN&V prediction model was taken as the starting point. The model adopts the GBN&V calculation procedures developed for High Speed 1 (HS1) in the UK [3] which have since been developed and further validated on a wide range of railways worldwide.
During construction of HS1, construction trains gave rise to GBN&V levels of up to 44dB LpAmax,S inside residential buildings. A limited set of measurements of HS1 construction trains was carried out when construction trains were running at depths between 17-32m. These measurements were used to define the source terms that were used for the model. At that time, little attention was given to the installation of the track, which often exhibited: low quality rail with low quality joints; no maintenance programme; and no vibration isolation. Consequently, the model was used to define further corrections to the source term in order to account for the different reference track designs.
In total, the reference design incorporated 38km of Track Type A; 7km of track Type B and 1.6 km of Tack Type C. The reference design was further developed by the main tunnelling contractors for the west (C300) and the east (C305) contracts. The following sections describe the final track designs that were installed.
Final track designs
New sections of rail with good quality bolted joints, to minimise vertical displacement, were used. C300 used 45 degree mitred joints and C305 used traditional butt ended joints. All joints were installed within specified tolerances and in accordance with stated quality control regimes.
Both contractors considered that the ballast on ballast mat option (reference design Type C) was not practical, mainly because it would have been necessary to stop the TBMs in order to retrofit the track with associated risks of settlement. The import and export of high volumes of ballast was also a problem. Alternative designs were therefore developed to meet the performance requirements but which could be laid as the TBMs progressed without the need for subsequent retrofitting of replacement track.
C300 track design
The designs utilise a hard plastic pad bolted to the tunnel lining in order to support the sleeper. The plastic support is a VoestAlpine Voestclick and is presented in Figure 16.
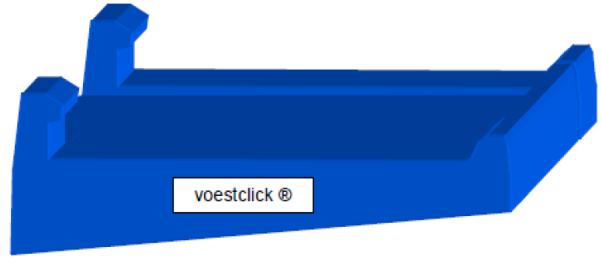
Figure 16 – VoestAlpine Voestclick plastic pad
The first track type (Type A) utilises only the Voestclick pad to support the sleeper. The rail is bolted directly to the sleeper which in turn is bolted directly to the tunnel lining via the Voestclick pad in blue as shown in Figure 17.
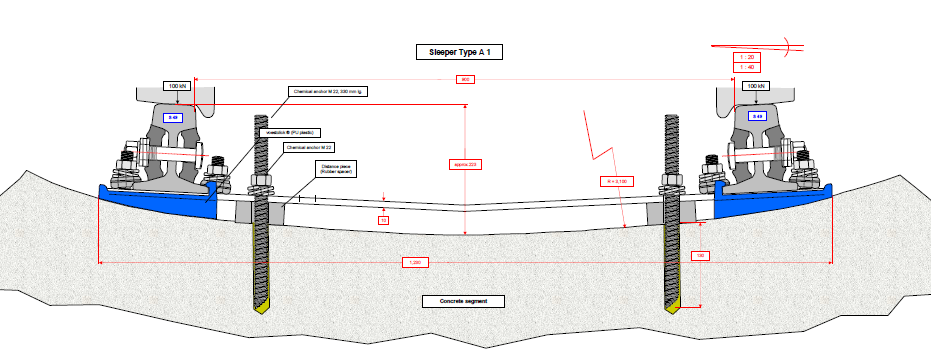
Figure 17 – C300 Track Type A
The second design (Type B) utilises a similar configuration to that of above with the inclusion of a Getzner resilient pad. A schematic of this design is shown in Figure 18 below (Getzner resilient pad shown in pink). C300 originally had two resilient track designs, Type B and Type C. The only difference between the two types was the pad thickness: 12.5 mm for Type B and 25 mm for Type C. In practice, it was decided to use only Type C where resilient track was required, due to the minimal cost differential between the two types.
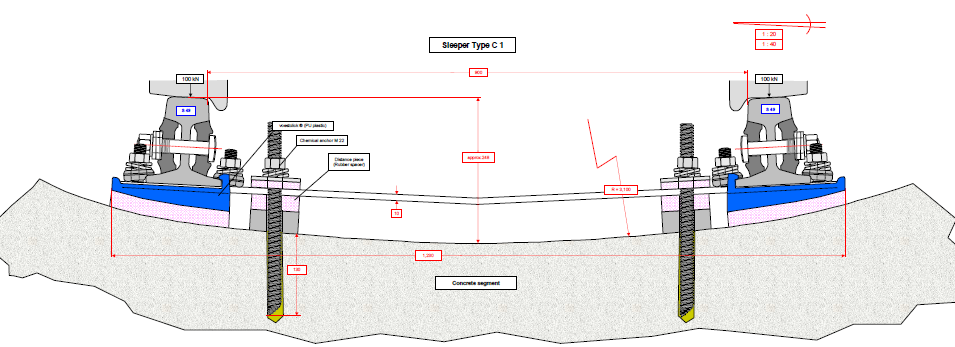
Figure 18 – C300 Track Type B
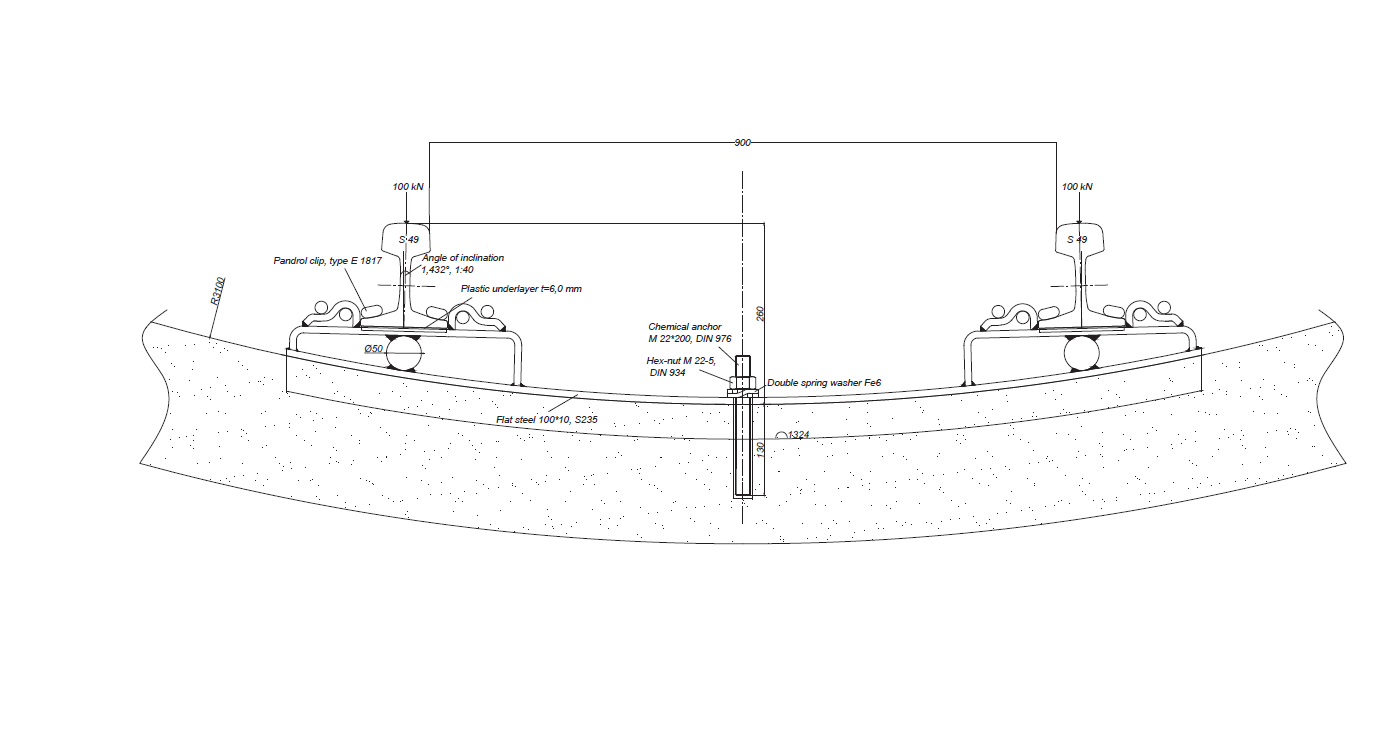
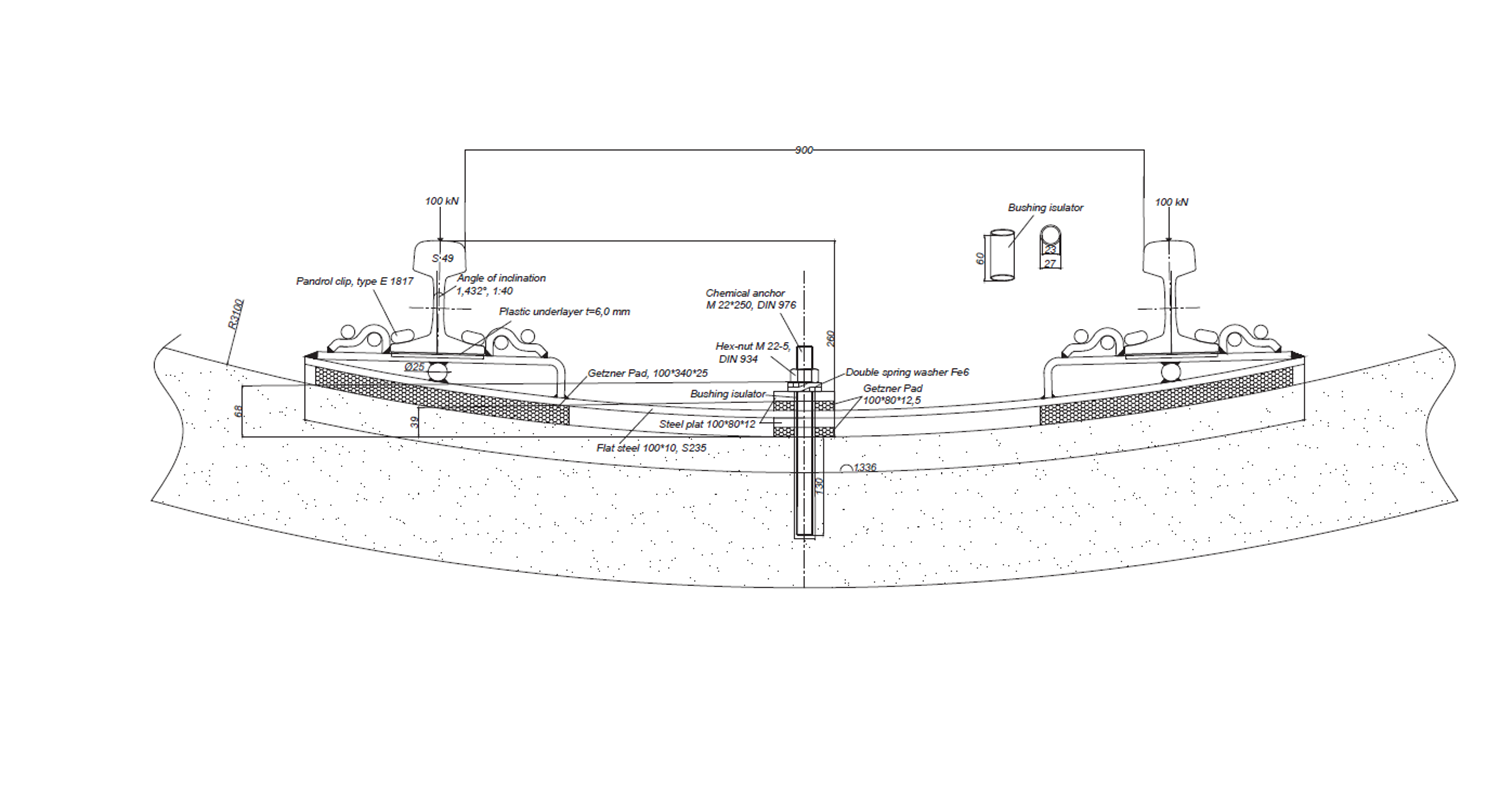
The C305 track system is similar to the C300 system in several respects. The C305 track type A (shown in Figure 19) comprises of a rail on rail pad supported on a steel sleeper. The C305 Track Type B (shown in Figure 20) is of similar design but incorporates a Getzner pad under the steel sleeper. Resilience is also incorporated into the restraining bolts by adding Getzner pads either side of the steel sleeper. The vertical profile of the steel sleeper is reduced so as to maintain the same rail height as the Track Type A.

Figure 19 – C305 Track Type A

Figure 20 – C305 Track Type B
Both systems have a key advantage in that they are both modular and interchangeable, allowing resilience to be added retrospectively should the need arise. Indeed, there were examples where non-resilient track was replaced with resilient track soon after complaints or adverse comments were received and this proved to be an effective means of mitigating complaints from the construction trains.
Construction trains
Both C300 and C305 used Schoma CHL 200G 40 tonne tunnel locomotives for the haulage of materials from and to the operating tunnel boring machines. The selection was based upon the haulage duty of the locomotives over the gradients and horizontal radii of the designed tunnels. Both C300 and C305 used new Mühlhäuser rolling stock.
Predictions
C300 was the first contractor to start tunnelling and so had little source data that could be used to predict ground-borne noise and vibration from the construction trains. This led them to adopt a model that enabled levels to be predicted using input parameters (parameters such as train specification, train speed, tunnel depth, ground conditions etc), based on the Pipe in Pipe model developed by Hunt & Hussein[4]. The PiP model determines the vertical displacement due to a moving train in an underground tunnel in a 2-dimensional space. A schematic of the principle of the Pipe in Pipe model is shown in Figure 21 below.
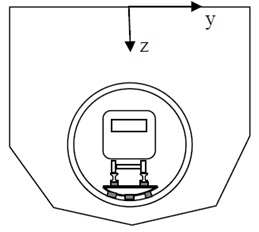
Figure 21 – Schematic of principle of PiP GBN&V model
As the name suggests, the PiP model utilises two coupled infinitely long concentric pipes to represent both the train tunnel and the surrounding soil area. The source excitation is determined from the rail profile e.g. rail in good condition, corrugated rail, etc, which is represented by the relative displacement between the train axle and the rail. The displacements arising due to the forces between the wheel-rail interfaces are determined by modelling the track system as a double beam system. The track is coupled to the tunnel-soil system by utilising the frequency response function of the double beam and tunnel-soil systems. The source displacement is then utilised in conjunction with Green’s function for a half space in order to allow the vertical displacement at the surface to be determined.
The PiP model was originally developed to determine the vertical displacement due to train movements on floating slab track which was not the design to be used for the temporary construction railway. Therefore the temporary construction railway was modelled by altering the mechanical input properties of the slab and slab bearing in order to mimic those of the actual track and track support designs adopted by C300.
C305 worked with C300 and Hussein to determine the most appropriate input parameters, but C305 also devised a simpler prediction method based on tunnel wall vibration measurements. C305 initially used published tunnel wall data for tube trains, but replaced these with actual measurements of their own at the earliest opportunity. The basic process was to:
- establish the level of vibration generated by the passing train in the tunnel walls;
- calculate the proportion of this energy which reaches the surface;
- determine the amount passing into each building; and finally
- predict the vibration and structure-borne noise within the building.
Ungar & Bender’s methodology[5] was used to predict the vibration at the surface (i.e. ground level) based on the actual vibration levels in the tunnel wall. According to Gutowski and Dym[6], the attenuation (Ad) of the wave as it passes through the surrounding soil (and rock) is due to geometric spreading and dissipation (material damping):

where η is the loss factor, c is the longitudinal (P) wave velocity and f is the frequency of the vibration component under consideration, and x is the distance from the source (i.e. tunnel wall) to the receiver. Corrections were then applied to take account of factors that would cause losses, such as the foundation coupling loss, and gains e.g. from piled foundations as well as using well known relationships to calculate noise levels inside rooms from predicted surface vibration levels.
Prediction validation exercises
All modelling processes are subject to inherent errors and uncertainty. This was especially true for C300 because they had very little existing data to check and validate their predictions. It was decided therefore to carry out a detailed model validation exercise in order to provide confidence in the model predictions. C300 carried out initial validation studies, soon after the start of tunnelling, near to the Royal Oak and Paddington stations in order to measure vibration levels from the construction railway. Two further surveys were carried out by Anderson Acoustics Ltd at Sussex Square, which is located to the south of the new Paddington station, in January 2013 and July 2013.
Monitoring was carried out on the tunnel wall at two locations and at 3 surface measurement locations in the gardens of Sussex Square as follows:
- Location 1 – On grass surface directly above westbound tunnel.
- Location 2 – On grass surface approx. 10m to the south-west of Location 1
- Location 3 – On grass surface approx. 20m to the north-east of Location 1
Figure 22 below provides a site monitoring location plan.
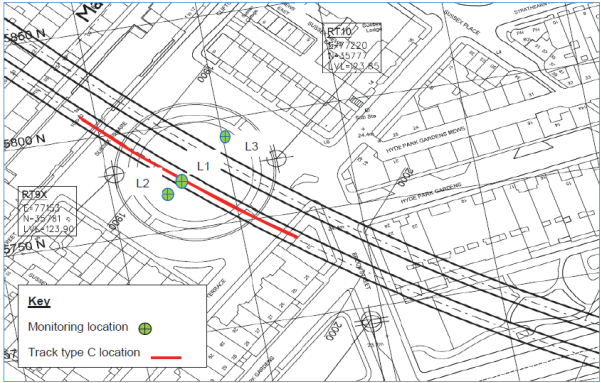
Figure 22 – Sussex Square gardens monitoring location plan
Train speed was also measured which allowed the measurements to be normalised for speed. Initially, train logs were used to obtain train speeds, but as these only provided an average speed between two points which did not account for the range of speeds that occurred on gradients, an improved speed measurement system was installed that used light beams at relevant sections, and train drivers were requested to run at a consistent speed between identified sections of track as best they could.
Data is presented for the in tunnel measurements for the non-resilient and resilient track types. Average vibration levels in the vertical Z-axis ( for trains loaded with tunnel segments and unloaded) is presented over a 1/3 octave spectrum from 10 Hz to 250 Hz. 26 events were logged for Track Type A and 24 events were logged for Track Type C.
Figure 23 below has been produced using the measured vibration signal from only construction trains passing with speeds of 15 km/hr ± 10% (i.e. 13.5 – 16.5 km/hr) in order to provide an equivalent comparison between the two track types.
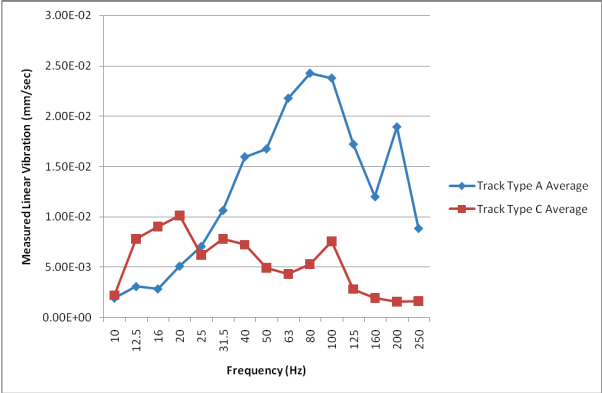
Figure 23 – Measured vibration within the tunnel with construction trains passing at 15 km/hr ± 10%
Figure 23 demonstrates that over a broadly similar speed range, there is a significant improvement in vibration isolation from Track Type C when compared to Track Type A above 40 Hz.
It can be seen in Figure 24 that the vibration levels, at low frequencies (12.5 to 63 Hz), have increased with distance from the tunnel which would be expected up to a certain distance because,
“for the ground surface above the tunnel, the tunnel structure forms a barrier preventing vibration of the invert from radiating upwards. The maximum along the surface therefore often occurs to the side of the tunnel alignment, typically by a distance of the same order as the tunnel depth”. [7]
L3 was offset by approximately 20m from the tunnel alignment and the tunnel is at a depth of approximately 25m.
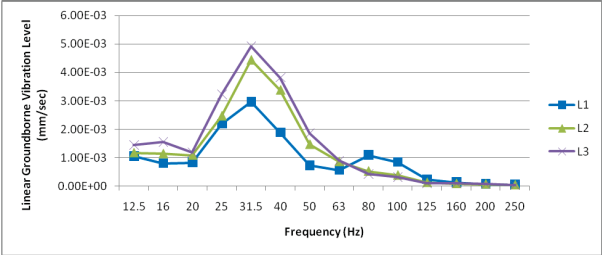
Figure 24 – Linear groundborne vibration level of Sussex Square gardens measurements
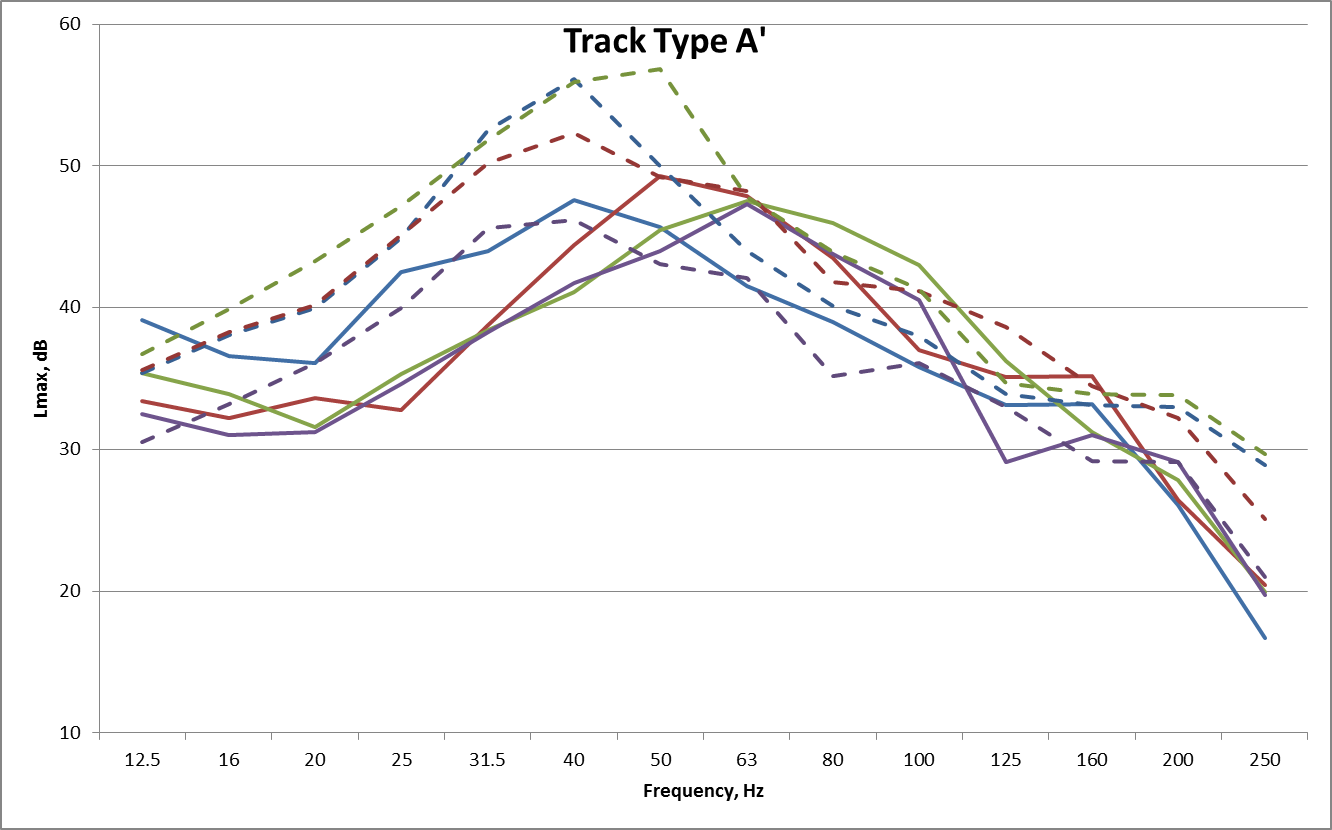
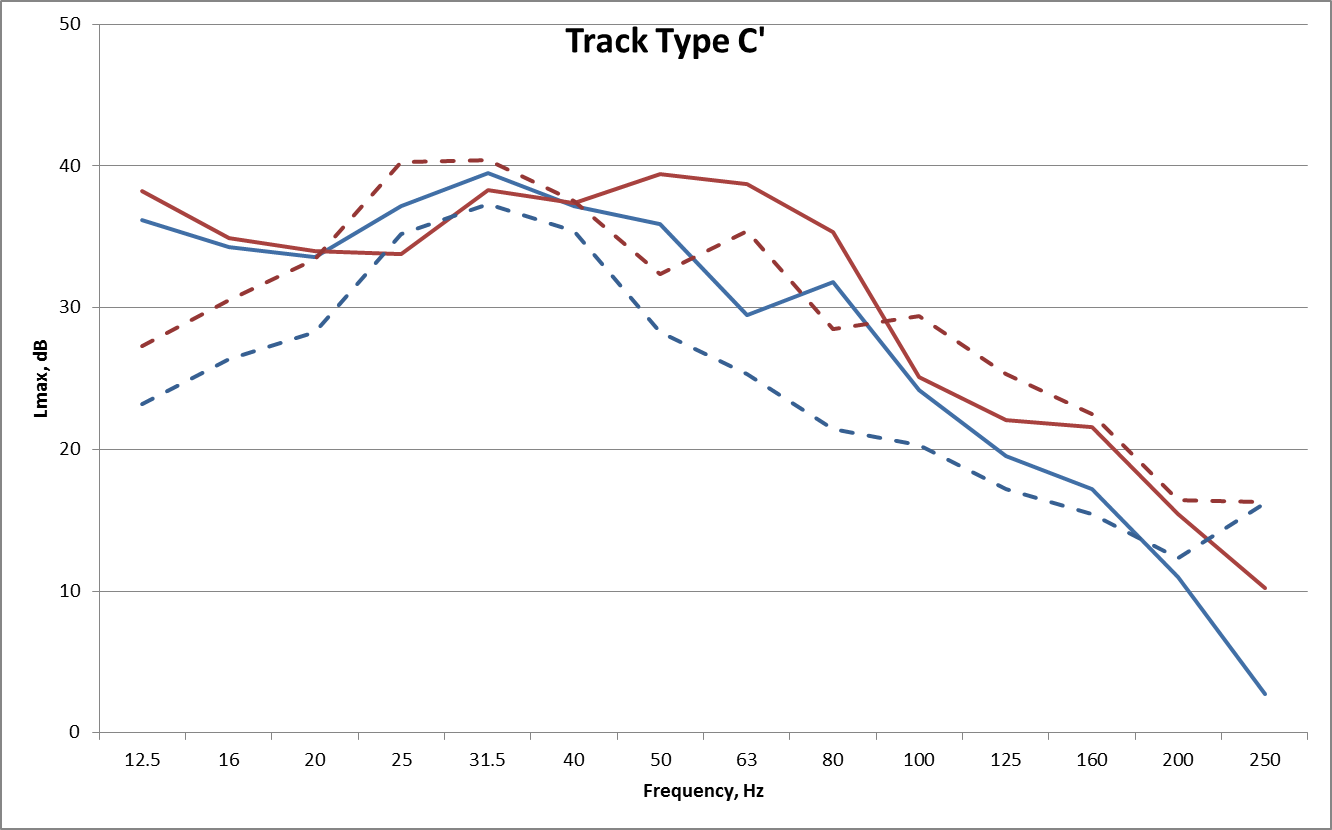
Figures 25 and 26 below present a comparison of measured and predicted levels for Track Types A and C.
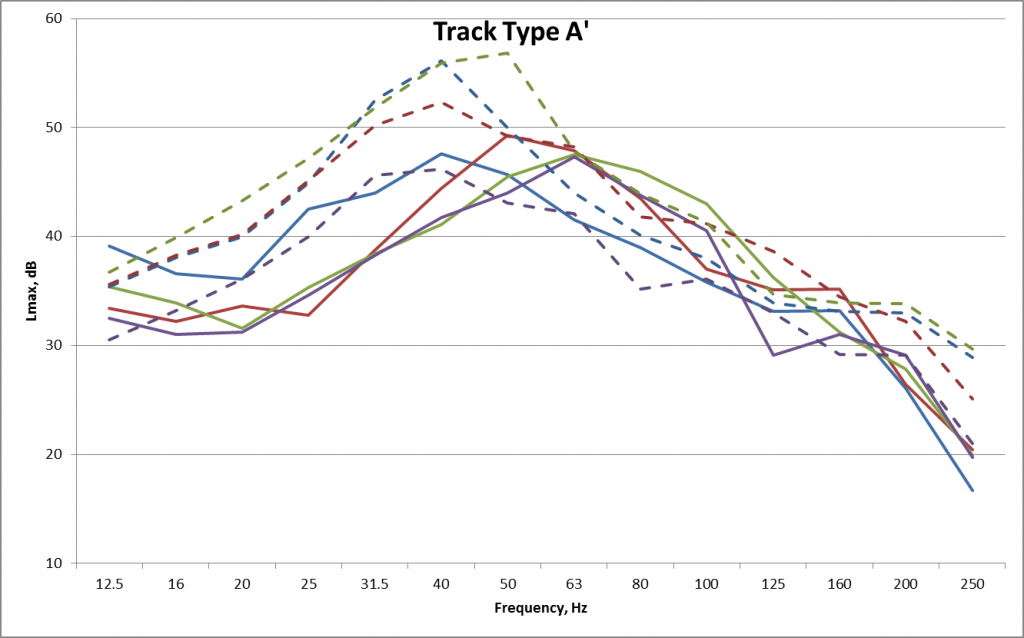
Figure 25 – Track type A comparison of measured and predicted GBN levels (LAMax, S) (colours denote separate train passages, _ _ _ predicted, ____ measured)
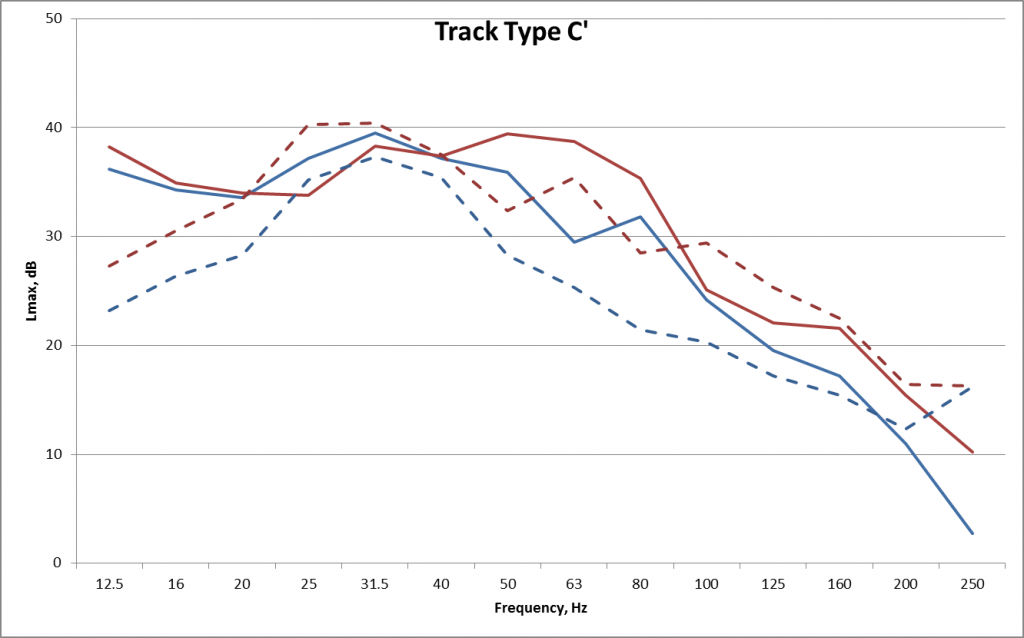
Figure 26 – Track type C comparison of measured and predicted GBN levels (LAMax, S) (colours denote separate train passages, _ _ _ predicted, ____ measured)
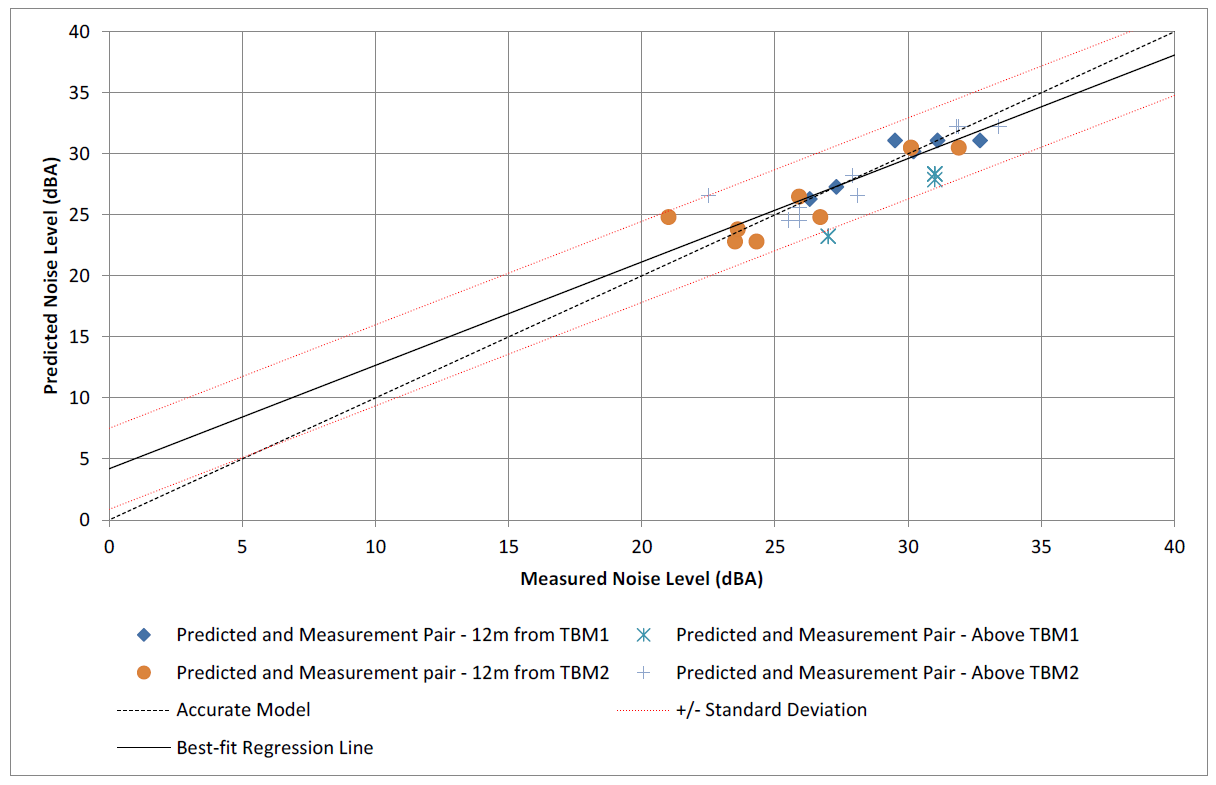
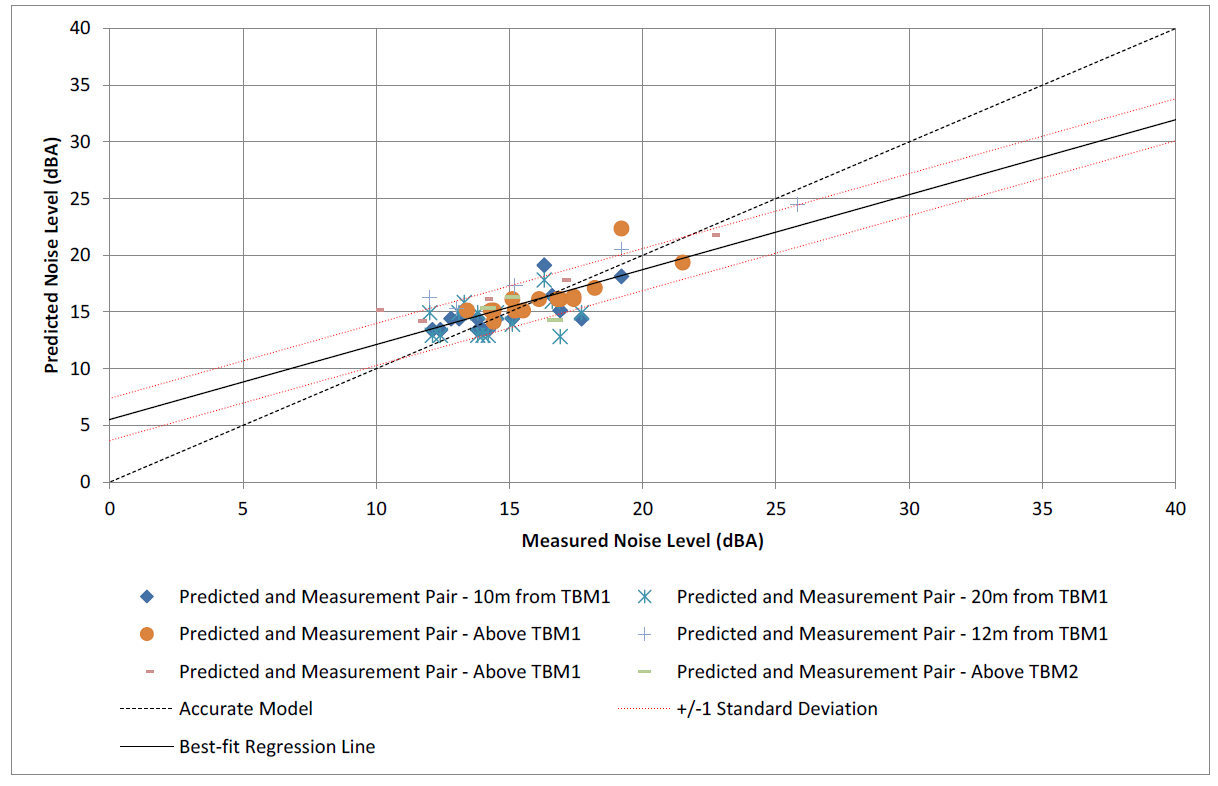
Figures 27 and 28 below display a validation analysis for the PiP modelling software, undertaken in line with ISO 14837-1:2005 ‘Mechanical Vibration – Groundborne-noise and vibration arising from rail systems’, utilising the data measured within Sussex Square. The validation has been undertaken by evaluating the arithmetic mean and the standard deviation of the measurable error distribution created by subtracting the measured value from the predicted value for each case considered in the data set. The mean value and the standard deviation of the measurable error distribution give the systematic (accuracy) and random (uncertainty) components, respectively.
For any value on the x-axis (measured level) the systematic error is given by the difference between the accurate model line and the best-fit regression line projected onto the y-axis. The random error is given by the difference between the upper and lower standard deviations as they intersect with the y-axis. The validation data that has been determined is provided in Table 2 below.
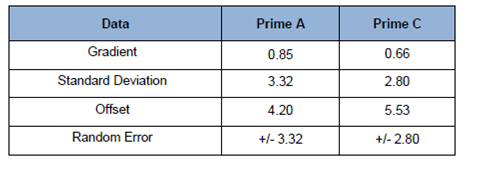
Table 2 – ISO 14837-1:2005 Validation Data
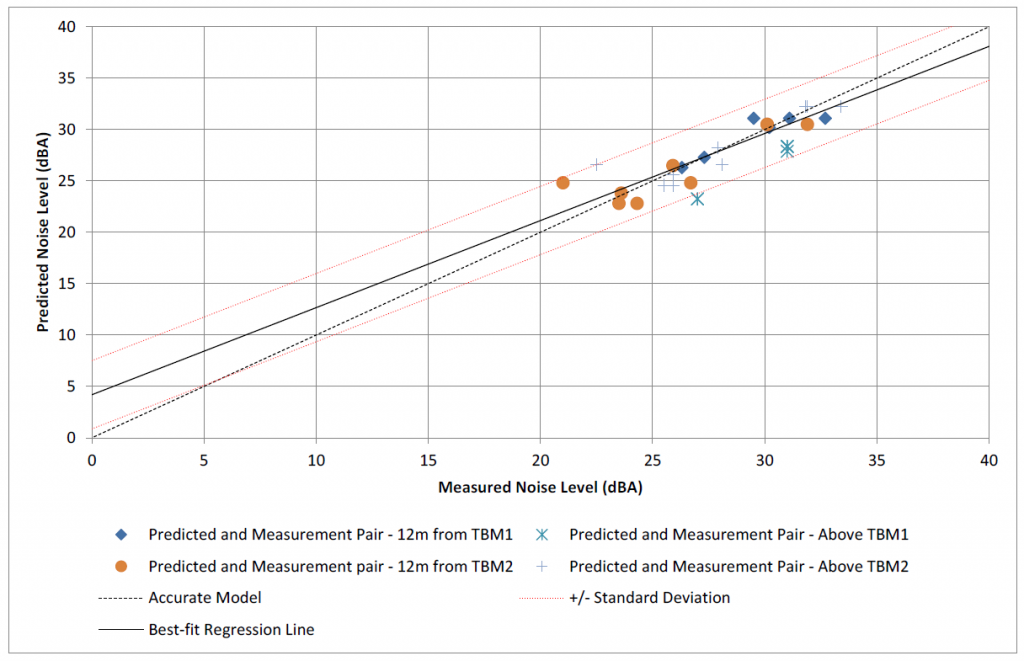
Figure 27 – Track type A ISO 14837-1:2005 model validation analysis

Figure 28 – Track type C ISO 14837-1:2005 model validation analysis
C305 also carried out a validation exercise using tunnel wall vibration measurements and surface measurement at Providence Wharf close to Blackwall tunnel, to the east of the new Canary Wharf station.
Measurements were carried out for a number of construction train pass-bys during the quietest period (i.e. between 23:00h and 03:00h) on the night of the 5/6th June 2013 along a section of tunnel where Track A had been installed. Measurements were taken inside the tunnel and at the two surface locations shown on Figure 29 below. Every pass-by was a train being pulled by a Schoma CHL-200 loco, comprising a Personnel Car and 2 flat cars (total length 35.3 m). No trains were loaded as no segments were being transported at that time.
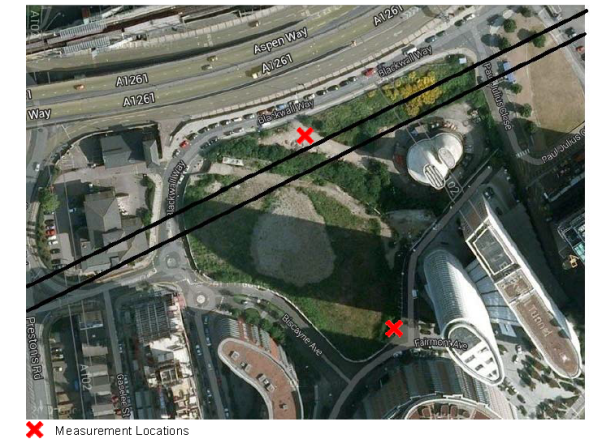
Figure 29 – Measurement location plan for Providence Wharf
The location position for vibration measurement in the tunnel was at a similar chainage to the ground level measurement closest to the tunnel. The accelerometer was fixed perpendicular to the tunnel wall half way up the tunnel (i.e. at “3 o’clock”).
Similar to the C300 measurements, the speed of each train pass was measured using the interference with two light beams each with an input to a channel of the Rion DA-20.
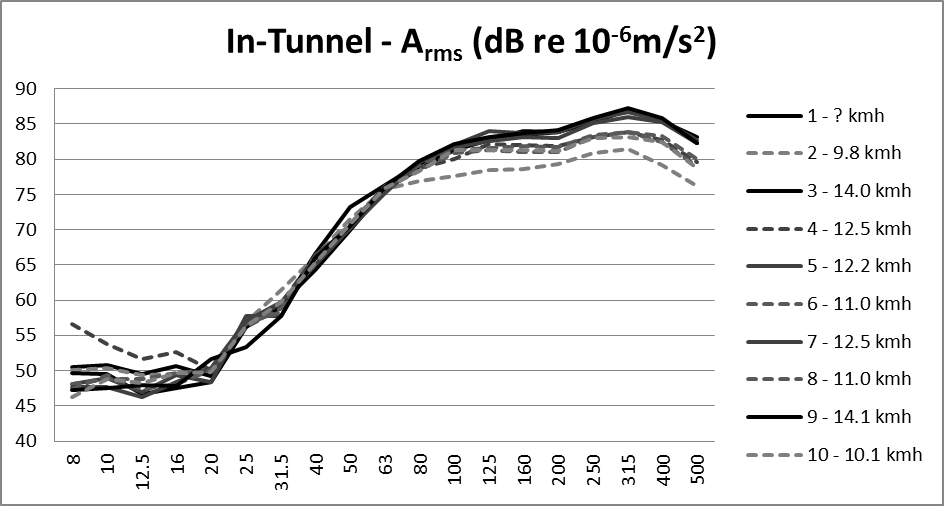
Figure 30 – Tunnel wall vibration measurement results
A further set of tunnel wall measurements were obtained below Pilgrim Mews to establish how much isolation the pads were achieving in the Track B design.
Again, vibration was measured halfway up the tunnel wall (i.e. at “3 o’clock”), perpendicular to the wall. One accelerometer was located at the mid point of the section Track B installed beneath the Pilgrim Mews estate, whilst the other was located 50m from the end of this length of Track B. An example of the rms acceleration for a loaded train event is shown below as the train travelled along both track forms. All trains were travelling at between 14 and 15 km/h during this survey.
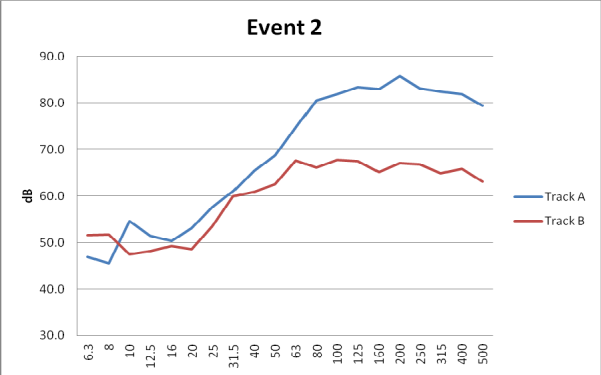
Figure 31 – RMS Acceleration of Trains Carrying Tunnel Lining Segments
Measurements taken on the surface at Providence Wharf were difficult to identify, which is a positive indication that the design of the track/train was effective in terms of vibration control. Three clean measurements obtained directly above the tunnel (at the dewatering site) were identified. Nothing was detectable at a second measurement position located approximately 100m from the tunnel centreline.
Figures 32 and 33 below provide the results of the 3 clean surface measurements analysed for 1/3 octave rms acceleration for the 15s duration covering the highest part of the signal.
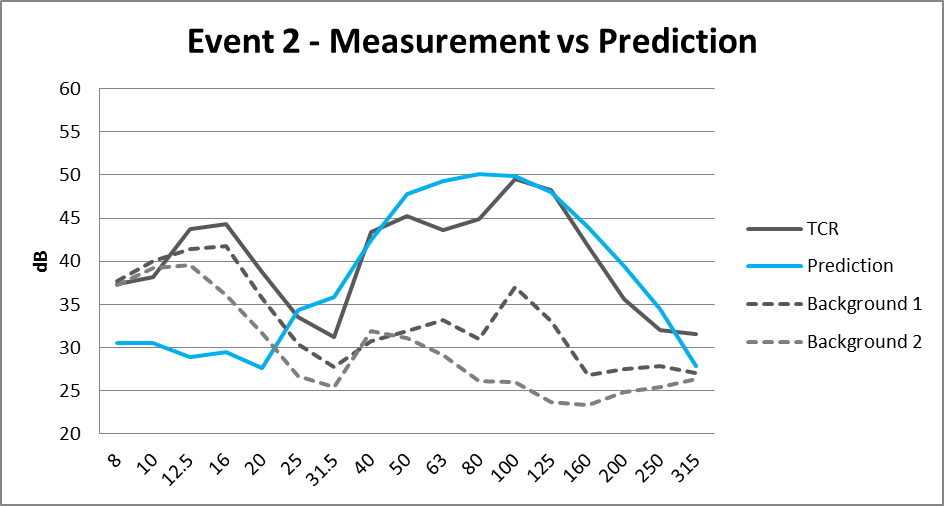
Figure 32 – C305 Measurement vs Prediction during clean “Event 2”
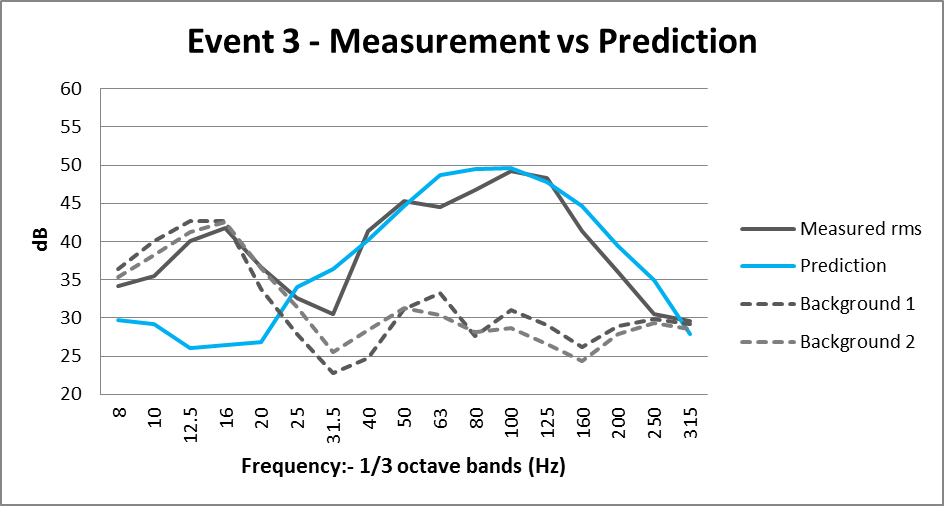
Figure 33 – C305 Measurement vs Prediction during clean “Event3”
It can be seen that predicted levels fit very close to the measured levels bearing in mind the uncertainties involved in such predictions.
A further set of measurements were taken inside a dwelling at Baldock Street, close to the portal at Pudding Mill Lane. The plan was to measure vibration levels inside the tunnel and noise and vibration levels inside the dwelling on 20th November 2013. However, a total of 13 trains passed during the survey but none were felt nor heard by the surveyor within the property. Again, this provided a positive indication that the design and quality of the track and train had been successful even though it was not possible to obtain objective measurement data.
Complaints from the temporary construction railway
Before tunnelling started, both contractors had a complaint handling procedure in place to ensure any potential complaints would be well managed. This included a plan for conducting GBN&V monitoring in the complainants properties as part of wider complaint investigations.
During tunnelling complaints were received from seven different locations. At two locations the complaints were quickly resolved by retrofitting the track with the resilient track types. At the other five locations the complaints could not be clearly or wholly attributed to the construction trains and were confounded by the presence of exposure to and perceptions of changes to GBN&V from the existing London Underground train services. In these cases, Crossrail and Bam Ferrovial Kier JV liaised closely with London Underground to investigate and resolve the complaints.
Complaints Summary
Table 3 below provides a summary of the complaints as well as the results of noise monitoring carried out at the complaint locations.
Location
Measured LAmax,S dB Outcome Construction trains Existing underground train noise Chesham Place 27 – 35 – Retrofitted with resilient track Hyde Park Gardens 31 – 39 40 – 46 Retrofitted with resilient track and report passed to LU Lees Place 32 – 41 – Trains stopped running shortly after survey before resilient track could be retrofitted Sussex Gardens 34 – 38 38 – 41 Crossrail trains within criteria, report passed to LU Brooke Street
34 – 39 30 – 33 Retrofitted with resilient track Red Lion Square 26 – 32 24 – 25 Crossrail trains within criteria Residential receptors in the vicinity of Baldock Street Inaudible and not possible to measure after retrofit n/a The retrofit happened within days of the first receipt of complaint.
Table 3 – Complaints Summary
Conclusions
Crossrail and its contractors acted with determination and fully met all of the assurances, agreements and commitments pertaining to groundborne noise and vibration requirements for the TBMs and operation of the temporary construction railway.
The designs and operational practices ensured that construction trains were barely noticeable to occupants of buildings near to the tunnels.
Very little adverse comment was received in relation to the scale of operations undertaken and the density and diversity of sensitive receptors above the works. This demonstrates that the impact of noise and vibration from the construction railway was minimal.
This positive outcome will no doubt reassure those living above future tunnelling projects that adverse noise impacts from construction train noise can be avoided and that adverse impacts can be reduced to a minimum.
Key learning points:
- The TBMs did not generate significant or adverse noise impacts and very few complaints were received.
- TBM breakthroughs can generate high levels of noise and vibration (although only for short duration). This can be mitigated by preparing ‘soft eyes’ prior to the TBM arrival.
- Resilient track was very effective at mitigating GBN&V from the passage of trains.
- Designing the ability to retrofit resilient track was invaluable for quick complaint resolution.
- The ballast on ballast mat track design was deemed infeasible by both tunnelling contractors, and it was shown that resilient track can achieve sufficient noise mitigation.
References
[1] Crossrail Information Paper D10 – Groundborne Noise and Vibration. Version 4 – 03/04/08
[2] Construction Code (Annex 1 to the EMR)”. Revision 7 – 31/07/08
[3] Greer R, J., “Methods for Predicting Groundborne Noise and Vibration from Trains in Tunnels”. Proceedings of the Local Authority Rail Impact Forum (1999)
[4] “Pipe in Pipe (PiP): a software for calculating vibration from underground railways” Developed by: Dr. Mohammed Hussein and Dr. Hugh Hunt. (http://www2.eng.cam.ac.uk/~hemh1/PiP.htm)
[5] E E Ungar. and E K Bender. “Vibrations produced in buildings by the passage of subway trains: parameter estimation for preliminary design”. Proc 4th International conference on noise control engineering (INTER NOISE 75) Sendai Japan. 1975
[6] T.G. Gutowski, C.L. Dym, Propagation of ground vibration: A review, Journal of Sound and Vibration, Volume 49, Issue 2, 22 November 1976, Pages 179-193, ISSN 0022-460X
[7] D. Thompson. “Railway Noise and Vibration, Mechanisms, Modelling and Means of Control” 1st Edition, December 2008
-
Authors

Andrew Bird BSc (Hons) MIOA - Crossrail Ltd
Andrew was appointed as the Acoustic Manager at Crossrail in 2015, with responsibility for providing specialist noise and vibration advice to the Crossrail programme, promoting a consistent approach to noise and vibration issues on construction, fixed plant and the operational railway and identifying and disseminating best practice and lessons learned.
Andrew has 10 years experience in acoustic consultancy and has been with Crossrail since 2011. During these 10 years Andrew has had significant involvement in major infrastructure projects, resolving construction noise and vibration issues, producing environmental impact assessments and consent applications. This includes Crossrail, Thameslink, High Speed 2, Thames Tideway, and Defence Training Academy St Athan.
Andrew has also managed the acoustic design of several significant architectural projects, including school, hospital, residential, office, commercial and religious buildings. During this time he has gained experience of advanced noise and vibration modelling, monitoring and data analysis. Andrew is a committee member of the London branch of the Institute of Acoustics and is a Science Technology Engineering & Maths (STEM) ambassador, volunteering in Schools.

Colin Cobbing BSc(Hons), CEnvH, MCIEH, MIOA - Arup, Crossrail Ltd
Colin has 30 years experience in acoustics. He has spent most of his career working on major infrastructure projects, spanning all different stages of scheme development ranging from: project inception, obtaining major consents, design and specification, procurement, construction, completion and commission testing. The majority of his time has been supporting promoters of schemes and contractors. He has also supported local authorities in the discharge of their planning and environmental health duties.
Colin prides himself on working openly and collaboratively with local authorities, communities and other stakeholders to reduce the scale and extent of noise impacts arising during the construction and operation of major projects.
He joined Crossrail in 2009. Prior to that he was the Noise and Vibration Manager for Network Rail on the Thameslink Programme and for the Hitchin Grade Separation Project. Between 2009 and 2015 he was Crossrail’s Noise and Vibration Manager in the Sustainability and Consents Team. In 2015 he scaled back his involvement to focus on leading the Acoustics Team at Arup. However, he still continues his involvement and is overseeing the completion of the design and installation of the Crossrail track systems in the central section.


Tom Howden - BAM Ferrovial Kier
Tom Howden was the Environment Manager for BFK Western Running Tunnels and Station Project on Crossrail between 2011 and 2014. He led the Environmental Management team and supporting consultants to deliver an IS014001 accredited environmental management system across 8 main construction sites in London. Tom currently works as an Area Environment Manager for Kier, providing support for a range of major Infrastructure projects in the South including civils, highways and rail. Tom has thirteen years experience in the environmental sector, first as an Environmental Consultant with Atkins but then moving to construction, initially through work on London 2012.
Graham Parry - ACCON UK Limited
Graham Parry is the Managing Director of ACCON UK Limited and has over 40 years of experience in noise, vibration, air quality and environmental work in the transportation (rail, road and air), chemical, mining, petrochemical and architectural fields and has worked extensively in the United Kingdom and internationally. He is experienced in the co-ordination and management of multi-disciplinary teams working on environmental issues, including air quality, noise, dust, water quality, socio-economic, ecology and landscape issues. He has been actively involved in providing advice to Government departments, Local Authorities, developers and contractors in relation to the environmental aspects of planning, design, construction and operational use of a variety of schemes including railways. He is a Fellow and Vice President of the Institute of Acoustics. On the Crossrail C300 project he was responsible, from 2012 to 2014, for developing a prediction methodology to determine groundborne noise and vibration above the construction tunnel due to construction train movements.

Steve Summers BSc, MSc, CEng, MIOA - ACCON UK Limited
Steve is an Associate Director at ACCON UK Ltd and is an acoustic consultant with over 25 years’ experience specialising in environmental noise and vibration of major transport and infrastructure projects. At Anderson Acoustics, he advised various main contractors constructing different parts of Crossrail. One of these roles was as the groundborne noise and vibration specialist for the BAM Ferrovial Kier JV on the C300 Western Tunnels contract from 2012 to 2014. Steve has had an extensive involvement on Crossrail, starting in 2003 assessing noise and vibration for the main Environmental Statement. As part of his role of managing the noise and vibration advisor contract to Crossrail he prepared noise chapters for Additional Provisions and Supplementary Environmental Statements throughout the Hybrid Bill process. The role continued after the Crossrail Act was passed with management of Section 61 applications for advanced works, noise assessments for special cases and preparation of noise and vibration guidance documents for the project.
Steve has been involved in many other major projects including Thames Tideway, Heathrow Third Runway, Stansted G2, London Gateway, Corrib Gas Onshore Pipeline, and numerous highway schemes, energy projects and housing/mixed-use developments. Steve has worked on government funded research projects in building and environmental acoustics and on the noise aspects of several government transport studies.