Real time determination of the utilisation of a sprayed concrete lining during tunnelling
Document
type: Technical Paper
Author:
Dr Alfred Stärk Dipl Ing Dr Ing, Dr Rudolf Zachow, ICE Publishing
Publication
Date: 07/09/2015
-
Read the full document
Notation
Ch. Chainage
PTW-E EL Platform Tunnel Westbound-East heading Enlargement
SCL Sprayed Concrete Lining
fc ultimate strength cylinder
Notation for constitutive law “modified LUBBY2”
k1 spring rigidity, calibration parameter
k2 viscosity, calibration parameter
n1 viscosity, calibration parameter
n2 viscosity, calibration parameter
s1 spring rigidity, stress dependent
s1* spring rigidity, constant
s2 viscosity, stress and time dependent
s2* viscosity, constant
t time
ta age of sprayed concrete
to start of creep test
a correction factor
eR failure strain from test results
e.v strain rate, viscous
y diminution factor
Introduction
The displacements of the sprayed concrete lining must be measured during tunnel excavation and checked against predictions in order to assess stability. Generally, if the measured displacements are equal or less than the predictions, stable and safe conditions are assumed.
However, just looking at single displacements is insufficient to assess stability. Displacements are not necessarily creating stress in the lining, such as in the case of whole body movement of the lining. Time-displacement graphs are important to analyse in order to determine whether a new equilibrium has been established and stable conditions can be assumed. However, they do not tell anything about the actual stress state in the lining.
The deformation, i.e. the relative displacements between monitoring points have to be taken into account. For this reason it is common to calculate convergences and divergences across the tunnel section or strain between adjacent monitoring points to check against predictions.
Here arises a challenge in assessing stability, since the newly sprayed concrete is a highly time dependent material which changes its parameters rapidly during the ongoing excavation. In addition young shotcrete has a pronounced capability of creep: it is known that young shotcrete can take significantly more strain without failure than the ultimate strain stipulated in the standards (given that the load builds up slowly which is typically the case during tunnelling). This strain includes a large part of creep strain. The same deformation occurring at different ages of the shotcrete creates a different state of stress. For this reason not only is the amount of deformation important, but also the time when it occurs.
Measured displacements – and related convergence and strain – often deviate from the predicted values; e.g. in multi stage excavations or in heterogeneous geology with a wide variation of measured values. Predicted values are difficult to compare against the measured, because calculations often struggle to take the time dependent behaviour of a sprayed concrete lining into account. Hence, calculations are often of limited help in assessing stability while tunnelling proceeds.
To overcome these issues the Utilisation method has been developed to determine the stress state of the sprayed concrete lining on the basis of measured displacements and in real time.
Utilistion is defined as the ratio of actual stress and permissible stress; and thus, it gives the actual factor of safety.
The method was developed in 1995 by Prof Reinhard Rokahr and Dr Rudolf Zachow at the Leibniz University of Hanover, Germany. That same year, a first attempt to calculate the Utilisation was made during construction of the Römerberg tunnel in Austria [1]. Later, the Utilisation method was introduced to the tunnelling industry in 1997 [2] and ever since has been improved and updated [3], [4]. Utilisation became a contractual requirement on sprayed concrete tunnelling projects in Austria. Crossrail contract C510 is the first occurance of its application in the UK.
Nowadays two different Utilisation methods exist: the “Hanover-method” by Rokahr and Zachow, which is described in this paper, and a more recent “Vienna-method” [6], [7]. The Vienna-method uses a completely different approach to describe the rheological behaviour of the sprayed concrete: a thermo-chemo-mechanical constitutive law. And also the algorithm of calculation is different. However, both methods vary only marginal in the resulting Utilisation. Zachow and Rokahr arrive at this conclusion comparing both methods which have been used simultaneously during construction of the Lainzer Tunnel Lot LT31 in Vienna between 2007 and 2009 [5]. A case study of Lainzer Tunnel LT31 can be found in Chapman et al. (2010) [16].
The Hanover-method has been checked by means of in-situ testing of the sprayed concrete lining using the compensation method [14]. This method involves cutting stress-releasing horizontal slots into the intrados of the sprayed concrete lining. The circumferential hoop stress generates deformation, i.e. narrowing the slot, which is reversed by pumping up hydraulic pressure cells. The deformation due to stress-relaxation and subsequent reversing is measured throughout the process as well as the pressure for compensating this deformation. The compensation pressure equals usually to the pre-cutting stress in the lining. These tests have been performed on several locations within the 2.8km and 13.5m diameter Eggetunnel, Germany. The test results corresponded in most cases very well with the stress derived from Utilisation [14]. Further information on the Eggetunnel can be found e.g. in Chapman et al. (2010) [16].
Flac3D has been used to compare results from strain calculation (explained further down in this paper, see Utilisation, the Hanover-method / Creep strain) and the resulting stress with the Hanover-method [3]. The results derived from Flac3D and Utilisation are nearly congruent for both, strain and stress.
Utilisation, the Hanover-method
Main features and sequence of calculation
One of the main advantages of the Utilisation is that it does not need to rely on assumptions with respect to vertical and horizontal load, ground conditions, ground parameters, construction sequence, and so on.
The Utilisation is back calculated purely based on in-situ data, using the in-tunnel displacement measurements and as-built information of the lining. Utilisation is calculated individually for different sections of each monitoring array and for each in-tunnel reading. The results are ready for review in the daily review meeting.
In-tunnel displacement measurements have to be taken anyway. The Utilisation is just another step of processing these data further, a “by-product” if you like, even though a pretty sophisticated.
The features mentioned below are taken into account:
- as built geometry of SCL;
- as built thickness of SCL;
- as built position of monitoring target;
- deformation of SCL at the time of the reading;
- actual compressive stress of SCL at time of the reading;
- permissible compressive stress of SCL at time of the reading;
- actual strain at time of the reading;
- ultimate strain at time of the reading;
- time dependent stress-strain relation (constitutive law for creep and relaxation).
Sequence of calculation is as follows:
- Base reading of a new monitoring array is taken and fed into the Utilisation data base.
- At each monitoring array the sprayed concrete lining has been divided in sections which are defined by three adjacent monitoring targets. The length of each section is calculated.
- The next measurement is taken and fed into the data base.
- The length of each section is calculated again. Due to displacements of the lining the new length will differ from the original length. This differential length gives strain.
- The total strain is parted in elastic strain and viscous strain by means of the constitutive law.
This is an iterative process, where the elastic strain is estimated at the start. This elastic strain is correlated to a stress level in the lining via stress-strain relation, taking the shotcrete age at the time of reading into account. This stress and the age of the shotcrete are the input parameters for the constitutive model to determine the viscous part of the strain. The sum of (estimated) elastic strain and the viscous strain is compared to the total strain calculated from the measurement.
Elastic strain will be adjusted until elastic strain plus the correlated viscous strain matches with the total strain from measurement. - The viscous strain is not contributing to the stress in the lining, but the elastic strain. The elastic strain at the end of the iterative process correlates to a stress in the shotcrete lining via the stress-strain relation adjusted to the shotcrete’s age. This is the existing stress derived from measurements.
- The permissible stress the shotcrete can take at this particular age is calculated by the strength development over time.
- The Utilisation is the ratio of actual stress and permissible stress and is given in percentage. 100 % equals the bearing capacity of the shotcrete and a current factor of safety of 1.0. The stress in the lining cannot be increased. Utilisation of 50 % equals a current factor of safety of 2.0.
Usually several monitoring arrays are analysed along a tunnel lining. The shotcrete has a different age at each monitoring array, hence different permissible stress. Thus, it is more useful to give the Utilisation as a percentage rather than absolute stress values. The latter can be done, e.g. to analyse the development of stress with excavation progress in an individual monitoring array.
- The calculated utilisation is valid at the time of the displacement measurement. With the next measurement the calculation has to be repeated (different total strain, shotcrete is older, so different ultimate strength and ultimate strain).
Geometry
The shape of a tunnel – locking at a cross section – is usually designed using circles and arcs of circles respectively due to the favourable loading capacity and the ease of construction. Calculating Utilisation the assumption is made that the lining keeps a circular shape throughout the construction process. The lining is divided into sections which are defined a by three adjacent monitoring points. This is because a circle is geometrically determined by three points. The co-ordinates of the monitoring points are known since they are taken with every measurement. With every measurement the as-built radius for each section can be calculated and its length. An obvious condition is a more or less continuous as-built radius for each section. When defining the sections during the project specific set up of the Utilisation severe changes in radii should be avoided.
Each monitoring array consists of a number of monitoring points, usually five to seven. This can vary depending on size and shape of the tunnel and probably on construction stages. Five monitoring points evenly distributed along the vault would define three sections to be used for calculating Utilisation (Figure 1); seven monitoring points would provide five sections.
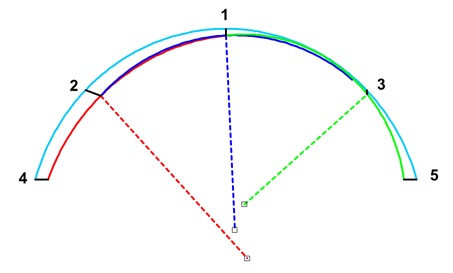
Figure 1 – lining divided into circular sections. Points numbered to in-tunnel system [3]
Parting the tunnel lining into sections gives the benefit to calculate Utilisation more specifically since not necessarily all monitoring points will move in the same way, if the lining is loaded unsymmetrically, e.g. due to inclined strata or at openings. Also, section can be defined to accommodate complicated geometries and multiple excavation stages, e.g. a side wall drift.
The length of each section is calculated for the intrados and extrados of the lining to allow for bending moments. Therefore the as-built thickness of the lining needs to be taken into account as well as the actual distance of the monitoring targets to the intrados.
There are more ways to approximate the shape of the lining rather by segments of circles, e.g. by means of splines used in the Vienna-method or parabolas. Different methods are discussed and compared in Zachow and Rokahr (2009) [5].
Compressive strength
One key to Utilisation is the knowledge of the stress-strain behaviour which has to be specifically adjusted to the age of the shotcrete at the time of the displacement measurement. To start with, the development of the compressive strength must be known.
At Crossrail C510 the base reading of a new monitoring array is taken before the next advances commences. The age of the sprayed concrete at the time of the base reading is therefore usually one hour or less. If this sequence differs for some reason the precise time of spraying is recorded in the shift report. Thus, the time of “birth” of the sprayed concrete can be determined by the hour. Also date and time of each displacement measurement are recorded as the measurement is taken. The difference in time between “birth” and measurement defines the age of the shotcrete at that time.
Crossrail’s specification for contract C510 requires a compressive strength of C32/40 at 90 days [10]. Regular tests on cores at 3 days, 28 days, and 90 days proved that the strength as early as 3 days is not far off this requirement as shown in Table 1.
Proposals for the development of compressive strength can be found in the publications by CIB-FIB 90 [8] and Weber [9], also shown in Table 1. The corresponding graphs and formulas are shown in Figure 2.
Age of shotcrete
days
C510
MPa
CEB-FIB 1990
MPa
Weber
MPa
3 40.9 32.2 38.7 28 48.6 48.6 48.6 90 53.3 53.1 50.6 Table 1 – shotcrete cores ultimate compressive strength. C510’s values are the mean ultimate strength on core samples for Liverpool Street and Whitechapel Station. Formulas after CEB-FIB and Weber are to match the strength at 28 days (= 48.6 MPa).
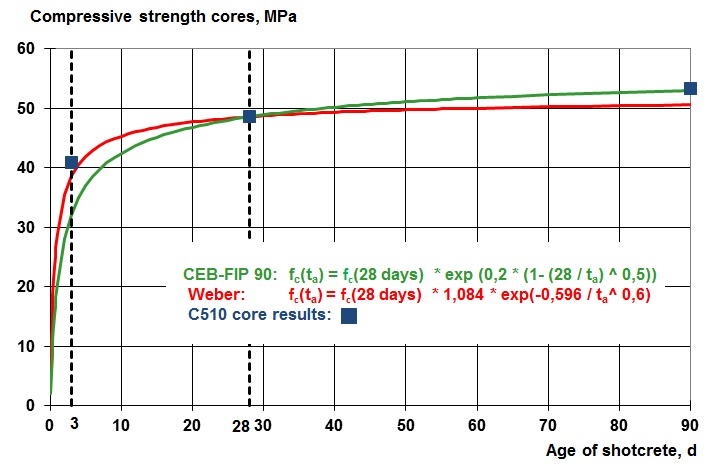
Figure 2 – compressive strength vs. age of shotcrete ta[3], [4]
The approach by Weber is closer to the cores at 3 days, the CEB-FIB 90 formula on the other hand matches nearly perfectly well with the 90 days strength. Actually, both formulas can be used to calculate the strength of the shotcrete lining. The CEB-FIB 90 formula is implemented in the Utilisation programme, just because it was matching the strength development on previous projects better. With respect to C510 the early strength is underestimated, resulting in a slightly higher Utilisation (to be on the safe side).
Utilisation needs the input of the project specific compressive strength at 28 days. At C510 the ultimate compressive strength of 48.6 MPa has been used. This provides a clear idea when the lining reaches its limits. However, project specific it may be necessary to reduce this strength and apply a partial safety factor, e.g. to cover long term effects or to convert cube strength if cores are not available. It must be clear that a smaller value than the ultimate strength involves some hidden reserves when Utilisation is calculated.
Ultimate strain
Next is the development of the ultimate strain.
Young shotcrete can take significantly more strain without failure than the ultimate strain stipulated in the standards, given that the load builds up slowly. The strain then includes a large part of creep strain. If the load builds up quickly the ultimate strain of young shotcrete is by far less. As with the compressive strength, the ultimate elastic strain develops as the shotcrete hydrates.
Figure 3 shows the development of the ultimate strain against the age of the shotcrete. The graph is based on sample testing found in Wierig (1968) [11], Khan et al. (1995) [12], and Xianju et al. (2000) [13]. The test results are quite close together. The formula used in Utilisation has been developed from the measured data on the samples after Wierig (1968).

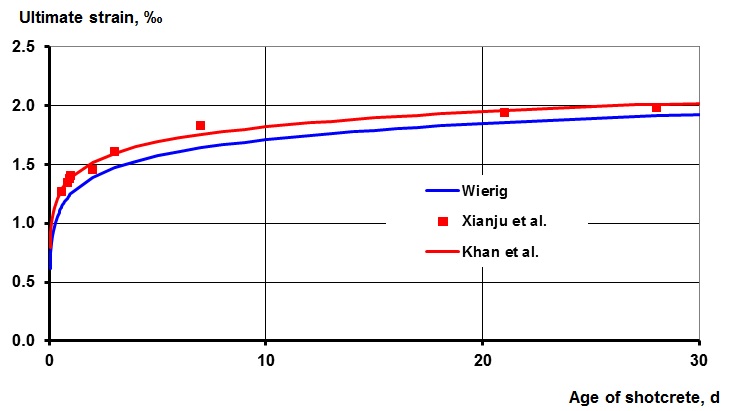 Figure 3 – ultimate strain vs. age of shotcrete ta[3], [4]
Stress-strain behaviour with respect to age of shotcrete
With the development of strength and strain the stress-strain behaviour with respect to age of shotcrete can be determined (Figure 4).
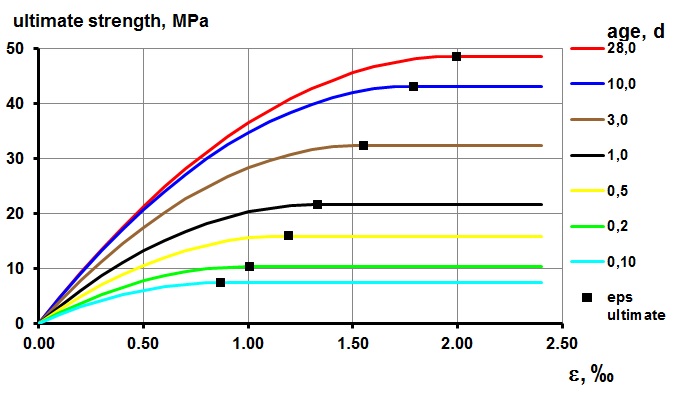
Figure 4 – stress-strain graph for different age of shotcrete ta[3], [4]
The stress-strain relation is necessary to determine the stress level in the shotcrete lining. The stress – next to the age of the shotcrete – determines the amount of creep:
The total strain derived from the displacement measurements consists of elastic strain and creep (viscous) strain. The viscous strain, which does not generate stress, is determined by means of an iterative process, where the elastic strain is estimated at the start and is correlated to a stress level via the above shotcrete-age-dependent stress-strain relation. This stress and again the age of the shotcrete are the input parameters for the constitutive model which is introduced in the next chapter. The output is the viscous part of the strain. The sum of (estimated) elastic strain and calculated viscous strain is compared to the total strain derived from measurement. Usually the strains will not match straightaway, so that the elastic strain has to be adjusted, until elastic strain plus the correlated viscous strain matches with the total strain from measurement.
The elastic strain at the end of this iterative process will determine the actual stress in sprayed concrete lining at the time of the displacement measurement.
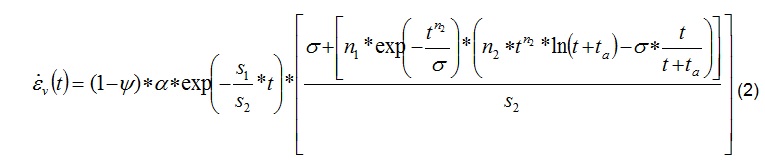
Creep strain
The roots of the constitutive law used in the Hanover-method are going back to the early 1990s. Since then, it has been adjusted and improved with more test results on shotcrete samples available to the current form [3], [4], see Equation (2). To distinguish it from other constitutive laws developed in Hanover it has been called “modified LUBBY2”.
The diminution factor y is derived according to the development in strength,
 The spring rigidity s1 is
 the viscosity s2
 and correction factor a
 From laboratory data of several projects it is known that different shotcrete recipes, additives, aggregates etc. cause different creeping behaviour. The constitutive law, Equation (2), has to be calibrated to match the creeping behaviour of the project specific shotcrete mix. Thus, the constant parameters k1, k2, n1, n2, s1* and s2* are derived from laboratory creep test. The diminution factor y in Equation (6) for a shotcrete age of t0 at the beginning of the test is
  Creep tests have been performed for C510’s BBMV MIX P1 on 9 shotcrete cores [15]. Three samples each have been tested with constant loads of 8 MPa, 11 MPa, and 15 MPa respectively for 14 days (336 hours). The samples were 2 days old at the beginning of the test. Figure 5 shows the test results along with the creep curves as per calibrated constitutive law (2).
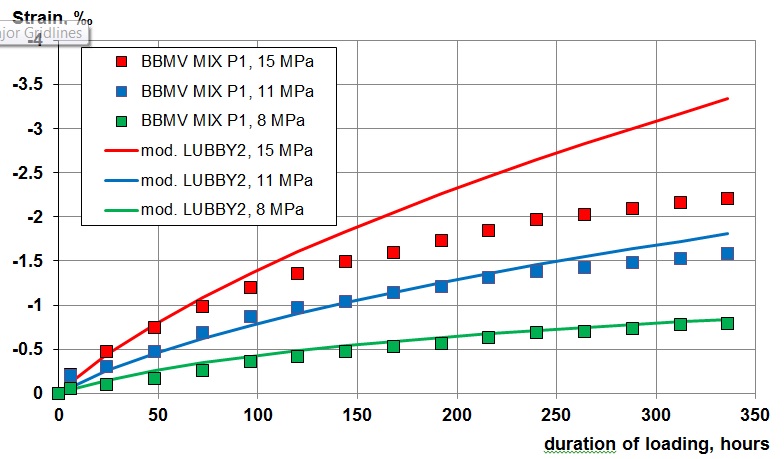
Figure 5 – creep tests on shotcrete cores for BBMV MIX P1 at Crossrail C510
The constant parameters k1, k2, n1, n2, s1* and s2* have been adjusted to match the test results of 8 MPa and 11 MPa constant load. It was not possible to find a set of parameter which suits all three load levels. The highest load level of 15 MPa would require its own set of parameters.
As seen in Figure 5 the creeping ability is fading out with time. This is in line with test results on various other projects, which confirms that creeping is significant within the first 8 to 12 days (200 to 300 hours in the graph). After 28 days it is in most cases negligible. This is roughly the limit up which the constitutive law can be used. For shotcrete age beyond 28 days elastic behaviour is assumed in Utilisation.
The absolute values for in-tunnel displacements all over C510’s tunnelling work were fairly small, less than 10 mm vertically in the Pilot Tunnels and less than 20 mm in the Enlargements. The horizontal displacements were mostly negligible. Usually half of the vertical displacements was whole body displacement, so that deformation creating stress and strain was limited to maximum 5 mm in the Pilot Tunnels and maximum 10 mm in the Enlargements. All displacements occurred within the first 3 to 7 days, at a time when the creeping ability of the shotcrete is the highest. From this point of view a fairly minor stress level in the lining can be assumed. Therefore the parameters k1, k2, n1, n2, s1* and s2* have been set to fit the lower load levels. It can assumed that the high load level of 15 MPa would only be reached around the break out for openings at cross passages or at similar structures, anyway at later time when the age of the shotcrete is far beyond significant creeping ability and the modified LUBBY2 comes not into effect any more.
Case history Crossrail C510
Crossrail C510, Liverpool Street Station and Whitechapel Station
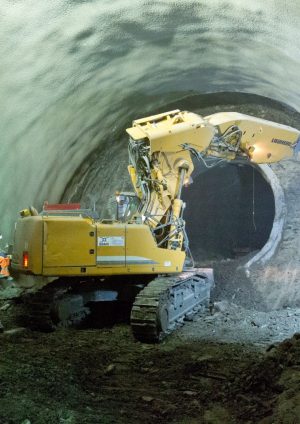
The Crossrail C510 contract comprises the construction of the station tunnels for Liverpool Street Station and Whitechapel Station of the new Crossrail regional west-east railway in London, construction time 2011 – 2016. All station tunnels were excavated using the LaserShellTM method with sprayed concrete as primary and permanent support. LaserShellTM has been developed for Heathrow’s Terminal 5 tunnelling works. Details of the LaserShellTM can be found in Eddie and Neumann (2003 and 2004) and Chapman et al. (2010) [16], [17], [18].
The most prominent feature is the inclined and domed face which enables the tunnelling workforce to approach the face closely while protected overhead by hardened shotcrete from previous advances. Excavation profile as well as the thickness of each layer of shotcrete is controlled and recorded via the TunnelBeamerTM in real time.
Whitechapel Station, Platform Tunnel Westbound
Figure 6 shows the layout of Whitechapel Station. Excavation started from a temporary construction shaft. Both Platform Tunnels Eastbound and Westbound have been excavated in two directions, to the West and to the East. Up to three headings were running simultaneously. All Platform Tunnels have been excavated in two stages (see Figure 7):
- excavation of a ≈6.5m diameter Pilot Tunnel; full face excavation with advance length of 1m; Pilot Tunnel was followed by the
- excavation of the ≈11m diameter Enlargement; two advances in top heading á 1m and one advance in invert á 2m- including ring closure.
The case history focuses on the Enlargement of Platform Tunnel Westbound – East heading (PTW-E EL), Chainages 38 and 41 (see Figure 6).
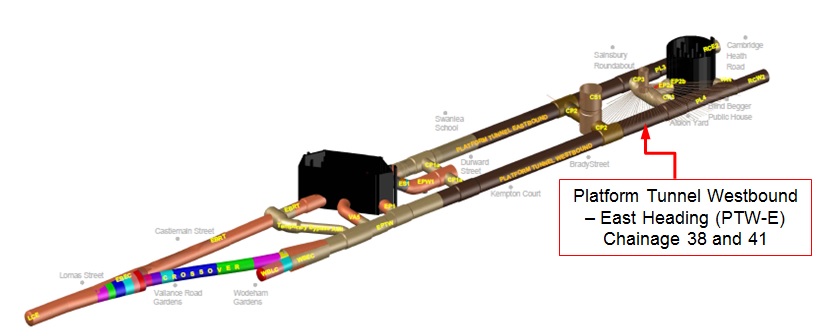
Figure 6 – Whitechapel Station Layout. Case history looks at Platform Tunnel Westbound – East Heading Enlargement (PTW-E EL). Graphic Credit: BBMV JV C510.
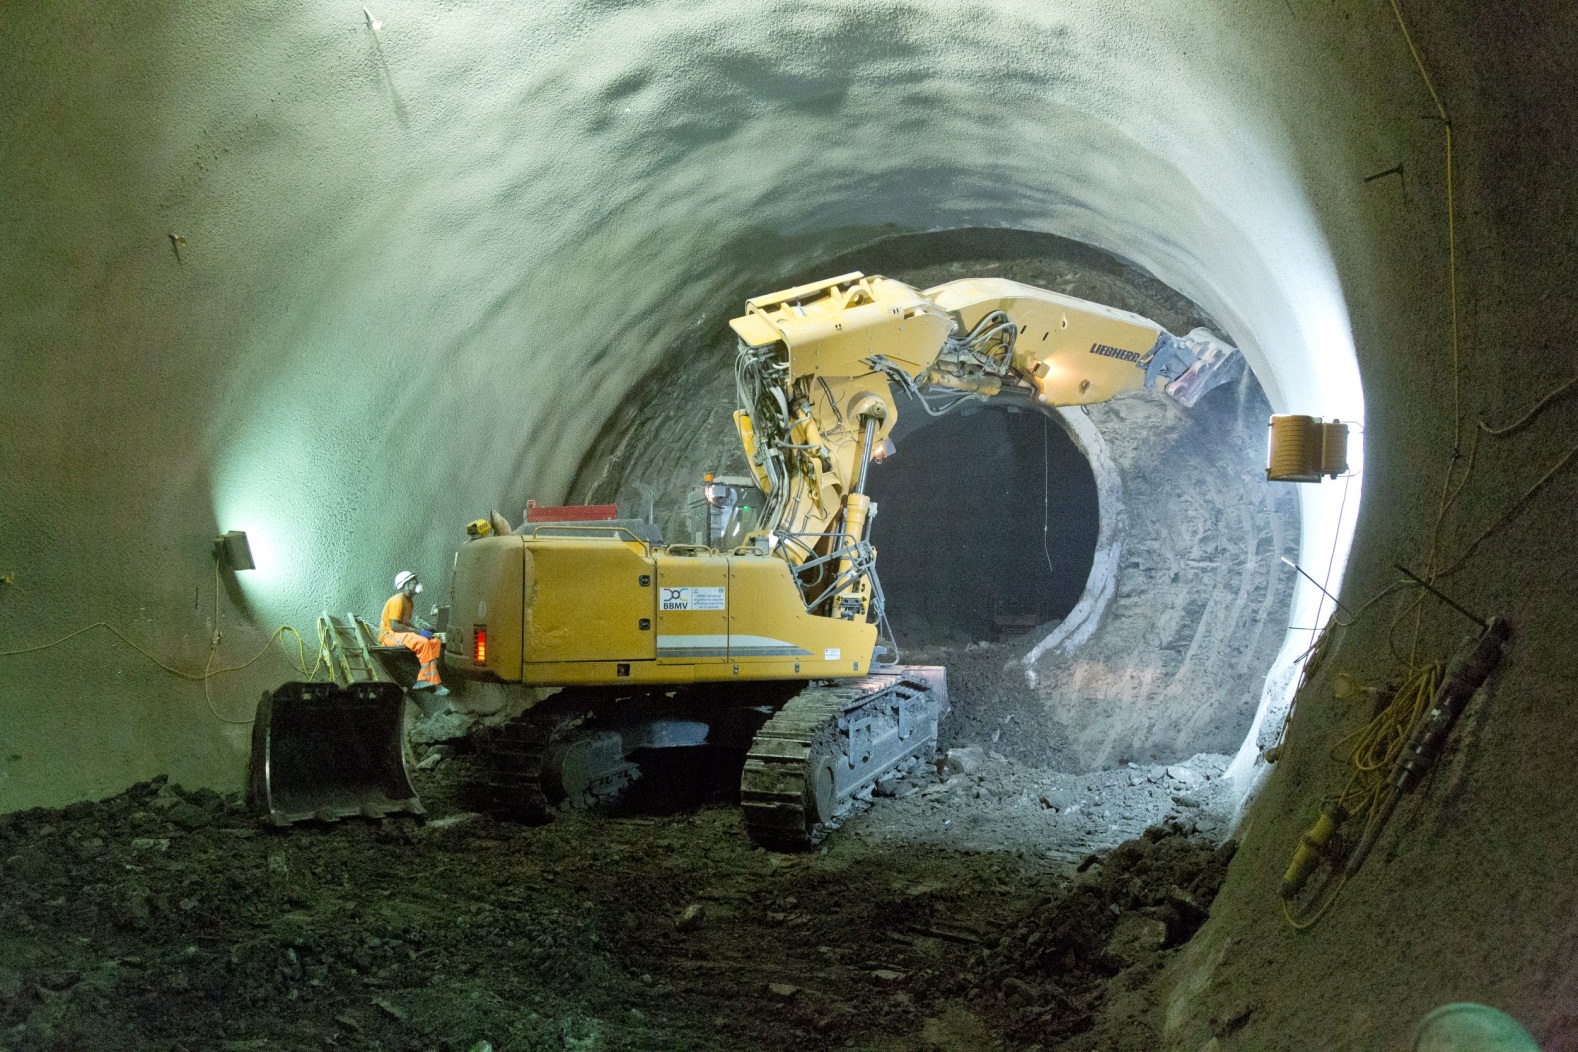
Figure 7 – Platform Tunnel Enlargement with previous excavated Pilot Tunnel using LaserShellTM at Whitechapel Station for Crossrail C510. Photo Credit: Alfred Stärk
Displacement analysis Chainages 38 and 41, PTW-E EL
At Chainage 40 (Ch. 40) excavation stopped temporarily for nearly two weeks, from 24.03. – 10.04.2013. The last monitoring array was installed at Ch. 38 just two meter away from the temporary headwall. Figure 8 shows the vertical displacements of monitoring points 1, 3, and 5 (right shoulder; the other points are not shown for the sake of clarity). Stop and recommencement of excavation are clearly visible with the immediate fading out after the stop and the sudden increase after excavation has restarted.
The largest settlement is visible in the crown (point 1) which shows a total of 7 mm at the time of the safe stop. The settlement increased to ca. 23 mm at the end. The least settlement is at Point 5, located near axis level, with half of Point 1’s settlement at all times (Figure 8). In conclusion, half of the total settlement has to be contributed to whole body movement which does not generate stress in the lining.
The effect on the horizontal direction is not that obvious because from the beginning nearly no horizontal displacements occurred and this trend continued (Figure 9). Point 5 had about 1 mm to 2 mm divergence at the time of the safe stop which increased to 3 mm to 4 mm in the end. Point 1 at crown shows no horizontal movement as expected apart from monitoring accuracy visible after restart of excavation: all points moving the same amount to the negative and back to the original value.
In this section of PTW-E compensation grouting has been done continuously along with the advancing tunnel excavation. Compensation grouting is most likely the reason for the long lasting settlement for nearly 4 weeks. Usually settlement faded out after one week or less.
Immediately after recommencement of excavation a new monitoring array has been installed at Ch. 41; shown in Figure 10 (vertical displacements) and Figure 11 (horizontal displacements). Ch. 41 shows the regular settlement behaviour of a continuous excavation which has been observed for the Enlargements at Liverpool Street Station and Whitechapel Station.
The vertical displacements are usually not exceeding 15 mm (crown) and the horizontal displacements remain very small with a tendency to divergence. The only anomaly at Ch. 41 is long lasting settlement which is contributed to continuous compensation grouting.
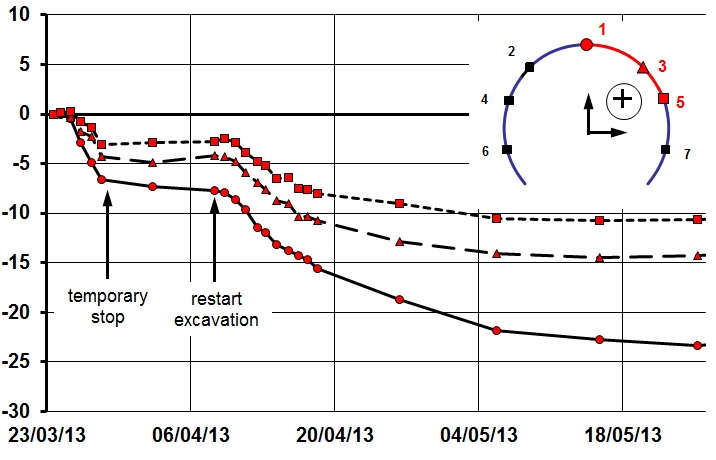
Figure 8 – Ch.38 vertical displacements points 1, 3, 5 (PTW-E EL, WHI). Points 2, 4, 6, and 7 are not shown for the sake of clarity. Negative displacements = settlement.
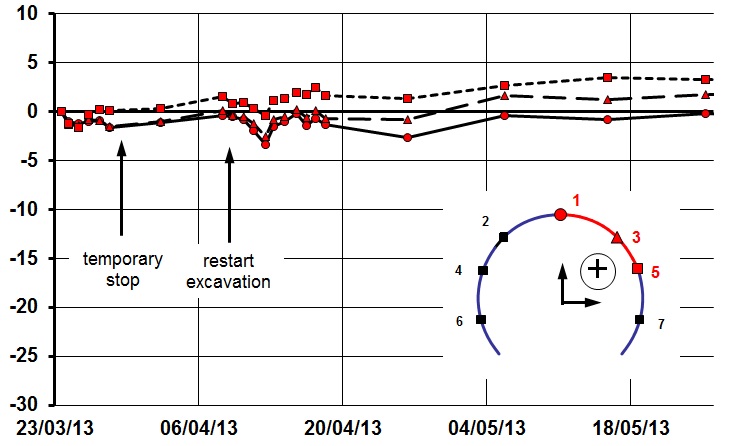
Figure 9 – Ch.38 horizontal displacements points 1, 3, 5 (PTW-E EL, WHI). Positive displacements = divergence.
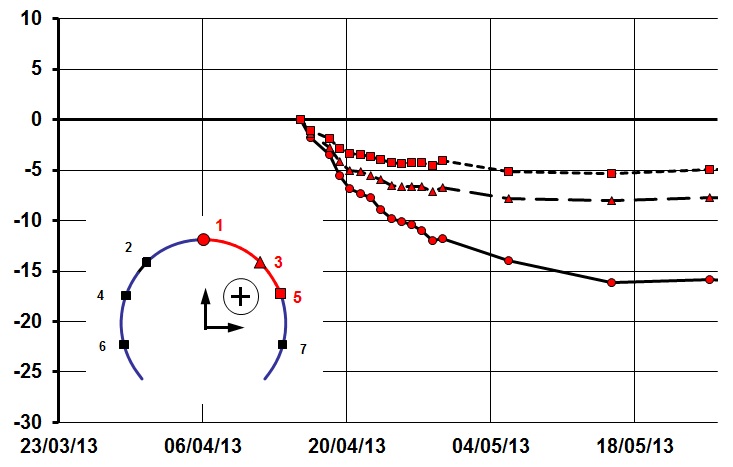
Figure 10 – Ch.41 vertical displacements points 1, 3, 5 (PTW-E EL, WHI). Points 2, 4, 6, and 7 are not shown for the sake of clarity. Negative displacements = settlement.
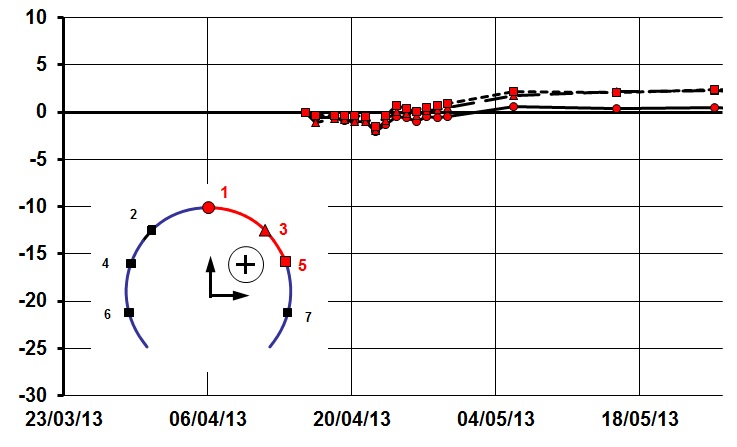
Figure 11 – Ch.41 horizontal displacements points 1, 3, 5 (PTW-E EL WHI). Positive displacements = divergence.
Utilisation analysis Ch. 38 and Ch. 41, PTW-E EL
The Utilisation versus time at Ch. 38 is shown in Figure 12. The thin red line shows the extrados of the lining, the thick red line the intrados. Both lines, intrados and extrados are close together, that means the bending moment is very small and the lining is almost only affected by normal force. The slight “zigzag” of the lines is the variation due to monitoring accuracy.
The Utilisation up to the time of the temporary stop is very small, less than 10 %. This is due to the fact that only a small amount of deformation and hence strain occurred to that time. In combination with the creeping behaviour to the young shotcrete the stress level did not rise. After restart of excavation an increase of Utilisation is visible up to ca. 15 % which reaches finally 20 %. This increase is not as huge as one would might expect, because the increase of differential movements which would generate strain is minor; half of the displacement is whole body movement. Another reason is that the lining has still some ability of creeping; ca. 2 ½ weeks of age at that time, and it had gained a lot more strength.
In conclusion, the lining has 20 % of its bearing capacity, thus the actual factor of safety is 5.
At Ch. 41 (Figure 13) the Utilisation is admittedly not impressive either: less than 10 % all the way through. The stress due to deformation is compensated by creeping and gaining of strength.
There was some uncertainty as to which extent the compensation grouting would have an adverse effect on the sprayed concrete lining. By the way, this was the reason why the monitoring arrays were installed so close together. In addition, there was this temporary stop which usually generates higher stress in the lining. Utilisation provides the proof of the actual state of stress, in this case a very low state.
This analysis is limited to just one section of the sprayed concrete lining: the right shoulder between points 1–3–5. Other sections of the lining could have a different same state of stress due to asymmetrical loading or geometry. However, the other section at Ch. 38 and Ch. 41 show a similar low Utilisation.
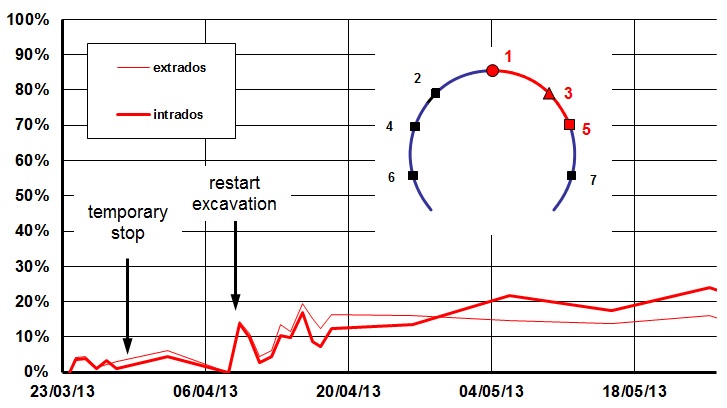
Figure 12 – Ch.38 Utilisation of sprayed concrete, section between points 1–3–5
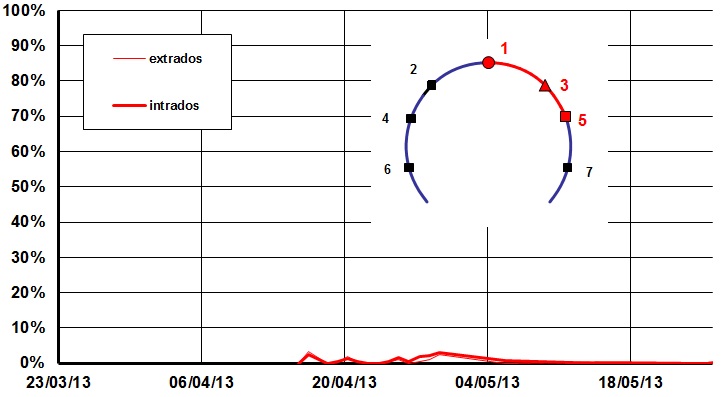
Figure 13 – Ch.41 Utilisation of sprayed concrete, section between points 1–3–5
Summary and conclusion
Utilisation is the determination of the actual state of stress in the sprayed concrete lining. It is defined as the ratio of actual stress and permissible stress. Utilisation has been applied for the first time in the UK at the SCL works at Crossrail C510, Liverpool Street Station and Whitechapel Station.
This paper described how Utilisation has been calibrated to the project specific requirements at C510 and it lead through the different steps of calculation. A case history has been given for C510’s Platform Tunnel Westbound at Whitechapel Station.
There are still difficulties during design state to allow for the time dependent behaviour of the sprayed concrete. Also, the effect of compensation grouting on the sprayed concrete lining is difficult to address in the design stage. In this case history a temporary stop happened for nearly 2 weeks, the effects of which on the stress in the lining after recommencement of excavation is also difficult to predict with the design. With the help of Utilisation the stress state in the lining could be calculated and sufficient stability could be confirmed.
Utilisation is a mean to calculate the actual state of stress in real time and to provide the actual factor of safety in the sprayed concrete lining. It should be used along with all the other common tools of assessing stability, e.g. the time-displacement graphs, vectorial graphs.
As with all methods of assessing in-tunnel conditions, Utilisation has to rely on good monitoring data. The monitoring accuracy of in-tunnel displacement measurements should not exceed ±1 mm.
A limiting factor is various layers of sprayed concrete applied at different times, e.g. the thickenings around openings for cross passages. In these cases assumptions have to be made which inevitably reduce the accuracy of this otherwise reliable method.
Utilisation has been proofed via in-situ testing, calculation with Flac3D, and by comparison of two different methods against each other.
References
- Zachow, R and Vavrovsky, G.M. (1995) Abschätzung der Auslastung des Spritzbetons mit Hilfe geotechnischer Messungen. Felsbau 13 (1995) Nr. 6 – VGE Verlag
- Rokahr, R.B. and Zachow, R. (1997) Ein neues Verfahren zur täglichen Kontrolle der Auslastung einer Spritzbetonschale. Felsbau 15 (1997) Nr. 6 – VGE Verlag
- Rokahr, R.B. and Zachow, R. (2004) Berechnung des Auslastungsgrades einer Spritzbetonschale. Leibniz University of Hanover, Institute for Geotechnic, Department Underground Construction, Hanover, Germany
- Rokahr, R.B., Zachow, R. and Zander-Schiebenhöfer, D. (2005) Calculation of the stress intensity index of a sprayed concrete lining. Proceedings of Underground Space in Use: Analysis of the Past and Lessons for the Future – Erdem & Solak (eds) – Taylor & Francis Group
- Zachow, R. and Rokahr, R.B. (2009) Vergleich der Wiener Methode und dem Verfahren IUB zur Bestimmung des Auslastungsgrades in der Spritzbetonschale am Beispiel des Lainzer Tunnels – Baulos LT31. Leibniz University of Hanover, Institute for Geotechnic, Department Underground Construction, Hanover, Germany – Unpublished
- Brandtner, M., Moritz, B. and Schubert P (2007) On the Challenge of Evaluating Stresses in a Shotcrete Lining. Felsbau 25 (2007) Nr. 5 – VGE Verlag
- Moritz, B., Brandtner, M. (2009) Yet Another Way of Calculating Stresses in a Shotcrete Lining. Proceedings of Shotcrete for Underground Support XI – Amberg,& Garshol (eds), ECI Symposium Series, Volume P11 (2009)
- CEB-FIB (1993) Model Code 1990. Comité Euro-Internacional du Béton (CEB) and International Federation for Structural Concrete (FIB)
- Weber, J.W. (1997) Empirische Formeln zur Beschreibung der Festigkeitsentwicklung und des E-Moduls von Beton. Beton- und Fertigteiltechnik, Heft 12, 1997
- Crossrail (2012) Section KT20 Materials and Workmanship Specification, Sprayed Concrete Lining. Appendix 5: C510 SCL Performance Requirements. Doc No: C121-MMD-Z4-RSP-CR001-50005 Rev 1.0, 10.09.2012
- Wierig, H.J. (1968) Eigenschaften von „grünen, jungen“ Beton. beton (1968), Heft 3, 1968.
- Khan, A., Cook, W., Mitchel, D. (1995) Early Age Compressive Stress-Strain Properties of Low‑, Medium‑ and High‑Strength Concretes. ACI Journal, Vol. 92, 1995.
- Xianju, J. and Zongjin, L (2000) Investigation of Mechanical Properties of Young Concrete. Materials and Structures, Vol. 33, 2000.
- Fröhlich, B (1998) Durchführung von Spannungsmessungen nach dem Kompensationsverfahren in der Spritzbetonschale des Eggetunnels, ABS Kassel – Paderborn. gbm – Gesellschaf. für Baugeologie und -messtechnik mbH, Ettlingen.
- RSK (2013) Creep & Drying Shrinkage Testing of Sprayed Concrete at ages 1 to 15 days. Report 286141-01(01) for BBMV C510 JV at Crossrail – Unpublished
- Chapman, D., Metje, N. and Stärk, A. (2010) Introduction to Tunnel Construction. Applied Geomechanics Volume 3, Taylor & Francis Group, ISBN-9 780 415 468 428
- Eddie, C. and Neumann, C. (2003) LaserShell™ leads the way for SCL tunnels. Tunnels and Tunnelling, June 2003, 38 – 42.
- Eddie, C. and Neumann, C. (2004) Development of LaserShell™ Method of Tunneling. Proceedings of the North American Tunneling Conference 2004, Atlanta. Pub. Balkema, Rotterdam.
- BBMV JV Crossrail C510 (Balfour Beatty, BeMo Tunnelling, Morgan Sindall, Vinci Construction Grands Projets) Monitoring data 2011 – 2014.
-
Authors

Dr Alfred Stärk Dipl Ing Dr Ing - BeMo Tunnelling
Dr Alfred Stärk is Chief Geotechnical Engineer and Engineering Manager at BBMV for Crossrail Contract 510 ‘Whitechapel and Liverpool Street Station Tunnels’ since March of 2011. He started his career at the University of Hanover, Germany, where he worked as assistant professor and consultant for 10 years. In 2002 he joined BeMo Tunnelling, Innsbruck, Austria. He now has 25 years of experience in large-scale tunnelling, mainly with sprayed concrete lining in soft ground.

