TBM View – Real-Time Continuous TBM Parameters Trend Monitoring
Document
type: Technical Paper
Author:
Hassan Armand, Graduate Diploma Computer and Business Studies, Keith Nicholson BSc C.Eng M.I.C.E M.I.Mech.E, ICE Publishing
Publication
Date: 31/08/2016
-
Read the full document
Notations
SRG Shift Review Group
TBM Tunnel Boring Machine
EPBM Earth Pressure Balance Mode
kN Kilo Newton
rpm Rotation Per Minute
mm/rev Millimetres per revolution
1:1 Ratio
CH CutterheadIntroduction
Effective analysis of a TBM performance and projection of its parameters requires accurate and timely data acquisition and validation within an effective period; furthermore the system has to be flexible and dynamically customisable in look and feel to adopt to changes in target TBM parameters while allowing the operator to exercise full control when it is needed.
To achieve this, first during each shove the captured data has to be analysed in real time in a way that the cause and effects of events are identified and presented quantitatively in a simple and clear manner showing current status and their projection. Data need to be presented numerically and graphically showing trends and applying traffic light alert mechanism based on predefined critical trigger levels and target TBM parameters. In this way instantaneous and spot events are detected and remedial actions are triggered.
Secondly the event escalations and trends are required also to be presented continually across multiple shoves for detection of performance degradations before total failures. Values of critical parameters are required to be correlated and shown across longer timelines covering multiple shifts, at least a full 24 hour shift pattern, enabling monitoring of behavioural, operational and comparison of parameters over multiple shoves and/or for different values. In this way control room engineers and TBM crews are presented with instantaneous and in-depth information for on spot decisions for achieving optimum performance and safe tunnelling. Issues that cannot be resolved are documented using on spot report snap shots and passed on to senior and specialised engineers or SRG meetings for further study and expert advice.
The TBM View system was developed as a bespoke solution specifically for Crossrail Contract C305 system to be used over the duration of the tunnelling works.
From outset the TBMView role has to be one of supervisory, so it should be also able to identify the sources of external events that are outside TBM parameters, along the TBM gantry and also along the built tunnels. These events directly or indirectly can affect the TBM’s performance and status. They include data networks and auxiliary systems failures, surface instrumentation monitoring and water and grout plant alerts, HAC and spoil conveyer and environmental systems events. TBMView isolates such systems and reports the failures to control room and/or designated support personal for remedial actions.
The TBMView approach provides for resilience and fault tolerance systems and network solution enabling 24/7 availability and reliability.
In summary TBMView is a total solution that maximises both tunnelling efficiency and safety. More than a software tool it is a comprehensive top-down process solution to allow engineers to exercise a high level of control over operations to deliver more efficient, cost effective and safer tunnelling.
1.0 Control and Verification of TBM Excavation Parameters
The parameters are generated and managed by TBM Parameters and Instruction Manager, a utility application shown in Fig.1.
The instruction applies to one or more successive rings; it dynamically customises the system for each ring. At start of excavation it applies the pre-determined parameters to that ring and recalculates the triggering levels for all parameters. The Triggering levels are explained in the following sections.
If there is no instruction sheet for a particular ring TBMView will for the first time use the last ring’s instruction but for the following ring it generates an exception alert reporting the failure.
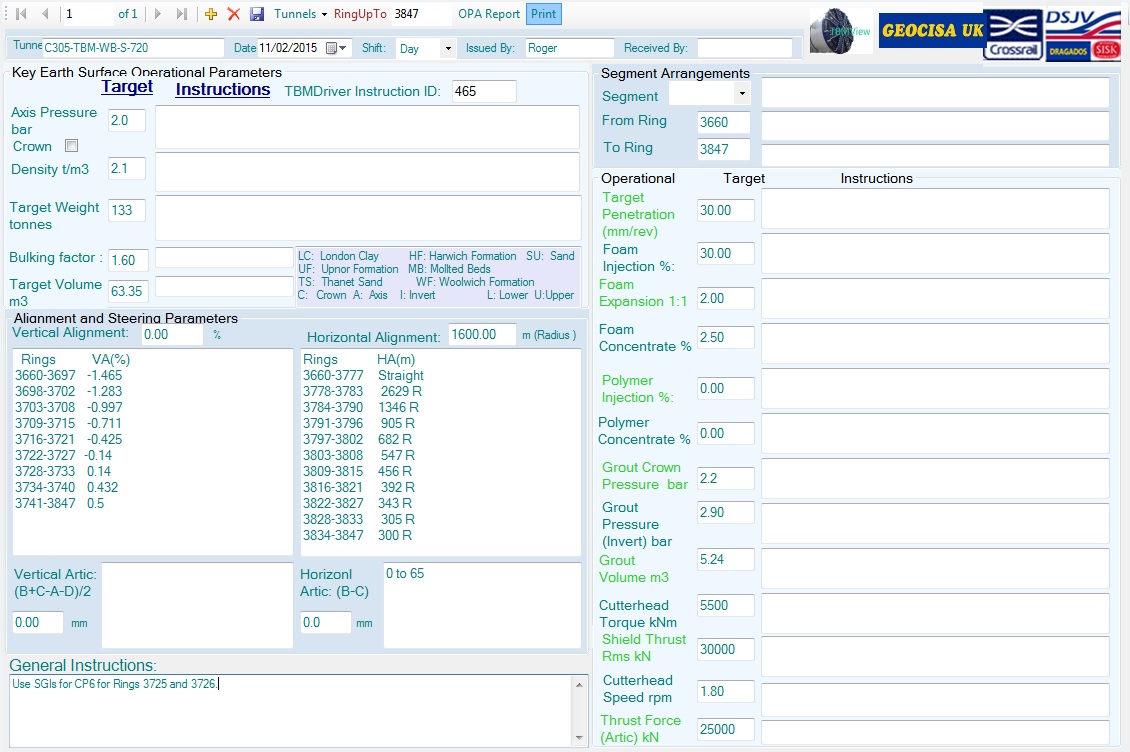
Figure 1 – TBM Parameters and Instruction Manager 1.1 Operational Systems instructions
This section covers the main system operating parameters and gives guidance on these parameters in order to show how it optimises production. The following systems and values are included:-
1.1.1 Earth Excavation Parameters
- Face Earth Pressure (bar)
- Face In situ Density (t/m3)
- Target Shove Weight (tonne)
- Target Shove Volume (m3)
- Target Bulking Factor (1:1)
This section details the target axis level face pressure for operation, the assumed face density for the section of tunnel and target weight per ring. It also includes the input bulking factor and target excavation volume for each ring. The input density has to be set correctly on the TBM, whilst both the target density and the material bulking factor are automatically configured in the data acquisition on preparation of the Instruction Sheet.
1.1.2 Operational Parameters
- Shield thrust (kN) (total thrust from shove rams)
- Cutter head thrust (kN ) (total thrust through articulation)
- Penetration (mm/rev )(Advance rate / cutter head speed in rpm)
- Cutter head torque (kNm)
Each parameter can have specific instructions attached as required in addition to the numerical value.
1.1.3 Conditioning Parameters:-
- Foam solution concentration %)
- Foam solution concentration (%)
- Foam Expansion Ratio (FER) (%)
- Foam Injection Ratio (FIR) (1:1)required in automatic mode only
- Polymer concentration (%)
- Polymer injection Ratio (%)
1.1.4 Grouting Parameters
- Target grout injection volume(m3)
- Grout injection pressure crown ports (bar)
- Grout injection pressure invert ports (bar)
1.1.5 Alignment and Steering Parameters
- Vertical Alignment ( % Gradient +/-)
- Horizontal Alignment (m Radius)
- Vertical Articulation (mm)
- Horizontal Articulation (mm)
This section is designed to give operators both details of the tunnel vertical and horizontal alignment and to give guidance on the appropriate setting for the vertical and horizontal articulation of the shield.
The articulation values are detailed via the extension of measuring cylinders in groups A, B, C and D.
The horizontal articulation settings are detailed via the differences between the right and left hand side of articulation ram extensions.
- (A – D) in mm is the difference between the upper ram groups
- (B – C) in mm is the difference between the lower ram groups
Positive values are for left hand curves and negative values are for right hand curves.
The vertical articulation settings are given by difference between the mean upper and lower ram group extensions this is given as:
(B – C)/2 – (A-D)/2 in mm is the mean difference between the top and bottom ram groups.
2.0 Ring Excavation Sheets
The ring excavation sheets deal with the excavation parameters during the course of each individual excavation and are divided into 12 correlated charts contains multiple graphs (See Fig 2) of key parameters plus tabulated values which are discussed in detail below:
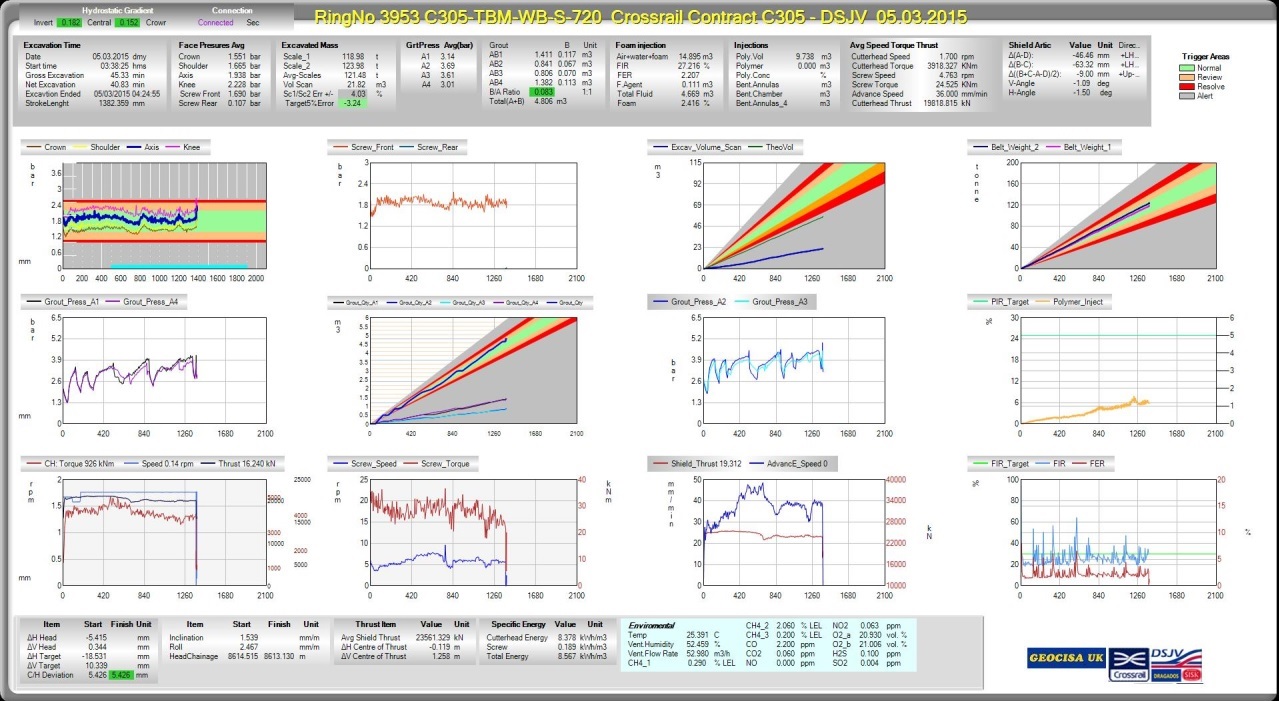
Figure 2 – Correlated Real Time Excavation Charts and Triggering Levels 2.1 Settlement Monitoring
For an EPB TBM one can group the settlements into locations relative to TBM and causes as follows:
- Ground relaxation in front of excavation
- Collapse at cutterhead
- Relaxation around shield body
- Settlement over the grout annulus
- Settlement during standing times and interventions
- Settlement due to exceptional ground conditions
- Ground heave due to over pressurisation of the ground
In the EBP technique the TBM stabilises the tunnel face by pressurising excavated ground in its chamber as a supporting medium. The TBM is designed to work with a cutter head chamber full of conditioned spoil that exerts a pre-defined pressure on the advancing face.
The required support pressure is achieved through:
- Thrusting the shield forward – by means of hydraulic jacks – against the soil mass (force equilibrium)
- Regulation of the screw conveyor-rotation (volume equilibrium)
The support pressure has to balance the existing earth and the water pressures.
The pressure is regulated by the TBM operator through the control of the TBM advance rate and the screw extraction rate. Theoretically it should be possible for a good TBM operator to adjust the screw speed and the shove pressures to give an almost constant face pressure during the excavation stroke.
2.1.1 Face pressures
The operational instructions are based on Axis level pressures which are indicated by the blue trace on the face pressure graph. The graph actually shows the average values of the pairs of sensors at Crown, Shoulder, Axis and Knee levels plotted against the excavation stroke as mining continues Fig .3.
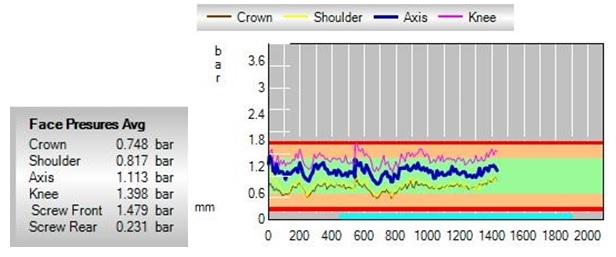
Figure 3 – Cutterhead Chamber Earth Pressures The first thing to note is that the actual pressure should be theoretically constant. The operator tries to balance the shield advance rate against the screw extraction rate to give this constant pressure. It is the skill of the operator that defines the fluctuation of this pressure above and below the required pressure.
The figures 4 and 5 below indicate the variability of this.
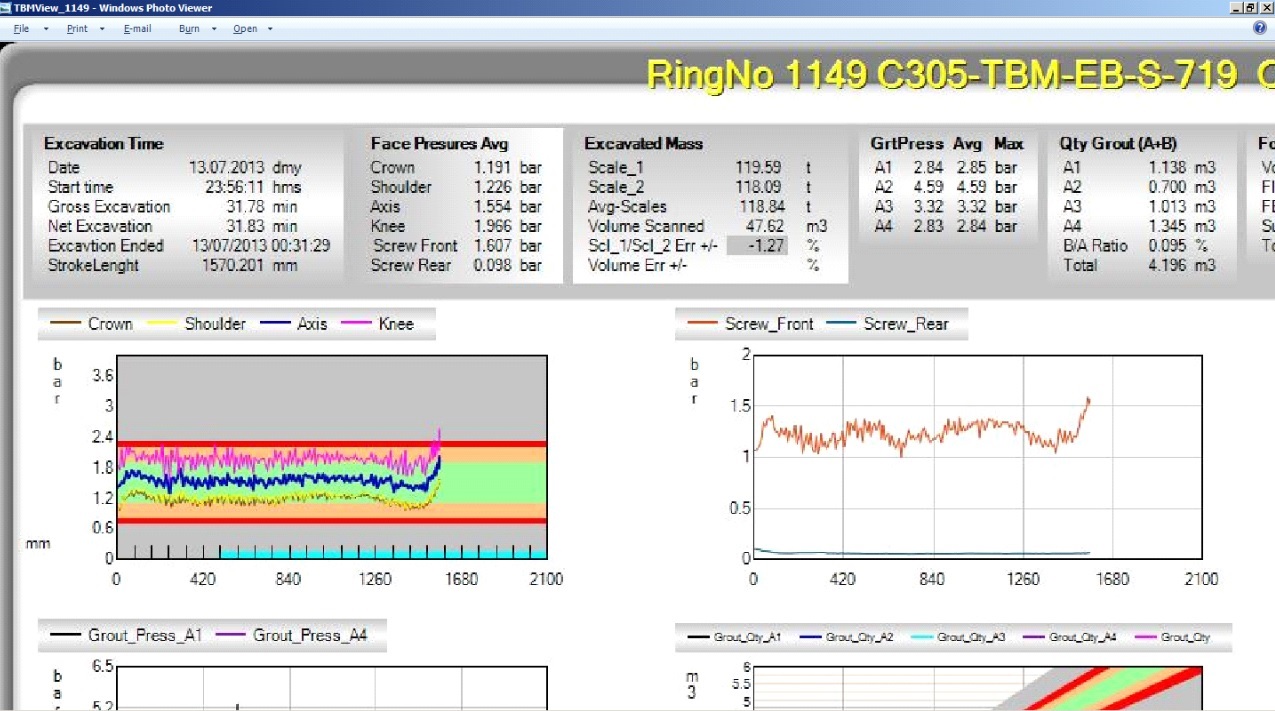
Figure 4 – Face Pressure Regulation “A” 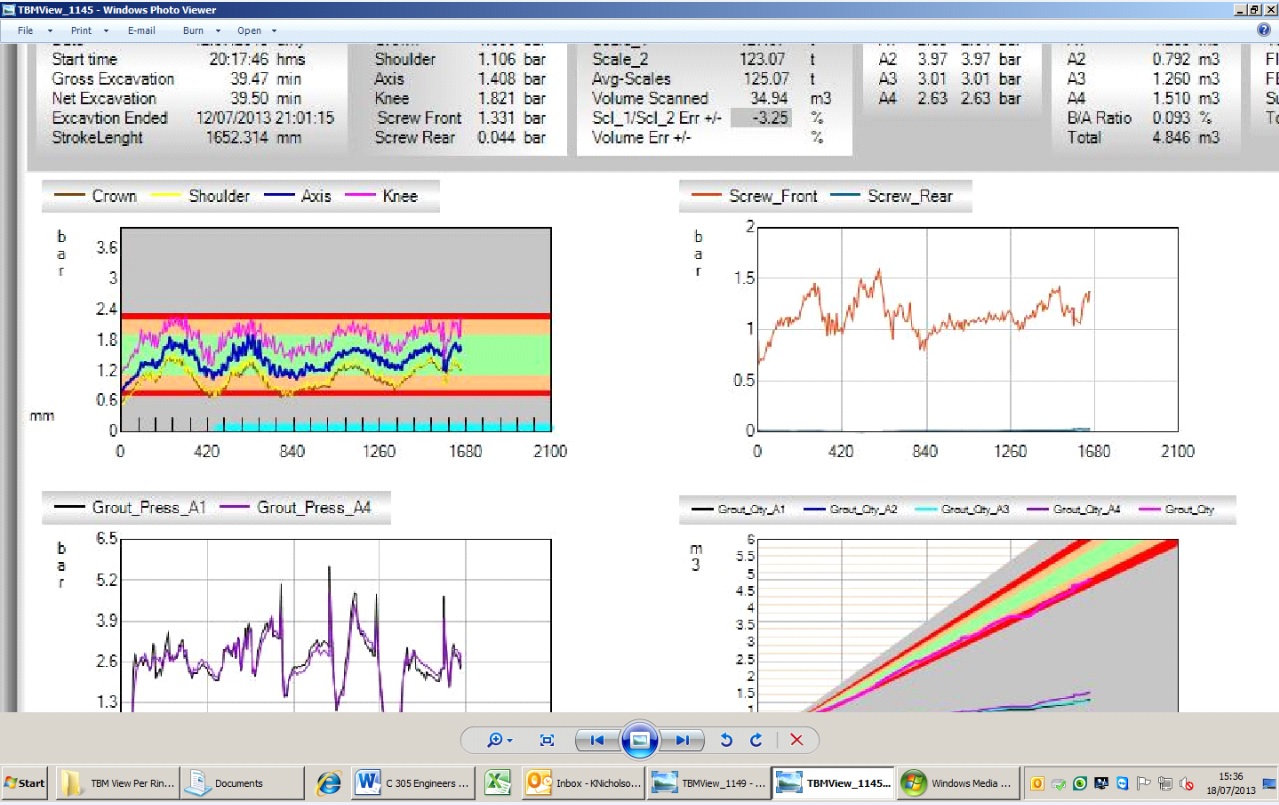
Figure 5 – Face Pressure Regulation “B” The second important indication that can be derived from these graphs is the degree of filling of the cutter head. In theory our intention is to keep the cutter head completely filled at all times. The actual manifestation of this can be seen in the spread of the face pressure readings between the various levels of sensors. Examples of this are shown in figures 6 and 7.
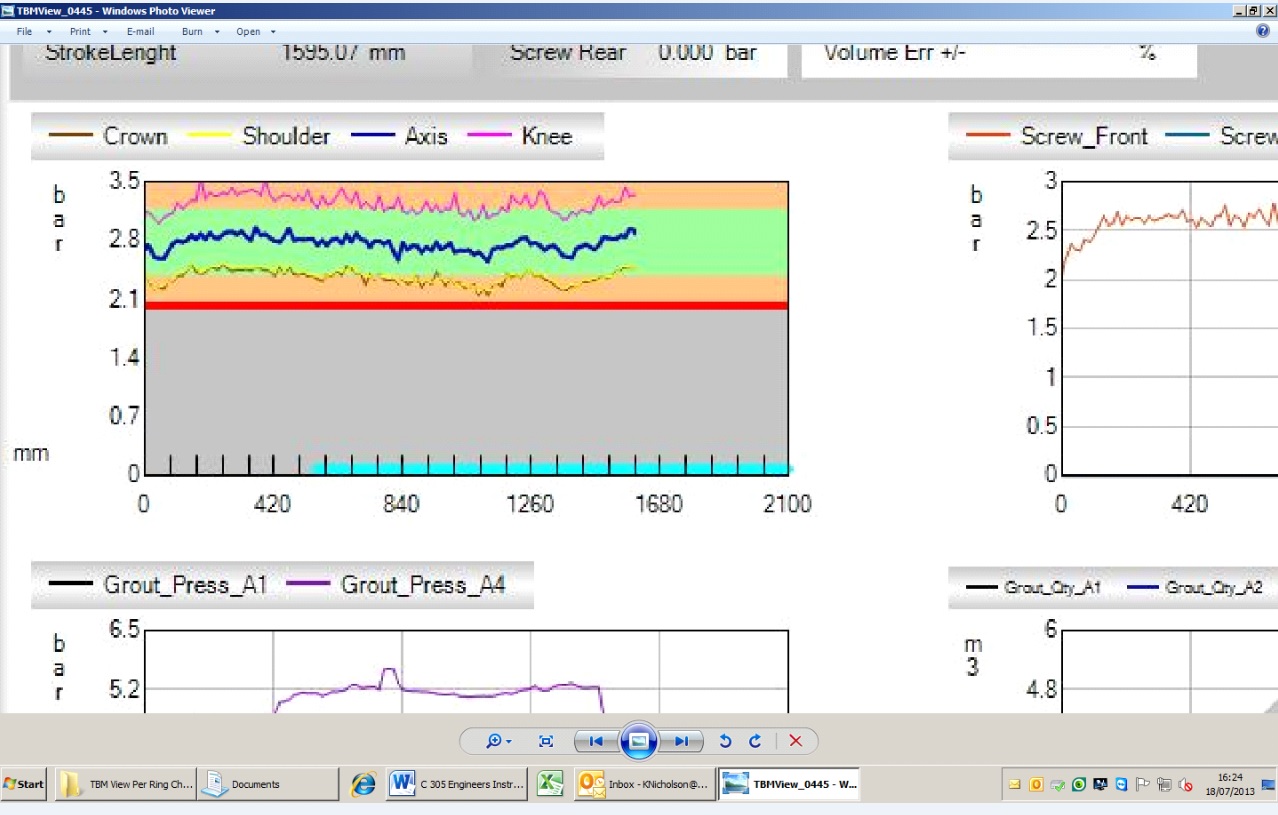
Figure 6 – Cutter Head full to within about 1.0m of crown 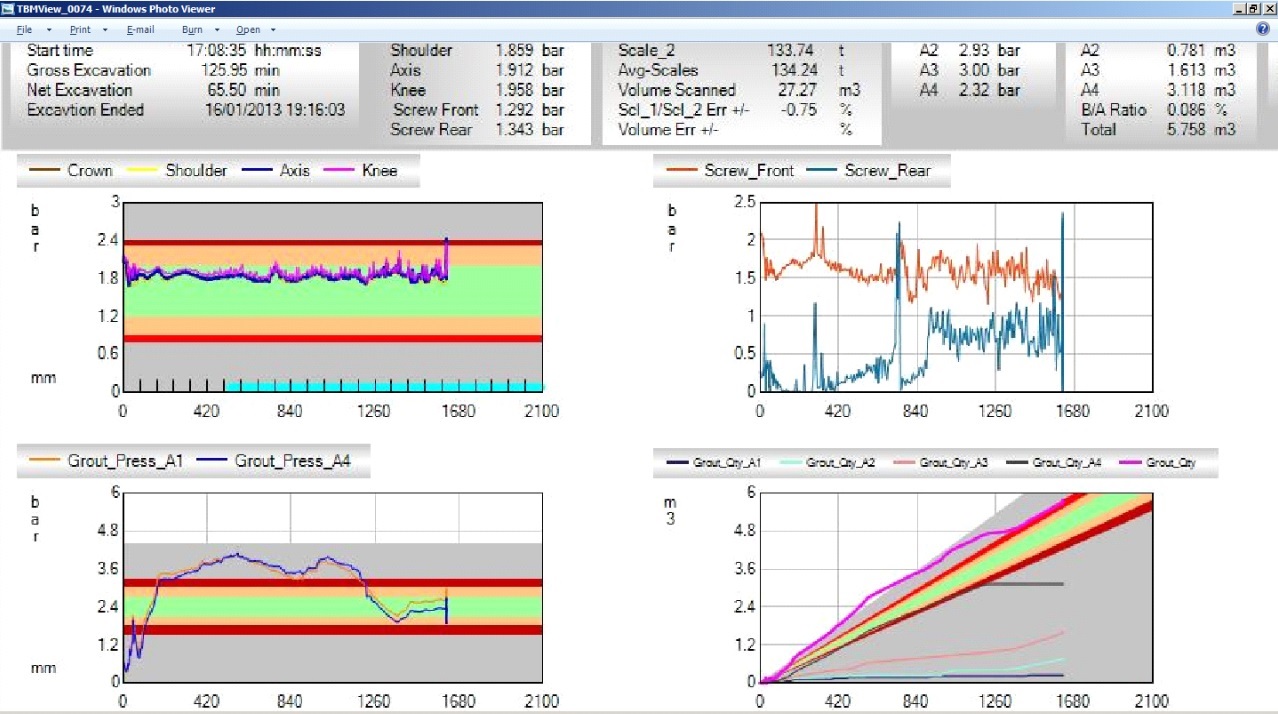
Figure 7 – Cutter Head Close to Empty In assessing these graphs we should note the various elevations of the sensors and the density of the material in the chamber. In general the In-situ density of the material can be taken as 2.0 tonnes/m3. The bulking factor can vary from about 1.25 to say 1.75, depending upon the conditioning regime being used.
In this example this would lead to the following possible spread of readings:-
Sensors TBM Actual Height to Axis (m) Differential (bar) Bulking Factor 1.25 1.5 1.75 Density(t/m3) 1.60 1.33 1.14 Crown + 2.82 (4.52) 0.723 0.601 0.515 Shoulder + 1.70 (3.40) 0.544 0.452 0.388 Axis – 0.09 (1.61) 0.258 0.214 0.184 Knee – 1.70 (0) 0 0 0 Figure 8 – Differential Pressures above the knee level sensor
The Fig 8 table gives differential pressures above the knee level sensor. In general we should be looking for two things:-
Firstly the spread of face pressures should be in the region of 0.6 to 0.7 bar between the knee level and crown level sensors. This is best checked by looking at both the actual chart and the tabulated average values. Secondly we should have a differential pressure existing between the crown and shoulder level sensors. Where they are concurrent we know that we have compressed air only to a depth of 1.12m below the crown, which is unacceptable.
It should also be noted that the actual pressures in pairs of sensors at the same level are sensitive to the direction of rotation of the cutter head. This is the result of the action of the cutter head that will tend to compact the area in front of its direction of rotation and relieve pressures in its wake.
Examples of distributions of face pressures are given in figures 9 and 10 below.
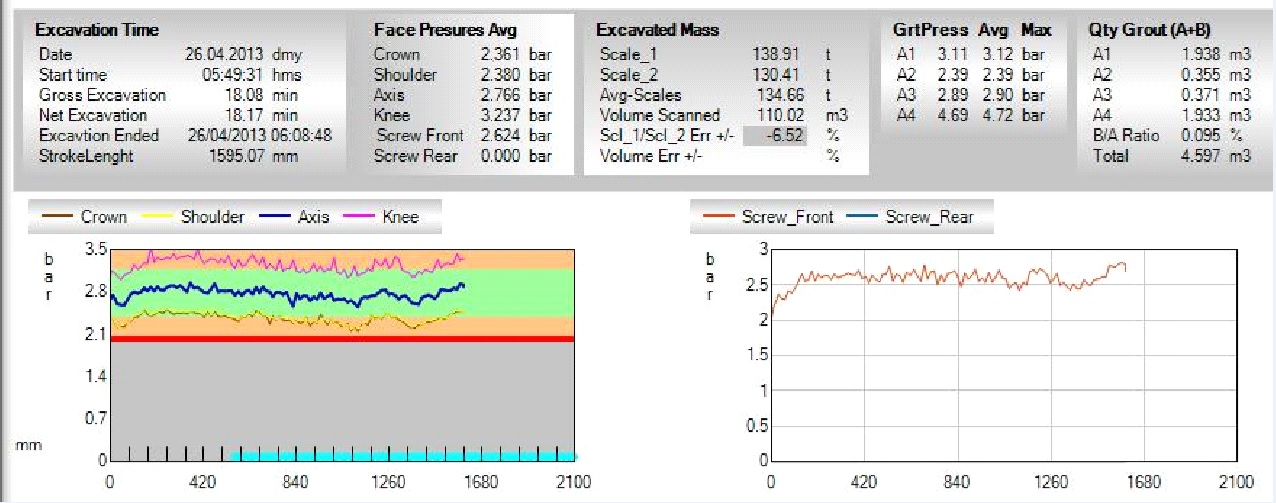
Figure 9 – Cutter head is nearly empty and discharge is being controlled by the screw gate 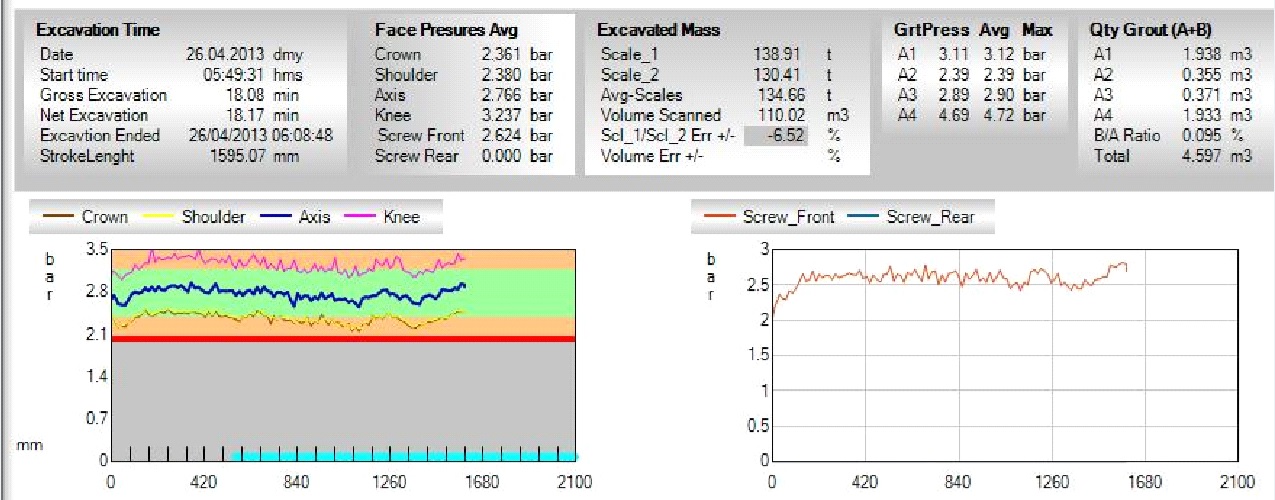
Figure 10 – Cutter head is filled to above shoulder level and pressure differential is within the screw 2.1.2 Hydrostatic Gradient
The Hydrostatic Gradient refers to differences between pressure sensor values. For CRL TBMs it is the difference between the average axis pressure and the average knee pressure divided by 1.59m (distance between Knee and Axis). This indicator is called invert and provides a traffic light triggering mechanism, the values less than 0.25 are green (normal), between 0.25 and 0.3 indicates a Amber alert and above 0.3 the indicators will report Red alerts. It is an important indicator especially in the sands and it will warn us of possible sand ingress / active face pressure.
The Same algorithms are applied to Axis and Shoulder (distance 1.8 m) calculating Central gradient and Shoulder and Crown (distance 1.1 m) calculation Crown gradient.
As mentioned the hydrostatic gradient is a good indicator or early warning, especially in sands where it tends to be higher whilst in clay conditions it can go negative which would be an indication of clogging or poor flow in the cutter head. The Fig 11 and 12 shows a red alert case where the Invert Gradient is above 0.3. An Example of Normal Gradient for multiple rings is demonstrated in Fig 13.
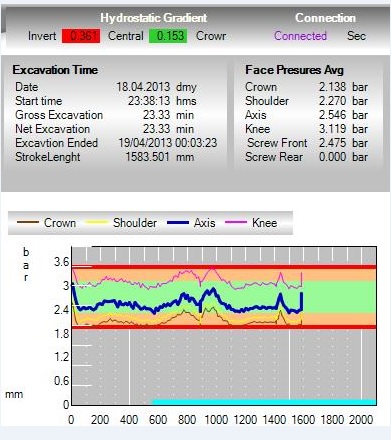
Figure 11 – Multiple Ring With Invert Gradient Above 0.3 
Figure 12 – Multiple Ring With Invert Gradient Above 0.3 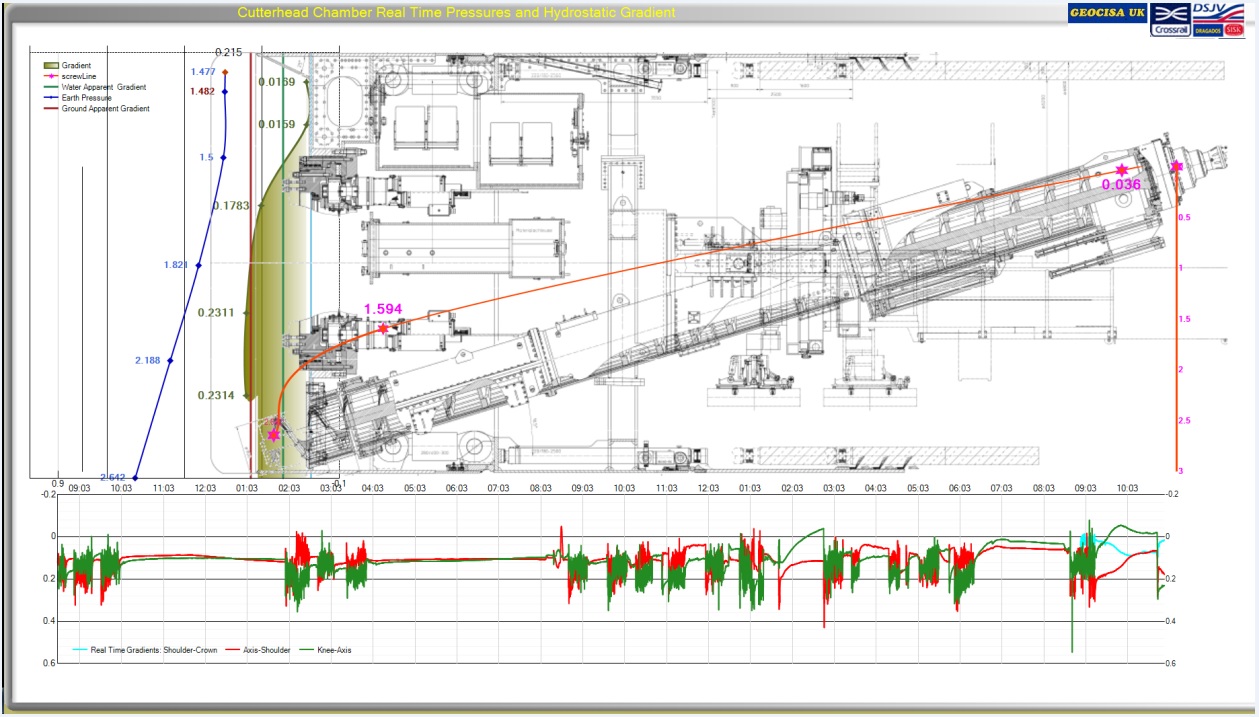
Figure 13 – Multiple Rings with Normal Chamber Invert Gradient 2.1.3 Screw Pressure
The screw pressure graph and tabulated values Fig 14 give information about the pressure gradient within the screw conveyor. The pressure at the front of the screw should reflect the knee level pressure in the chamber, whilst the rear pressure should be closer to atmospheric conditions after the discharge gate. In clay conditions there is usually a good gradient indicated, whilst in sands the rear pressure often approaches zero as the TBM operator uses the discharge gate to choke the exit flow indicating a “wet” spoil discharge.
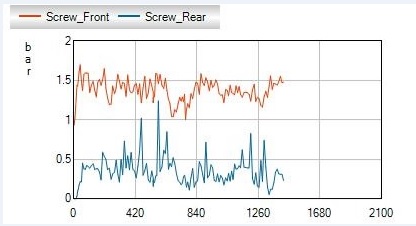
Figure 14 – Screw Pressure Graph 2.1.4 Volume Scanner
The output bulk volume scanned by the Sick laser scanner is displayed on the excavated volume graph Fig.15. As the bulking factor is variable in respect to the conditioning regime in place, the output should be taken as a guide to support the trend indicated on the belt scales graph example is shown at Fig 15. The total bulked volume excavated is indicated in tabular form. If the conditioning regime remains fairly constant then the bulking factor can also be determined through back analysis of recent rings and can then be of more use. The bulking factor has to be modified on the instruction sheets to reflect this.
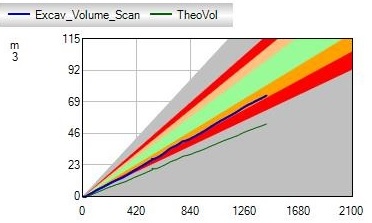
Figure 15 – Scanned Excavated Volume Graph 2.1.5 Belt Scales
The outputs from each of the two belt weighing systems are plotted in real time against the excavated stroke. The background indicates different trigger levels for action by the Control Room Engineer. The outputs from the two systems should agree to within +/- 3.5% otherwise they should be recalibrated. This should happen prior to excavation of subsequent rings.
The total values from each belt scales are tabulated at the top of the analysis sheet together with the average value and the percentage error between them. The error value will turn red when it is excessive and recalibration is required. The second percentage error turns red if the actual excavated tonnage value exceeds the target weight governed by agreed contractual tolerance percentage see Fig 16 .
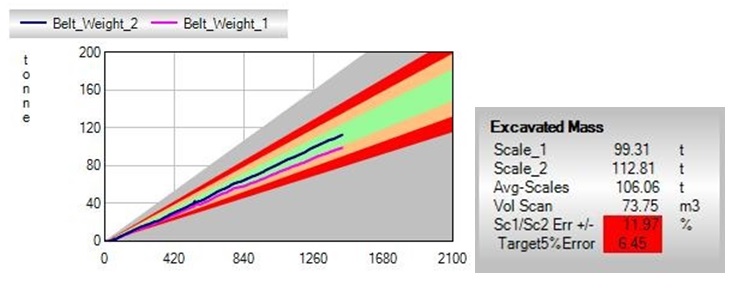
Figure 16 – Both Target Value and Scales are not valid signalled Red Figures 17and 18 show different outputs from the belt weigher graphs, whilst figures 19 and 20 show the correlation between the weighing system and the scanning system.
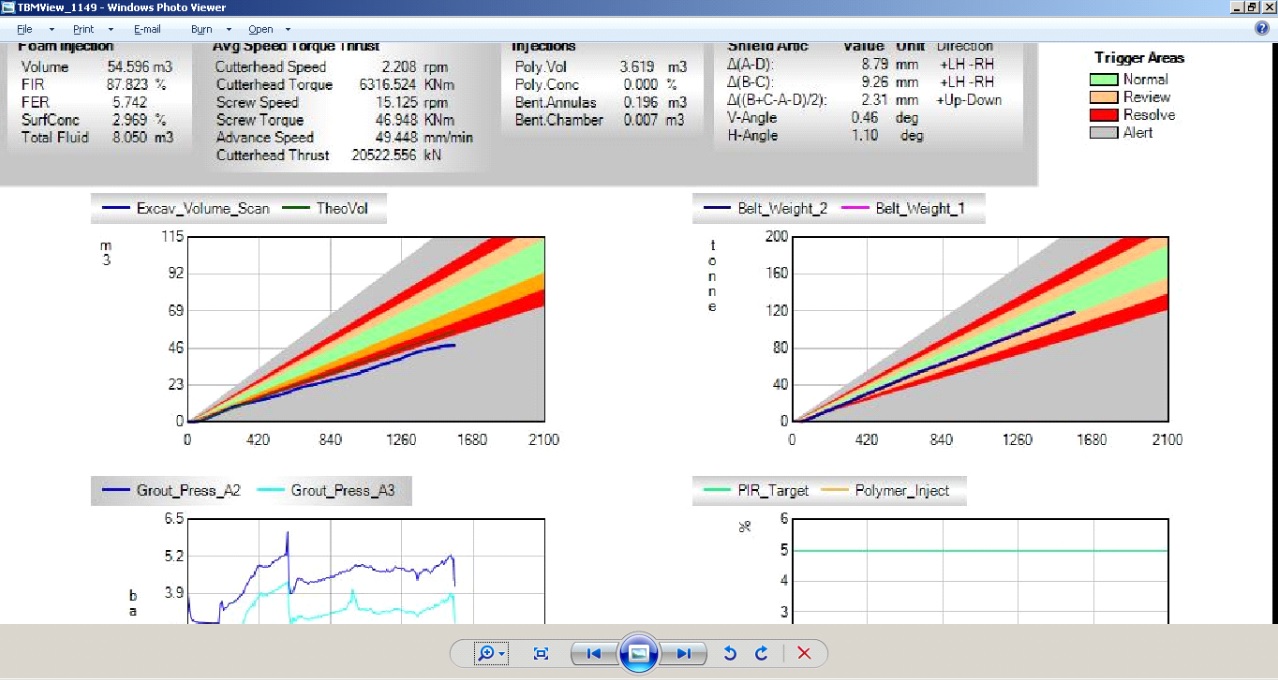
Figure 17 – Steady rate of excavation with two belt weighers in agreement 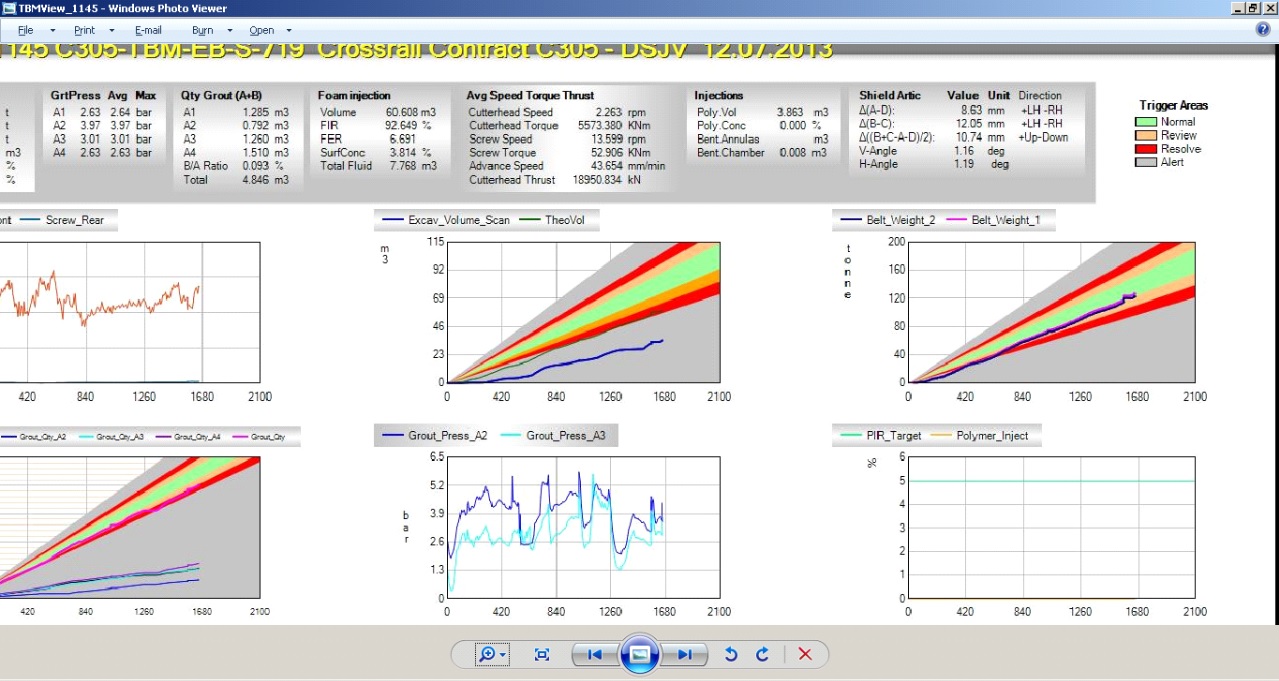
Figure 18 – Excavation weights good but scale differential readings at 3.25% 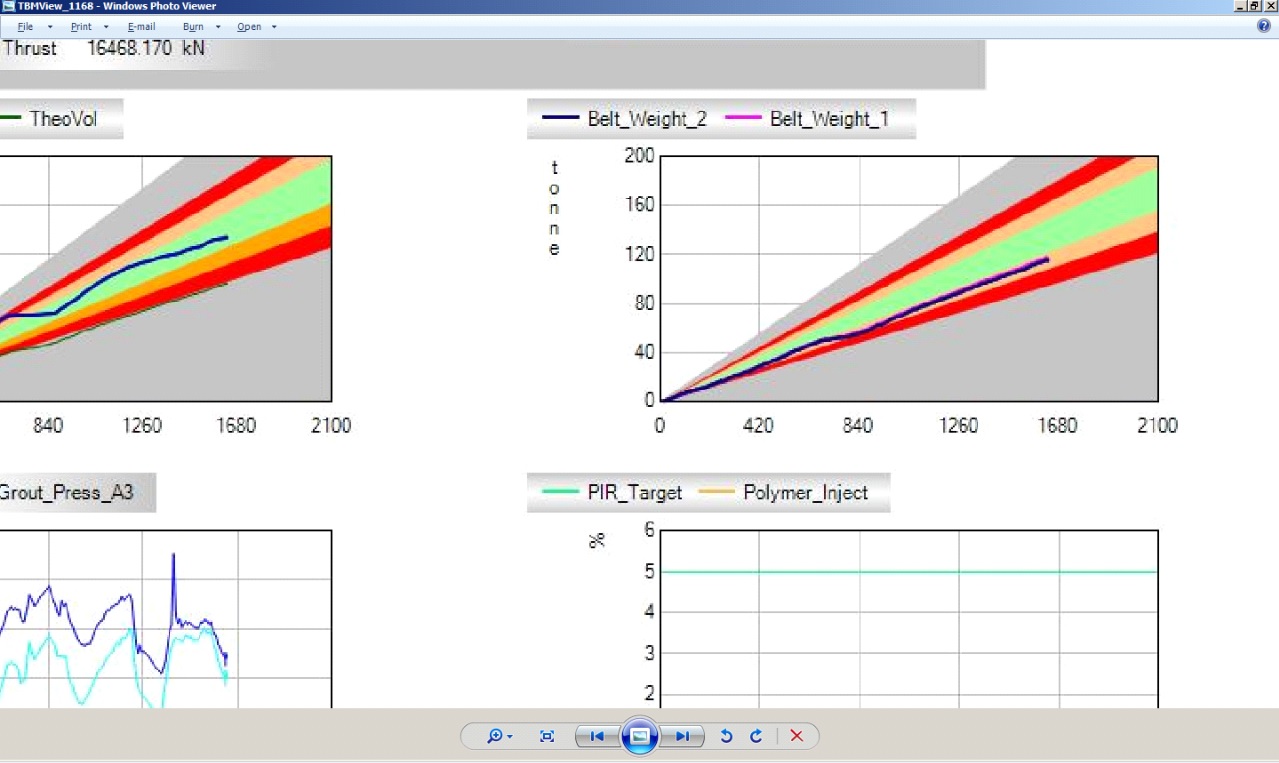
Figure 19 – Belt weigher output for ring “X” 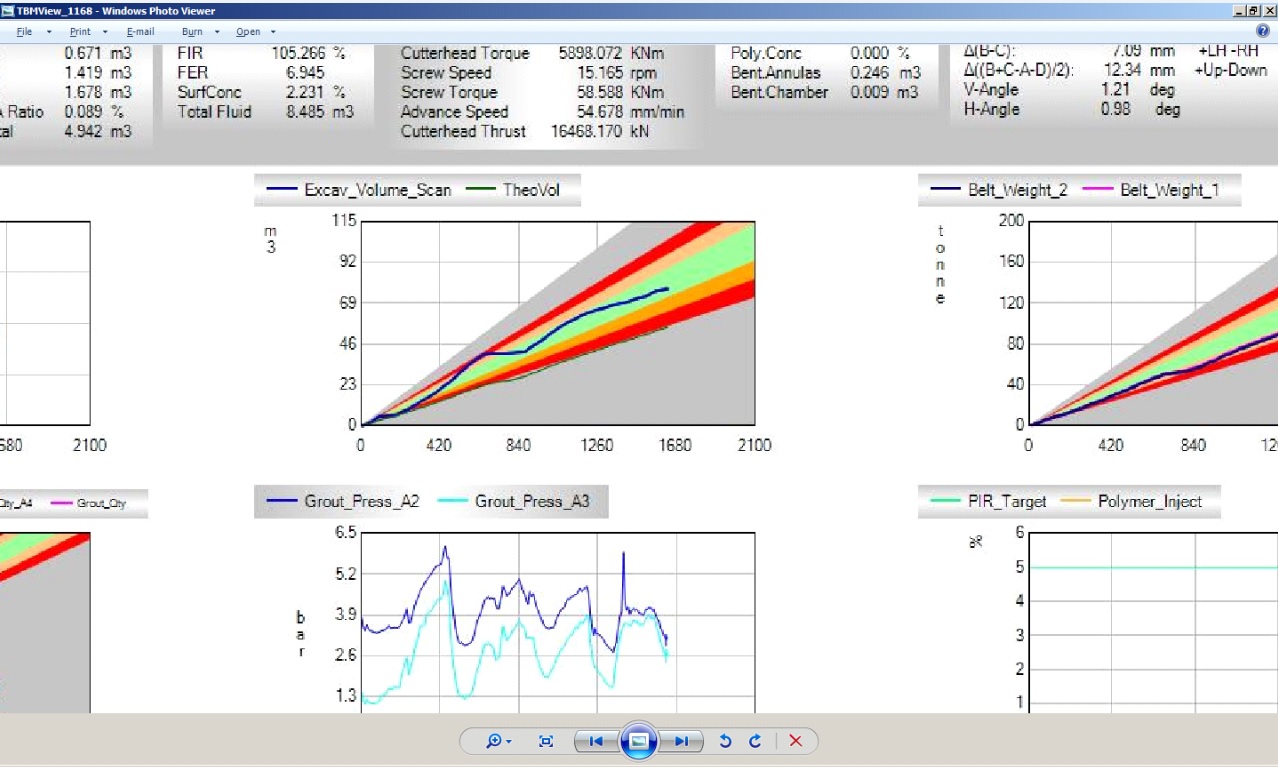
Figure 20 – Volume scanner output for ring “X” (Note shape correlation) 2.2 Grouting
2.2.1 Grout Pressure
The grouting system uses four independent systems to inject grout into four ports identified as A1, A2, A3, and A4. The lines A1 and A4 are set in the crown of the tunnel whilst A2 and A3 are set in the invert of the shield. The density of the grout is in the region of 1.25 tonnes / m3.
The actual height differential and the resultant injection pressure differential are as follows:-
Grout Ports Height to Axis (m) Height differential (m) Hydrostatic Differential (bar) A1, A4 +3.175 5.83 0.73 bar A2, A3 -2.655 0 This would indicate that we should expect the injection pressures in the invert to be approximately 0.75 bar higher than the injection pressures in the crown ports. There will also be a relationship between the grout injection pressures and the face, or operating pressure.
In fact analysis from tunnel already completed would suggest that on average:-
- Crown injection pressure at Ca. Axis Face pressure plus 1.0 bar
- Invert pressure at Ca. Axis Face pressure plus 1.8 bars
The reality is highly variable due to the degree of blockage of the tail skin ports.
The available graphs show the injection pressures in all four ports plotted against the advancing stroke length. In addition the flows in all lines are graphed and their sum is also plotted.
Analysis of completed tunnel to date would indicate that we have been injecting 50 to 66% of the grout into the crown ports and 34 to 50% through the invert ports. It should be remembered that it is the pressurisation of the annulus with grout that insures the adequacy of filling and the total volume injected is a secondary confirmation.
There are other 2 operations frequently skewing the data, first is when the operator prematurely resets the grout lines and the TBM accumulative sensors resets to zero (0) and restarts hence inaccurate volume. The second operation is when the operator flushes the lines with water during grouting which the TBM records as grout volume. In both cases TBMView algorithms ensures accurate account of component A and B.
Figures 21 and 22 indicate systems working in different stages of cleanliness.
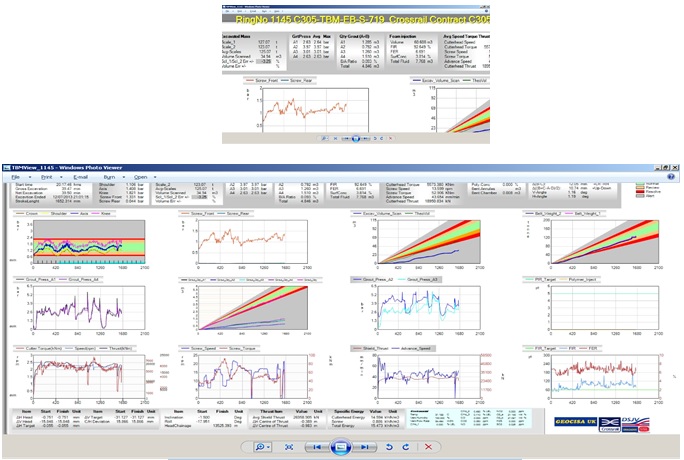
Figure 21 – Grout line A2 appears to be blocking 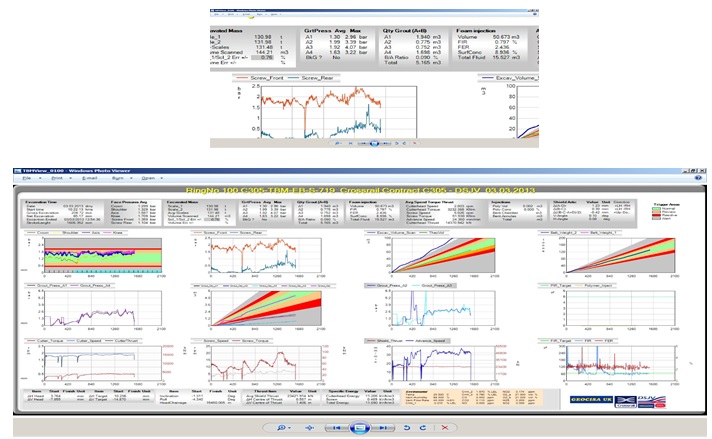
Figure 22 – Reasonably normal functioning of grout injection system The tabulated values also include the ratio of the components B/A in %. This should be between 6 and 12% or 0.06 to 0.12 as a ratio otherwise B/A ratio will trigger Red Fig.23.
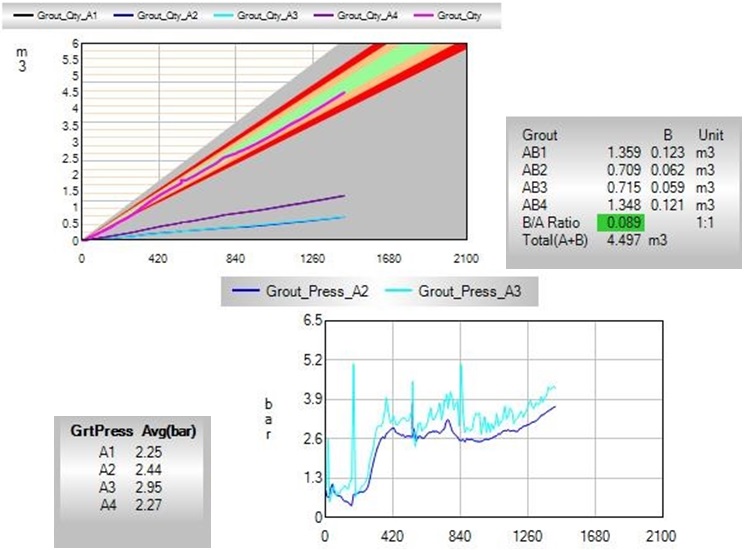
Figure 23 – Ratio of components B/A 2.3 TBM forces
2.3.1 Cutter Head Forces
The cutter head torque (kNm), speed (rpm) and thrust (kNm) are all displayed together on a separate graph Fig.24. The cutter head speed is variable from 0 to 3.19 rpm and is generally set to a constant and appropriate value by the TBM Operator. In general low speed / high torque operation is appropriate to sticky clay conditions, whilst higher speed / lower torque operations are more appropriate to non-cohesive ground conditions.
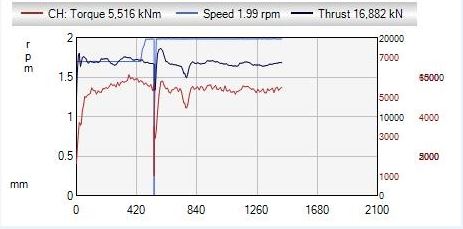
Figure 24 – Cutter head torque and speed The tabular values for these parameters are the ring averages and are included at the top of the analysis sheet.
2.3.2 Screw speed and torque
The instantaneous operating speed and torque of the screw conveyor are displayed graphically for information Fig.25. The maximum screw speed is 22 rpm and is set and adjusted by the operator to control the TBM face pressure. The screw torque has a maximum value of 195kNm and should also remain sensibly constant. It is however dependent upon the conditioning being carried out.
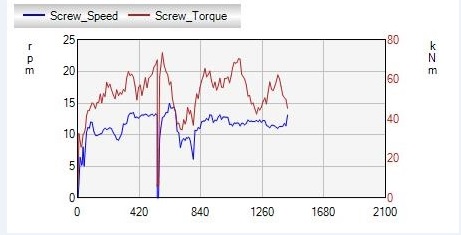
Figure 25 – Screw speed and torque 2.3.3 Shield Thrust and advance Speed
For information the shield thrust (kN) and advance speed (mm/min) are shown in Fig. 26. The shield thrust is the total thrust developed in the shield shove rams.
The maximum excavation rate is approximately 100mm/minute and is given by the hydraulic configuration of the thrust system. The maximum thrust force at 350 bar pressure is actually 58500kN but this should not normally be required. It is limited by the Operators instruction sheet and is generally limited to 35000kN.
The average advance speed and thrust throughout the ring are included on the top of the analysis sheet.
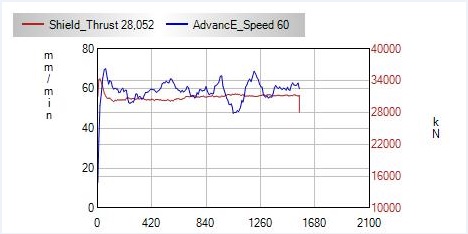
Figure 26 – Shield thrust and advance speed 2.4 Cutter Head Chamber Conditioning
The principal parameter of the foam system is indicated on a graph plotting both FIR and FER as the excavation stroke continues. The FIR is the percentage of foam injected at the face pressure compared with the actual excavated volume, whilst the FER is the ratio of foam produced to the volume of foaming solution used and is a pure ratio. Generally the FIR will be in the region of 20 to 100% whilst the FER will be between 1 and 20.
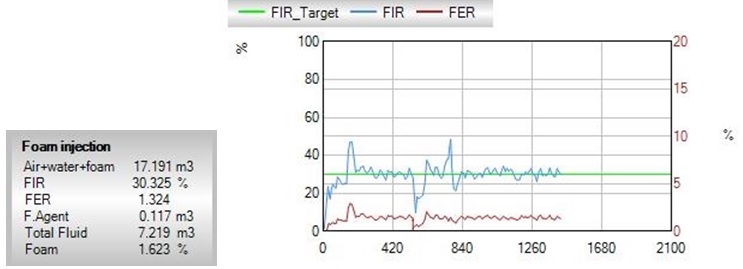
Figure 27 – Cutter head chamber foam parameters The total volume of foam injected, FER, FIR, Surfactant concentration used and the total fluid added are included as tabulated data. It should be noted that when fluid is added as a Polymer then the real fluid addition for moisture content purposes is the sum of the foam fluid and Polymer fluid additions. The conditioning of the spoil is critical for transport by sea and it should be remembered that the sandy material is more sensitive to added moisture in this respect.
2.5 Alignment and Steering
In addition to the graphs on the analysis sheet there is a tabulated section Fig.28 giving the current state of the articulation of the shield. This describes the horizontal and vertical articulation of the TBM in terms of the group ram extensions A, B, C, and D as described above. These values should be kept close to the instructed parameters, with some discretion for the operator.
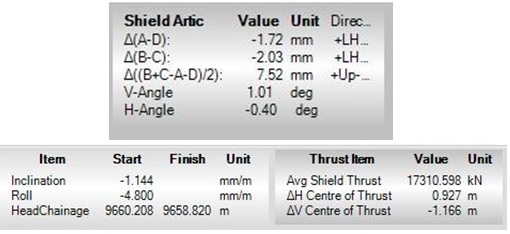
Figure 28 – Shield articulation For general information the analysis sheet includes the details of the shield chainage, roll, inclination and deviation from the correct alignment in the bottom right hand side of the analysis sheet. This can be useful in analysing the TBM operators’ motives for adjusting the shield articulation.
2.5.1 Centre of Thrust
Fig 28 shows tabulated shield average centre of thrust during the advancing. This is an average value in meters given vertically and horizontally from the shield axis. In theory this should be central on a straight tunnel drive and have low values. On curves the movement of the centre of thrust arises from the operator shoving harder in differing ram groups. It is good practice to keep the deviation from the centre as small as possible. This is accomplished by using the articulation correctly.
2.6 Specific Energies
As shown in Fig 29 the specific energies of excavation for the cutter head and screw, plus their sum are recorded on the analysis sheet. This is specifically included in order to analyse the operation of the TBM in both different ground conditions and under differing spoil conditioning regimes.
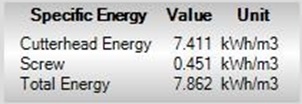
Figure 29 – Specific energy 2.7 TBM Environmental monitoring
The analysis sheet also includes a real time tabulation of the environmental parameters being recorded on the TBM Fig 30. These will alarm in the control room when 1st level and 2nd level conditions are exceeded. The alert / alarm levels are indicated by changing colours of the script on the screen.
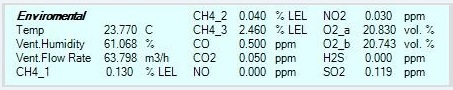
Figure 30 – TBM environmental parameters 2.8 Full Cycle and Continuous monitoring
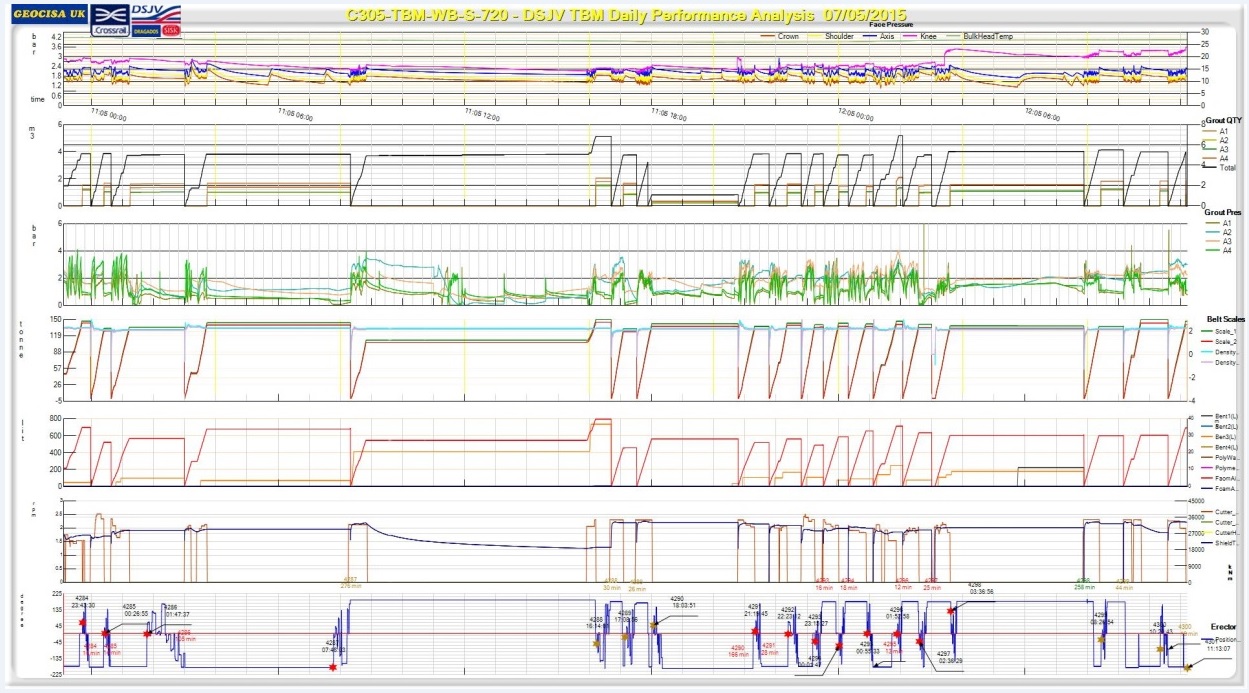
Figure 31 – Daily performance analysis sheet In addition to the ring excavation analysis sheets a set of parameters continuously monitored in real time during excavation or stoppage are displayed on the Daily Performance Analysis sheets, as shown in Fig.31. They are in themselves useful as outlined below:-
2.8.1 Continuous monitoring of face pressure
The EPB process requires the designated face pressure to be maintained at all times irrespective of whether excavation is taking place or not in order to control ground movement. The continuous monitoring shows what happens to the face pressure during ring building and other non-productive times.

Figure 32 – Continuous monitoring of face pressure 2.8.2 Continuous monitoring of grout volume and pressure
These graphs actually allow us to see how the four grouting systems are performing over a succession of rings and observe the various grout pipes blocking
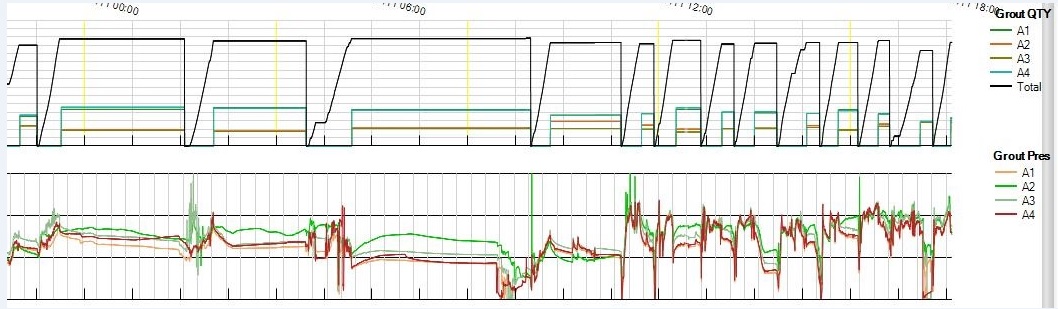
Figure 33 – Continuous monitoring of grout volume and pressure 2.8.3 Belt Scale Continuous Reading
This chart makes it possible to visualise successive belt totals and it is also possible to see the deterioration in the output signal from individual belt scales.
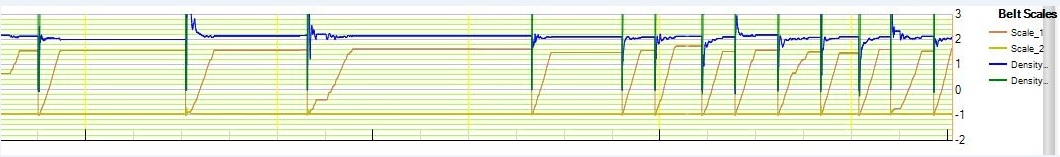
Figure 34 – Continuous monitoring of belt scales 2.8.4 Continuous Monitoring of Bentonite Injection
The continuous view of Bentonite injection it is useful where the shield is standing and the accumulators are being used to maintain face pressure.
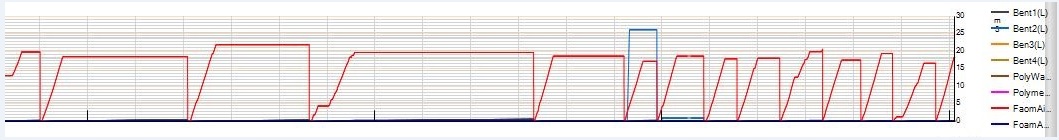
Figure 35 – Continuous monitoring of bentonite injection 2.8.5 Continuous monitoring of cutter head and erector
These graphs can be used to monitor actual excavation cycles and ring build cycles and durations.
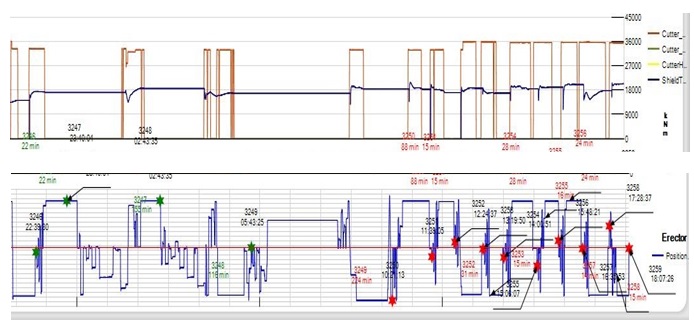
Figure 36 – Continuous monitoring of cutter head and erector 3.0 Quality Control and Balance Verification report
The Quality Control and Verification report records summarises of key excavation parameters for all rings excavated on any given day, Fig 37. It also includes any comments made by the Control Room Engineer in response to anomalies arising during the reporting period. Where needed a detailed historical excavation data for a range of rings can be tabulated and charted, Fig 38, providing a comprehensive performance analysis for effective parameters per ring and per range of rings.
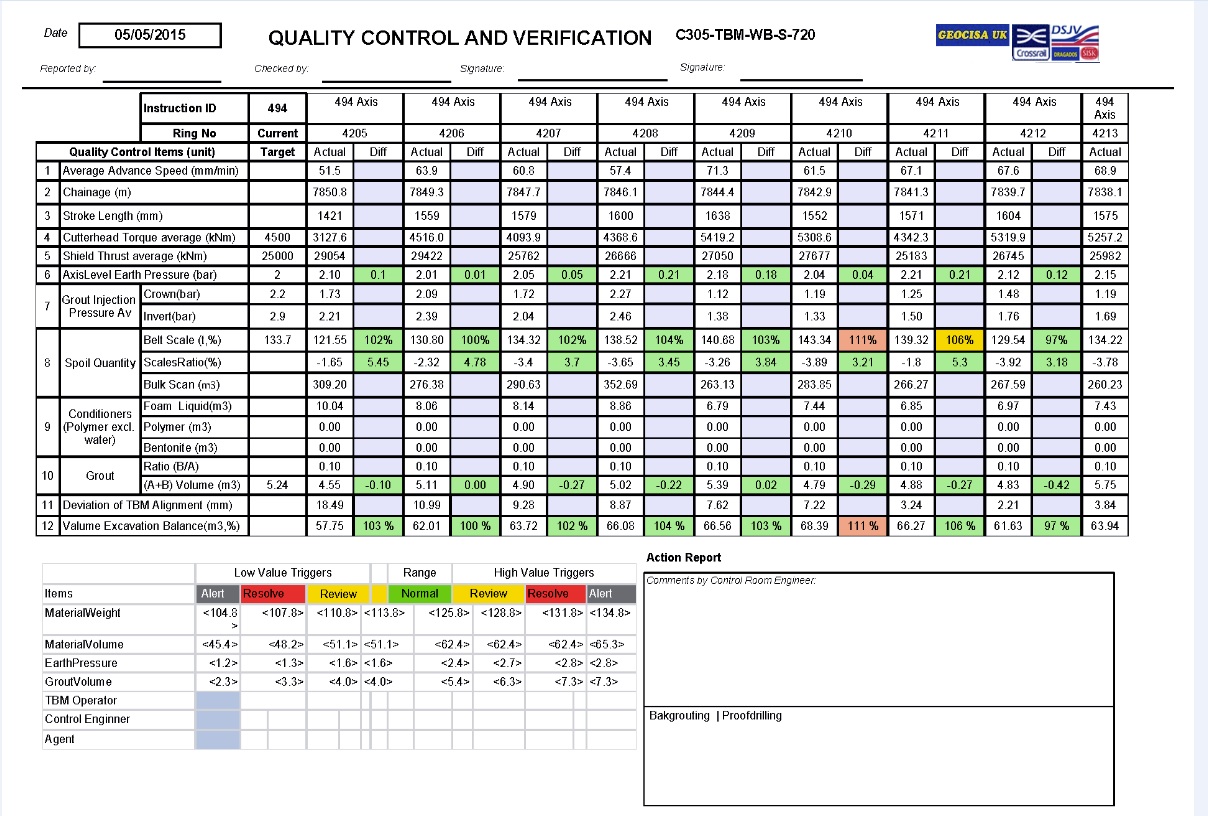
Figure 37 – Quality control and verification report 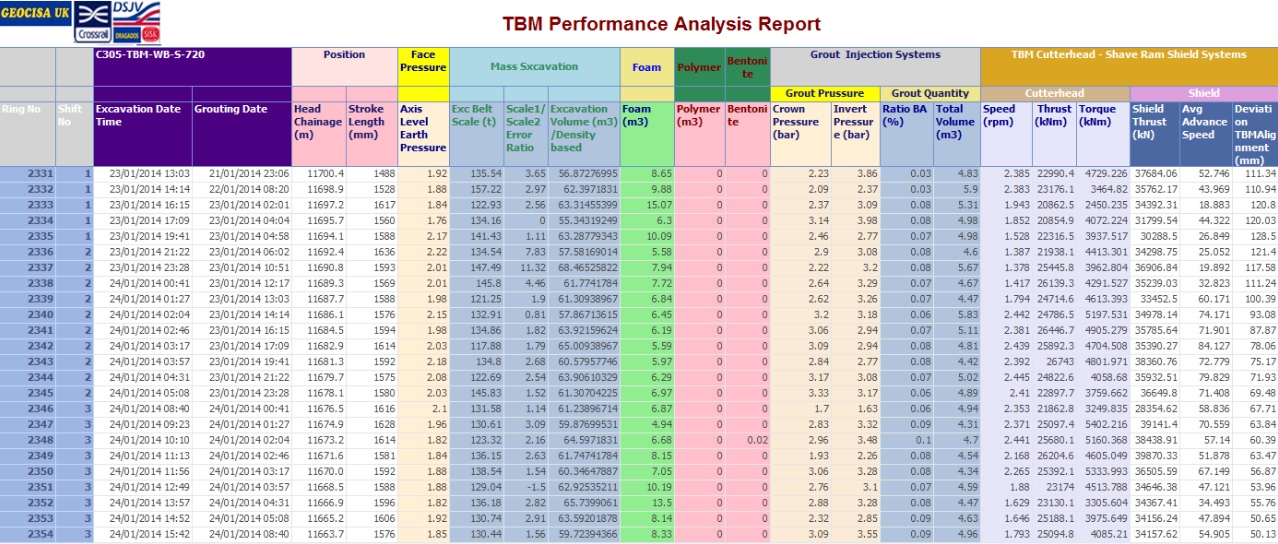
Figure 38 – TBM performance analysis report 4.0 Ring Management
4.1 Ring Formation
This document is to be completed on the TBM by the shift engineer for each ring installed. It records the type of ring installed, its orientation, and its unique identification number. It confirms that all bolts and dowels have been installed correctly and notes any damage that has occurred to the ring which may need remedial action. The sheet also includes information on the measured roll of the ring which is important in respect of opening sets where the correct location of the final opening is important, Fig 39 shows an example.
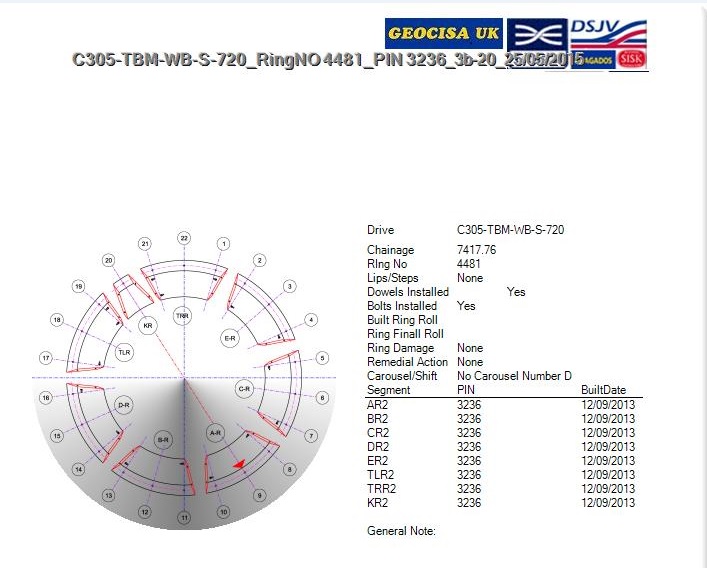
Figure 39 – Ring formation information 4.2 Damaged Segments
Ring manager allows for documenting and marking damaged segments and the damaged location, the data is stored in database for damage and ring and segment maintenance. Specifically it provides also for tunnel handover providing ring grouping in a tunnel invert centric view as shown in Fig 40.
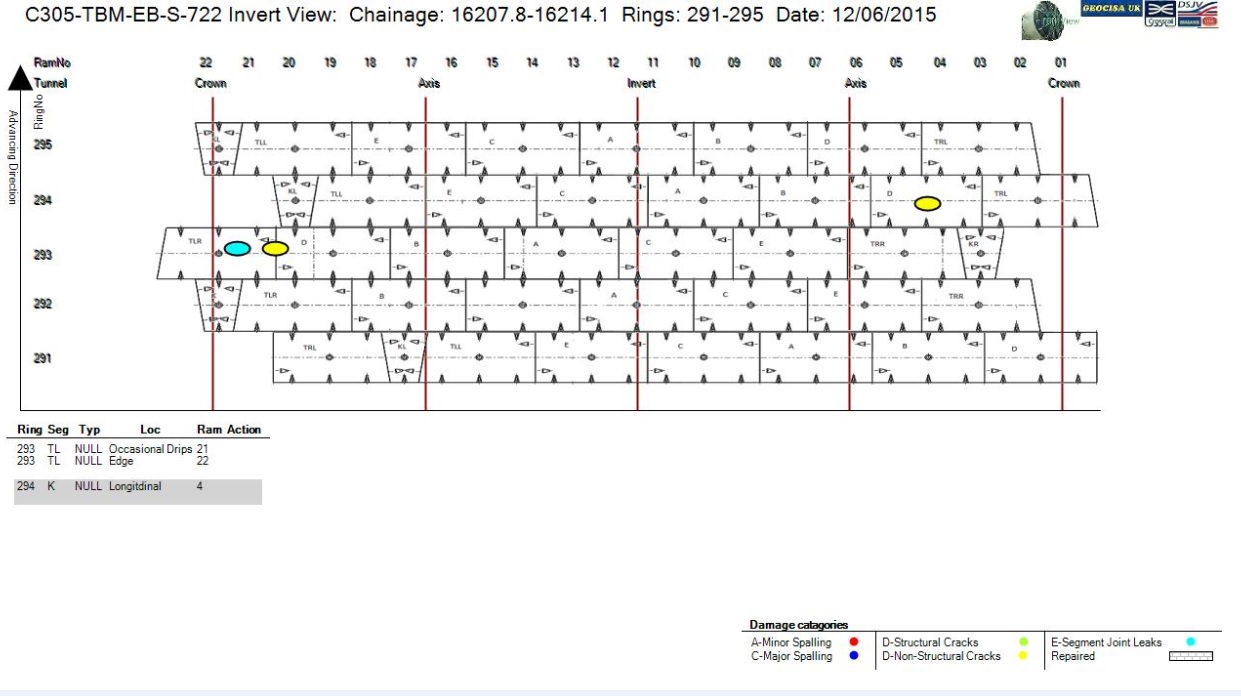
Figure 40 – Damaged segment record 4.3 Ring Plane Check
Examples of manual ring plane checks carried out early on in the project are included in Fig.41 together with VMT generated figures. To prevent the Ring damage from loading of thrust rams, it is required that we check the ring plane every three rings. Correction to the ring plane can only be made by the addition of 2mm thick packing and only one thickness can be used at any one time.
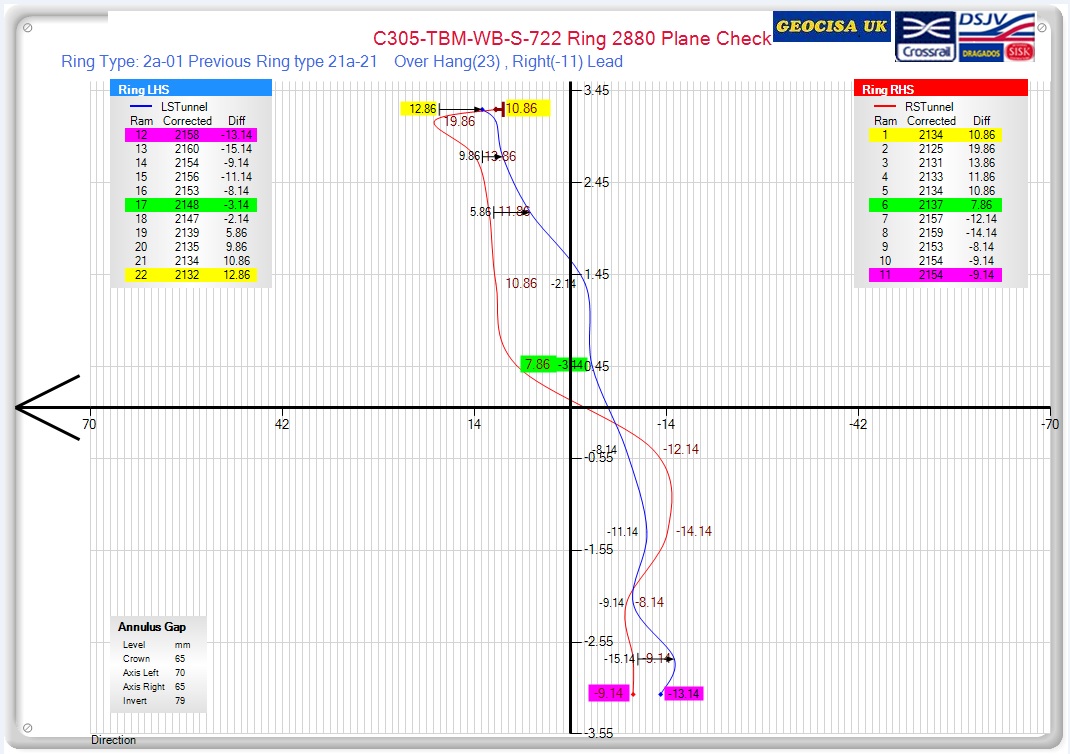
Figure 41 – Ring plane checks 5.0 Production and Shift Reports
This includes excavation and ring build production and critical path report weekly/monthly (Fig 42) and day/night shift reports, Fig 43. At end of each shift all the shift reports are generated and ready for SRG meetings and publication.
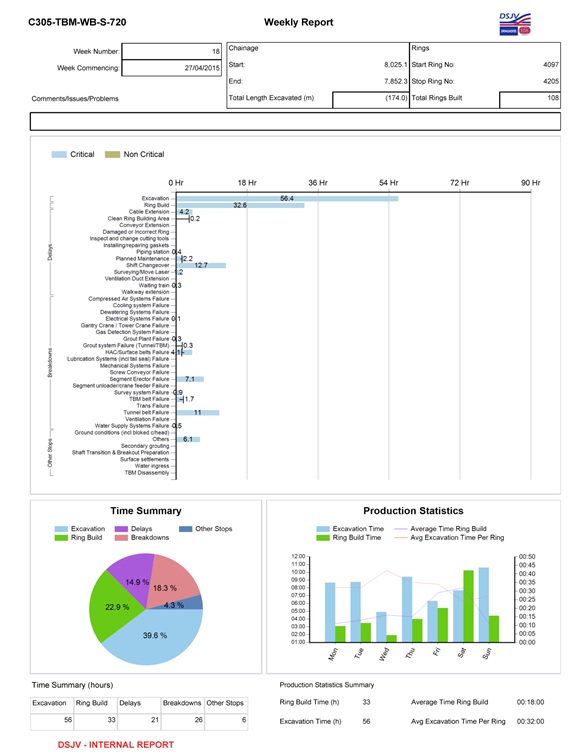
Figure 42 – Weekly report 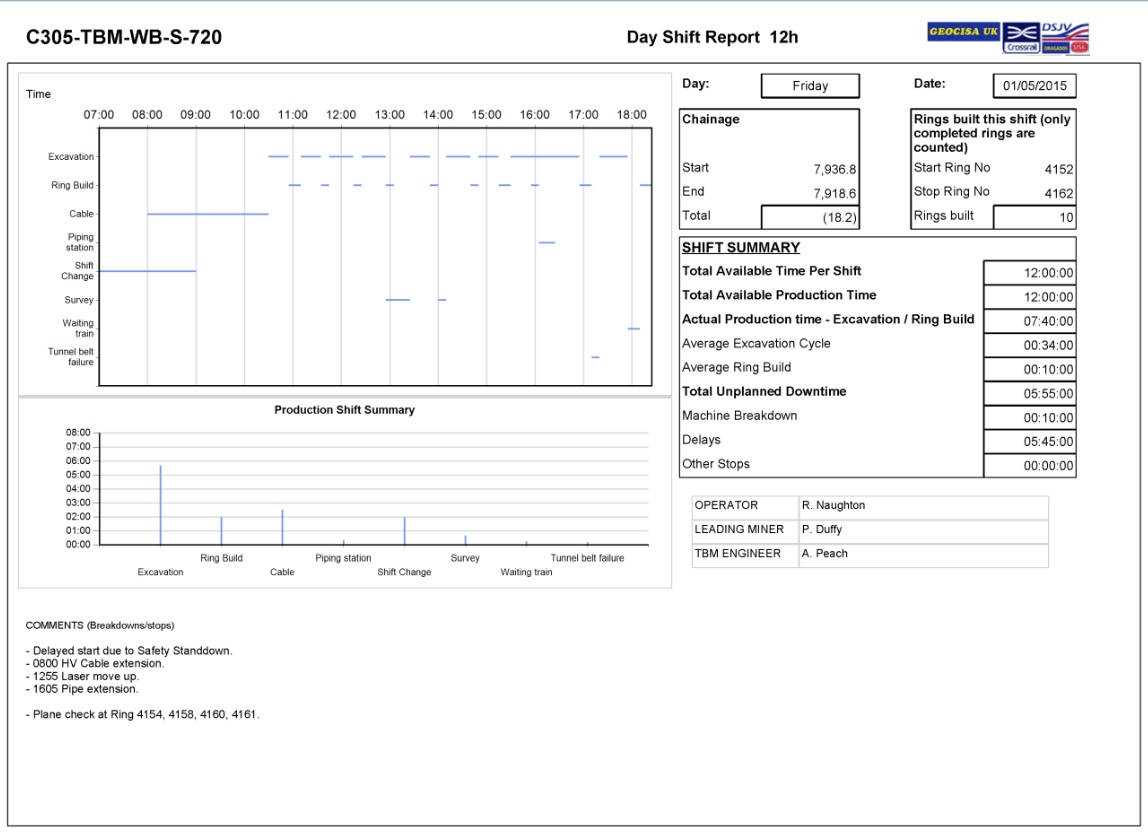
Figure 43 – Day/night shift report 6.0 TBM and Tunnel Safety Systems
6.1 Gas detection system
The TBM is equipped with gas sensors to monitor the environment for gasses that may arise from both the underground environment and our own activities. They are located in areas and at levels appropriate to both the expected source of the gas and its density.
The gas monitoring system on the TBM alarms in the operators cabin and in the control room on the surface. There are two levels of alarm, the first is alert and the second is alarm. At the alert level action can be taken to solve the existing problem. At alarm level the tunnel should be evacuated.
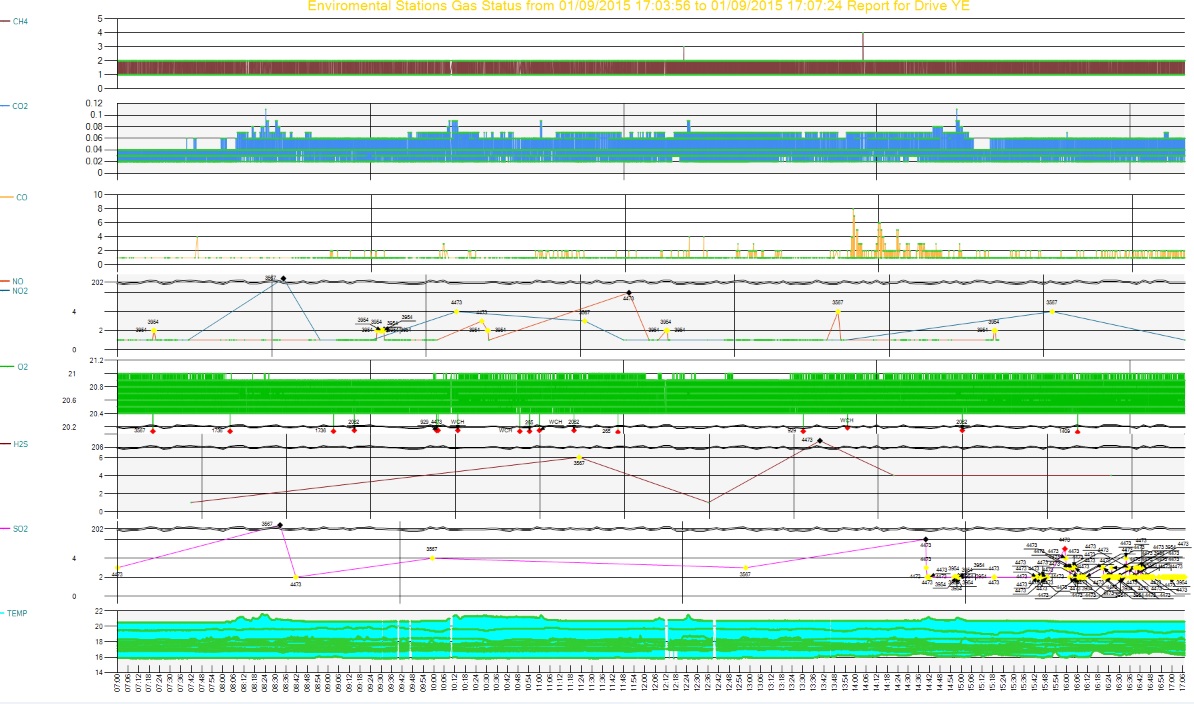
Figure 44 – Gas monitoring 6.2 Fire detection systems
The TBMs are equipped with smoke and heat detectors strategically placed along the length of the TBM. These will alarm in the operator’s cabin in case of fire and control room.
6.3 Tunnel Environmental systems
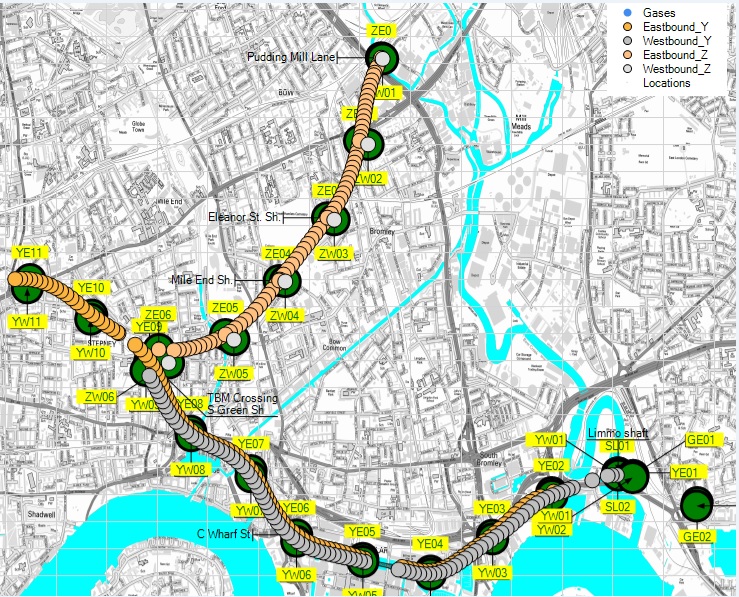
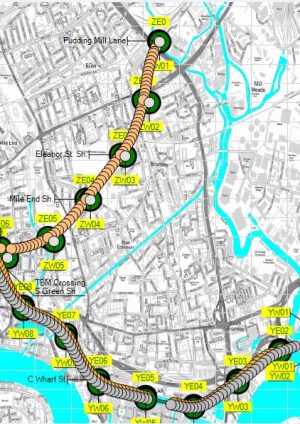
Figure 45 – Environmental monitoring station locations It is assumed tunnel environment monitoring stations are set up at intervals of let’s say 500m in each tunnel to monitor the atmospheric and environmental conditions.
The TBMView currently assumes sensor stations measure the following parameters covering 7 gases and temperature in the tunnels. Sensors are assigned the closest ring number and chainage location dynamically as the excavation is progressing (see Fig 45).
The sensor values are displayed locally at the individual stations and in the control room. Similarly to the TBM systems there are both alert and alarm level settings. The system is programmed to use a combination of temperature and CO levels to indicate the presence of fire within the tunnel.
Alert and alarm levels are available to the Control Room and can be sent also to pre-determined mobile phone recipients. It should be the Control Room Engineer that interprets the alarm level outputs and decides the correct course of action as the layout and complexity of the tunnel systems require some brief analysis prior to organising an evacuation.
7.0 Entrance control/Tally System
It is assumed the tunnel entrances are equipped with electronic entrance control systems. These entrance control systems are linked to the Tunnel Data System so that should be possible to know exactly who is in which tunnel in case of emergency.
-
Authors