Tunnel deformations caused by compensation grouting at Crossrail Farringdon Station
Document
type: Technical Paper
Author:
Angelos Gakis Dr. Dipl-Ing, MSc DIC, CEng MICE, Benedikt Grau Dipl-Ing, Thomas Schwind BSc, ICE Publishing
Publication
Date: 31/08/2016
-
Read the full document
Notation
BFK BAM Nuttall, Ferrovial Agromann, Kier Joint Venture
DSP Dr. Sauer & Partners Ltd.
FE, FEA Finite Element, Finite Element Analysis
MCS Monitoring Cross Section
SCL Sprayed Concrete Lining
TAM Tube–a–manchette
TBM Tunnel Boring MachineIntroduction
As part of the back analysis performed for the sprayed concrete lined (SCL) tunnels in Farringdon station, an investigation of the effect of compensation grouting on the two constructed platform tunnels was undertaken. The platform tunnels were 10.6m high by 11.4m wide and approximately 300m long each. They were enlarged to their final shape from the existing TBM tunnels using SCL methods. This study utilised 2D and 3D finite element (FE) analyses in order to back calculate the observed tunnel crown displacement, assessing the equivalent grouting pressures during the rear injection episodes of the concurrent grouting operations.
Part of the results presented in this paper, were derived by the second author as part of his Master of Science thesis at the Technical University of Graz, Austria.
Project Description
Farringdon station is located in the central London area (see Figure 1), and following its completion will become one of Crossrail’s busiest stations bringing together Crossrail, London Underground and Thameslink networks.
Two unique features distinguished Farringdon from the other Crossrail stations:
- The SCL tunnels were excavated mostly in the formations of the Lambeth Group (more than 85%). These units comprised mainly very stiff, overconsolidated clays with interbedded sand lenses, which proved to be in their majority randomly distributed and water bearing. Additionally, the continuity of the geology in the area of the station was interrupted by 5 main faults.
- The station was designed to receive 4 TBMs (the two drive X and the two drive Y TBMs shown in Figure 1). The drive X TBMs passed through the footprint of the station and were turned from their original alignment and buried in place. Subsequently, the platform tunnels were enlarged from the existing TBM tunnels using SCL methods.
Compensation grouting was employed to provide the means for the control and mitigation of the surface settlements induced by the tunnel excavations.
Contract C435 for the construction of the station was awarded by Crossrail to a BAM Nuttall, Ferrovial Agroman and Kier Joint Venture (BFK), which appointed Dr Sauer & Partners (DSP) as a specialist consultant responsible for the design and site supervision of all the SCL works prior to ring closure. The Employers SCL designer (Mott MacDonald – C121) held the design responsibility for the permanent works post-ring closure.
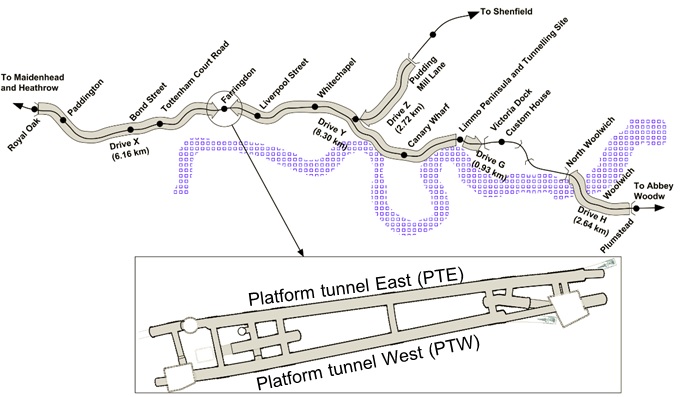
Figure 1 – Crossrail route and Farringdon station plan. Compensation Grouting Principles
Compensation grouting is a technique widely used in conjunction with tunnelling works to control the surface settlements induced by the underground excavation. The main mechanism involves the injection of a grout mix under pressure at the space between the tunnel crown and the ground surface in order to limit the induced settlements to an acceptable level. Vertical access shafts are typically built at several positions to enable the drilling of arrays of boreholes that will house the tube–a–manchette (TAMs) for the grout injections (Figure 2).
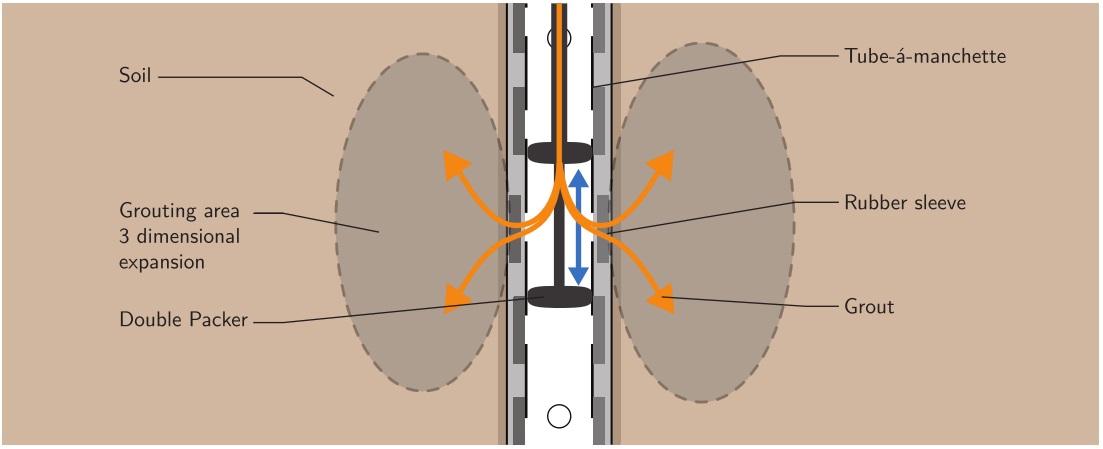
Figure 2 – Tube-a-manchette injections (softec). Once the TAM arrays have been installed, the pre-treatment (or pre-conditioning) episodes are carried out. The aim of the pre-treatment is to prepare the ground in order to ensure that the subsequent grouting episodes will be efficient, exhibiting a rapid response. This is achieved by injecting a small fraction of the theoretical total grout volume in order to fracture the ground and induce the first grout layers by filling the formed (or existing) joints, altering the initial soil stresses accordingly. During this phase, the grout parameters (pump pressure, injection volumes per port etc.) are optimised. The pre-treatment is normally considered successful once a small heave is recorded at the surface.
The main grouting phases comprise the concurrent grouting and the grout jacking episodes. A predefined exclusion zone for all the grouting works is set to prevent grouting operations in the vicinity of the “young” sprayed concrete, ensuring that grouting is carried out above closed shotcrete rings which have reached their full strength/stiffness (nom. 28days). This exclusion zone (see Figure 3 left) in Farringdon extended 5m above the crown and from the sides of the tunnels and at certain distance ahead of and behind the moving tunnel face (varying with the excavation sequence – approximately 9-10m in Farringdon).
Grout jacking includes additional grouting episodes, carried out in between or after excavation works to further reduce the surface settlements where necessary.
Concurrent grouting is executed simultaneously with the tunnel progress. It comprises front and rear injections. The front injections are carried out ahead of the exclusion zone, aiming to pre-heave the ground thus reducing the subsequent subsidence. The rear injections, carried out behind the exclusion zone, aim to reduce the settlements induced by the tunnel excavation to an acceptable level. Figure 3 illustrates the main stages of the concurrent grouting operations.
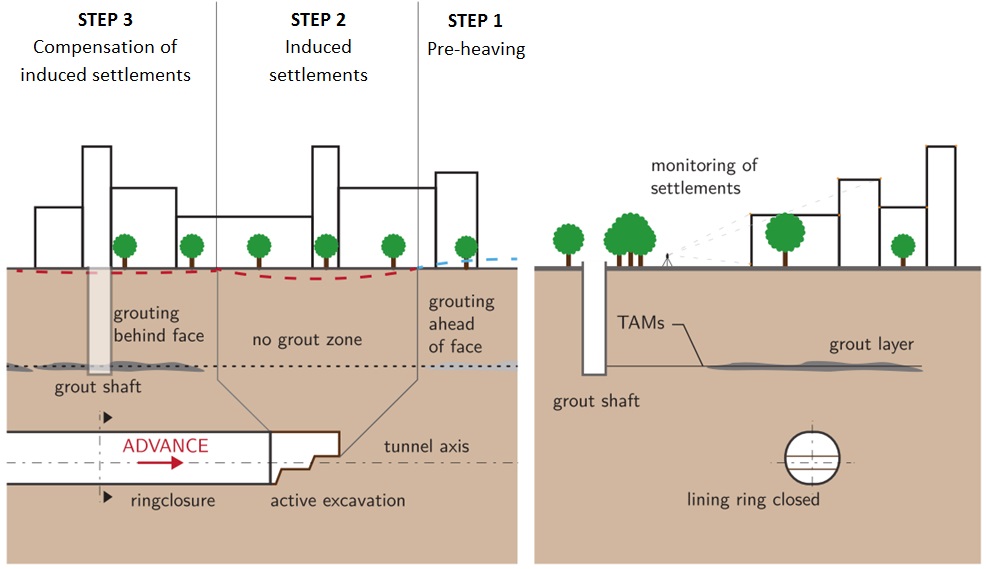
Figure 3 – Compensation grouting principles. Previous Applications
Compensation grouting has been successfully deployed in numerous cases. In UK it was extensively used with success in the Jubilee Line Extension [6],[10] and Crossrail projects [7].
Following the collapse of the Heathrow tunnels [8], a trial was undertaken at Redcross Way as part of the Jubilee Line Extension to demonstrate the effects of compensation grouting [11], [12], [14]. The trial aimed to demonstrate a safe and well instrumented practice during the excavation of sprayed concrete lined tunnels as well as the capability of compensation grouting to mitigate the induced settlements. An interesting back analysis on this case study is presented in [12], which utilised 2D finite element analyses to back calculate the observed tunnel convergence and assess the increase in the average hoop stress. The excavated diameter of the sprayed concrete lined tunnel was 11.3m at axis depth of approximately 28m below ground level and the TAMs were located 7 to 8m above its crown.
A back analysis of the effects of compensation grouting on segmental tunnel linings of the Docklands Light Railway Lewisham Extension is presented in [13]. In that case, the 5.2m internal diameter tunnels converged by a maximum of 5mm in the vertical diameter following the application of grouting pressures.
Α study of numerical modelling of compensation grouting in London Clay is also presented in [3].
Compensation Grouting at Farringdon
Vertical access for the installation of the TAMs in Farringdon was provided by five grouting shafts. Each shaft was constructed using a top down sequence utilising pre-cast concrete rings. The shafts were extended at depths that allowed the installation of the TAMs at the desired elevation which in most of the cases was approximately 5m above the platform tunnel crown.
The boreholes that housed the TAMs were drilled using predominately dry auger drilling. The drilling was instrumented and a survey of the as-built positions was performed in all cases to ensure compliance with the prescribed tolerances. The location of the grout shafts and the total coverage of the TAMs are shown in Figure 4. In total 386 TAMS up to 85m long were drilled for the protection of approximately 40 assets, covering an area of approximately 27000m2.
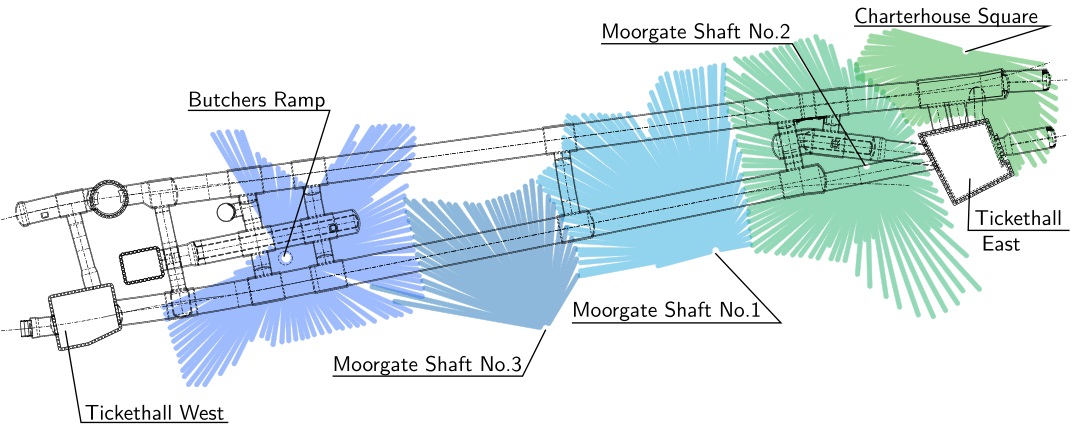
Figure 4 – Compensation grouting coverage at Farringdon station. The location of the grouting shafts as well as the extent of the TAMs are shown. In-tunnel Monitoring
The in-tunnel monitoring of the platform tunnels at Farringdon relied solely on 3D optical measurements of prisms using a high precision total station. Typically the monitoring cross sections (MCS) were spaced every 10m. In the areas of the junctions with cross passages, additional MCSs were installed (one in the middle and two on the sides of the openings). The layout of a typical MCS is shown in Figure 5.
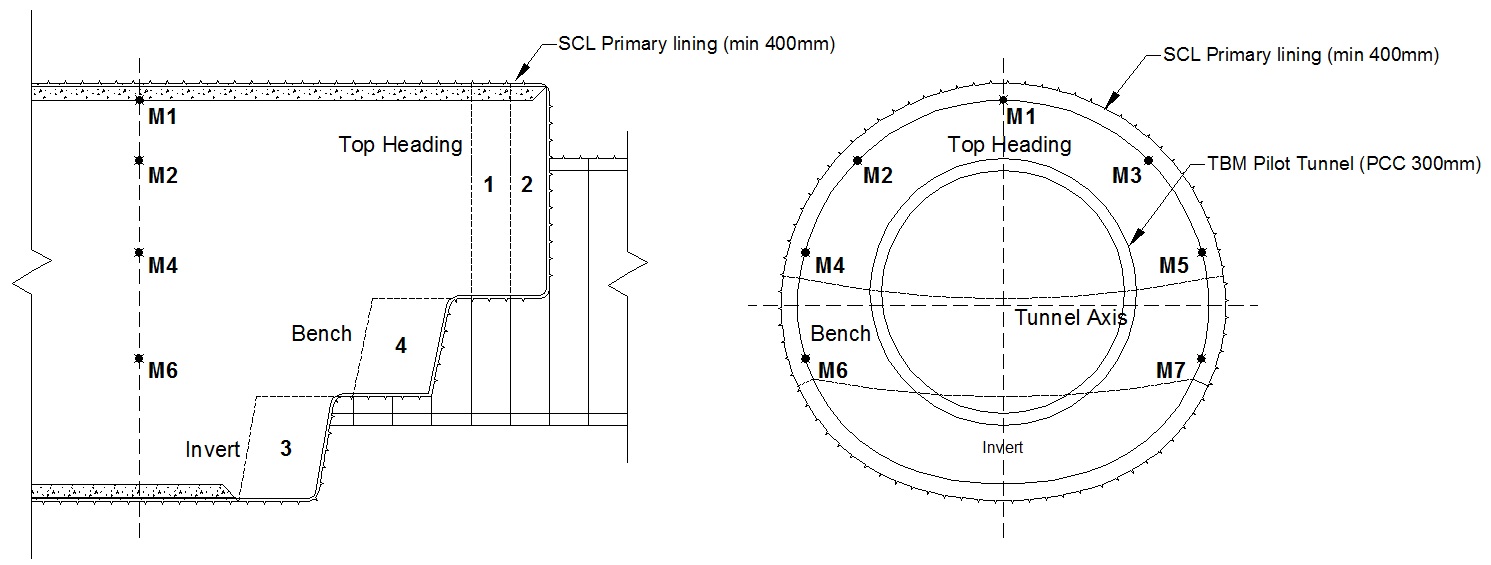
Figure 5 – Excavation sequence for the Platform Tunnels in longitudinal and cross section showing the installed monitoring cross section. Absolute 3D displacements were measured, with their vertical and transverse components being subsequently analysed to assess the convergence. Readings were taken at daily intervals following the installation of a MCS and up to two weeks after the ring closure, provided that the observed deformations had levelled out. Subsequently the frequency was gradually reduced to twice weekly, once weekly, twice monthly and monthly. On the event of additional tunnel activities or post-jacking episodes in the vicinity of an MCS, breaching of an amber or red trigger level or generally observing abnormal behaviour, the frequency was adjusted accordingly (MCSs have been measured up to three times daily).
Three stages can be distinguished in a time- displacement plot for the platform tunnels in Farringdon as shown in Figure 6.
- Initial stage: Initial displacements increasing linearly with time were observed between the onset of measurements and the ring closure, which typically lasted between 3 and 5 days depending on the variations of the advance rate (typically 1.5 to 2.0m/day)
- Levelling out stage: Once the ring was closed, a visible deceleration of the movements followed for an additional 3 to 5 days while the shotcrete was gaining strength.
- Stable stage: A steady state stage followed where only minor fluctuations due to the reading accuracy were observed. When subsequent tunnel activities or post jacking episodes were carried out in the vicinity of the MCS, additional displacements could be observed in that stage too.
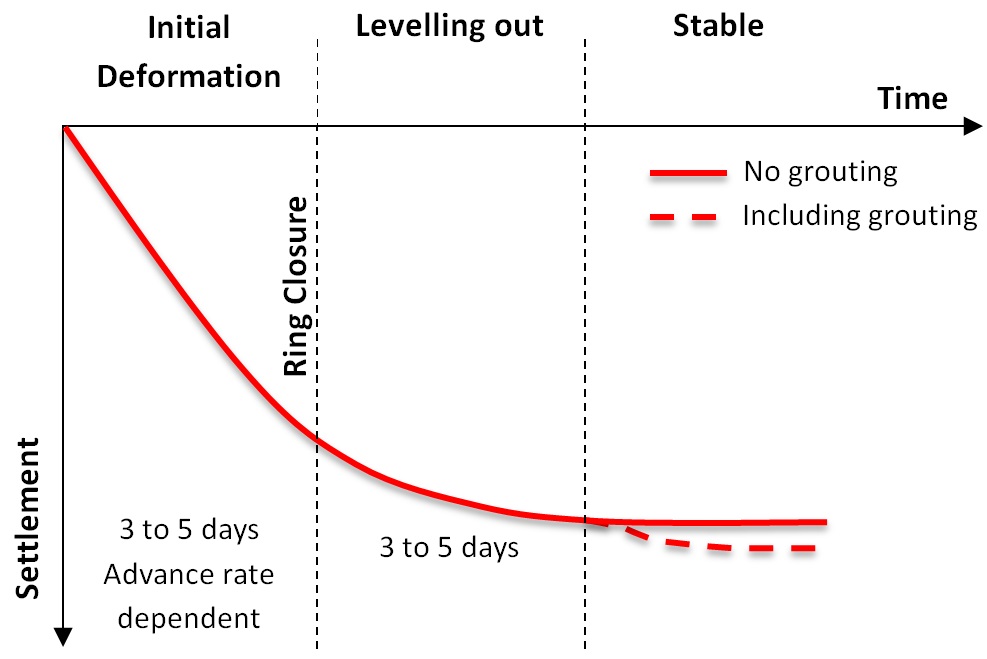
Figure 6 – Typical in-tunnel displacements with time for the platform tunnels with/without grouting effects. Tunnel displacements in areas with and without grouting
As the back analyses performed in this study were based on the observed in-tunnel deformations, a detailed analysis of the vertical displacements of the crown points in both platform tunnels (PTW and PTE) was performed. The analysis distinguished between MCSs inside and outside the zone of influence of concurrent grouting. The reason for some areas being outside this zone was either the actual extent of the TAMs as shown in Figure 4 or due to the omission of rear injections in specific areas where the surface distortion criteria were satisfied after the passage of the tunnelling works. Furthermore, from the total of the MCSs in the two platform tunnels, some have been omitted from the analyses as the results were affected by the numerous safe stop procedures (temporary stoppage in the tunnelling advance), or due to unreliable measurements mostly related to damage of the targets.
The filtered results are presented in Table 1. For each platform tunnel, the vertical displacement of the crown point (M1) at the stable stage (according to the graph of Figure 6) is shown for the MCSs inside and outside the concurrent grouting zone of influence. The average displacements in PTW and PTE were 15.9 and 16.4mm inside and 13.5 and 13.7 outside this zone. Based on that it has been concluded that the effect of the rear grout injections on the crown point was in the range of 2.5mm.
This 2.5mm was set as the target for the numerical back analysis.
Back Analyses
The target of the back analyses was to assess the effective grouting pressure of the rear injections which yielded the 2.5mm of additional vertical crown displacement that was observed in the platform tunnels as described in the previous section. This effective grouting pressure is a modelling parameter and should be distinguished from the grout pump pressure or the pressure at the TAM ports.
PTW PTE MCS Crown vertical displacement at steady state (mm) MCS Crown vertical displacement at steady state (mm) Inside concurrent grouting zone of influence 49.3 13.6 24.8 15.5 185.3 15.9 44.8 16.9 192.3 14.0 52.8 16.9 211.3 16.0 63.8 12.8 221.3 14.6 188.8 18.8 231.3 18.9 218.8 13.5 241.3 16.8 248.8 18.5 251.3 17.9 268.8 18.1 261.3 13.3 271.3 17.7 Average 15.9 Average 16.4 Outside concurrent grouting zone of influence 135.3 12.0 112.8 13.4 165.3 16.5 122.8 13.0 175.3 15.1 132.8 13.6 289.3 10.3 142.8 13.2 152.8 14.2 287.8 14.5 Average 13.5 Average 13.7 Difference 2.4 2.7 Table 1 – Vertical displacements of the crown point for MCSs inside and outside the zone of influence of concurrent grouting for PTW and PTE.
Initially a 2D FEA was performed. The aim was to gain an understanding of the overall mechanism of concurrent grouting and its effects on the tunnel lining and the surface. Moreover, the 2D analyses were used as a calibration and validation tool for the more detailed 3D FEA. The 3D FEA was performed in order to account for the 3D excavation and support process of the platform tunnels (deriving the lining stress history more realistically) as well as to introduce the 3D application of the rear grout injections.
Analysis Parameters
The soil properties used in the 2D and 3D FE back analyses were in accordance with [1] and are presented in Table 2 below. The elastic – perfectly plastic Mohr Coulomb criterion was assigned to all the soil elements. A zone of reduced ko was introduced as shown in Figure 7 as this has proven to yield more realistic in-tunnel and surface displacements [16] in Farringdon.
Parameter Unit Made Ground London Clay
A3
London Clay
A2
Lambeth Group Unit Weight kN/m3 17 20 20 21 Young’s Modulus (Undrained) MPa N/A 35.4+3.8z 40+3.7z 36+5.9z Poisson’s ratio [-] 0.2 0.495 0.495 0.495 Friction Angle [o] 31 0 0 0 Undrained Shear Strength kPa 0 50+8z 85+6.5z 95+10z Earth coeff. at rest, k0 [-] 0.5 1.2/0.6 1.2/0.6 1.2/0.6 z denotes the depth from the top of London Clay Table 2 – Soil parameters used in the FE back analyses. Note that the reduced ko=0.6 value was applied in the zone shown in Figure 7.
The sprayed concrete linings were simulated as linear elastic materials. The parameters used are shown in Table 3. Two different values for the elastic modulus were used: the computational value of E=13GPa corresponding to the stages during the tunnel excavation and support (according to [9], [15], [18]) and the long term value of E=30GPa which was valid during the concurrent grouting stages, when the concrete had reached the 28 day strength.![Figure 7 - Schematic representation of the reduced ko zone [16].](https://learninglegacy.crossrail.co.uk/wp-content/uploads/2016/11/7E-018-Figure-7.jpg)
Figure 7 – Schematic representation of the reduced ko zone [16]. Parameter Value Computational Elastic Modulus[9],[15],[18] (during tunnel construction) 13GPa 28-days Elastic Modulus (during concurrent grouting) 30GPa Poisson’s ratio 0.2 Table 3 – Sprayed concrete lining parameters used in the FE back analyses.
2D Finite Element Analyses
The 2D analyses were performed using software phase2 (Rocscience). The soil was simulated using triangular continuum elements and the tunnel lining using linear beam elements. Two different cases were analysed:
- Case A included the excavation and support of the platform tunnel following a top heading – bench – invert sequence. In order to simulate the three dimensional tunnel advance and the subsequent displacements that occur prior to the lining installation, a stiffness relaxation (80%) was applied to the soil elements of each excavation step prior to their removal and the installation of the SCL in accordance with [4],[5]. Stage A1 included the completed TBM tunnel which was used as a baseline hence the displacements were reset to zero. Stage A2 included the final step of the platform tunnel excavation without any grouting application. These stages are illustrated in Table 4.
Case A – no grouting A1. TBM excavation (baseline) 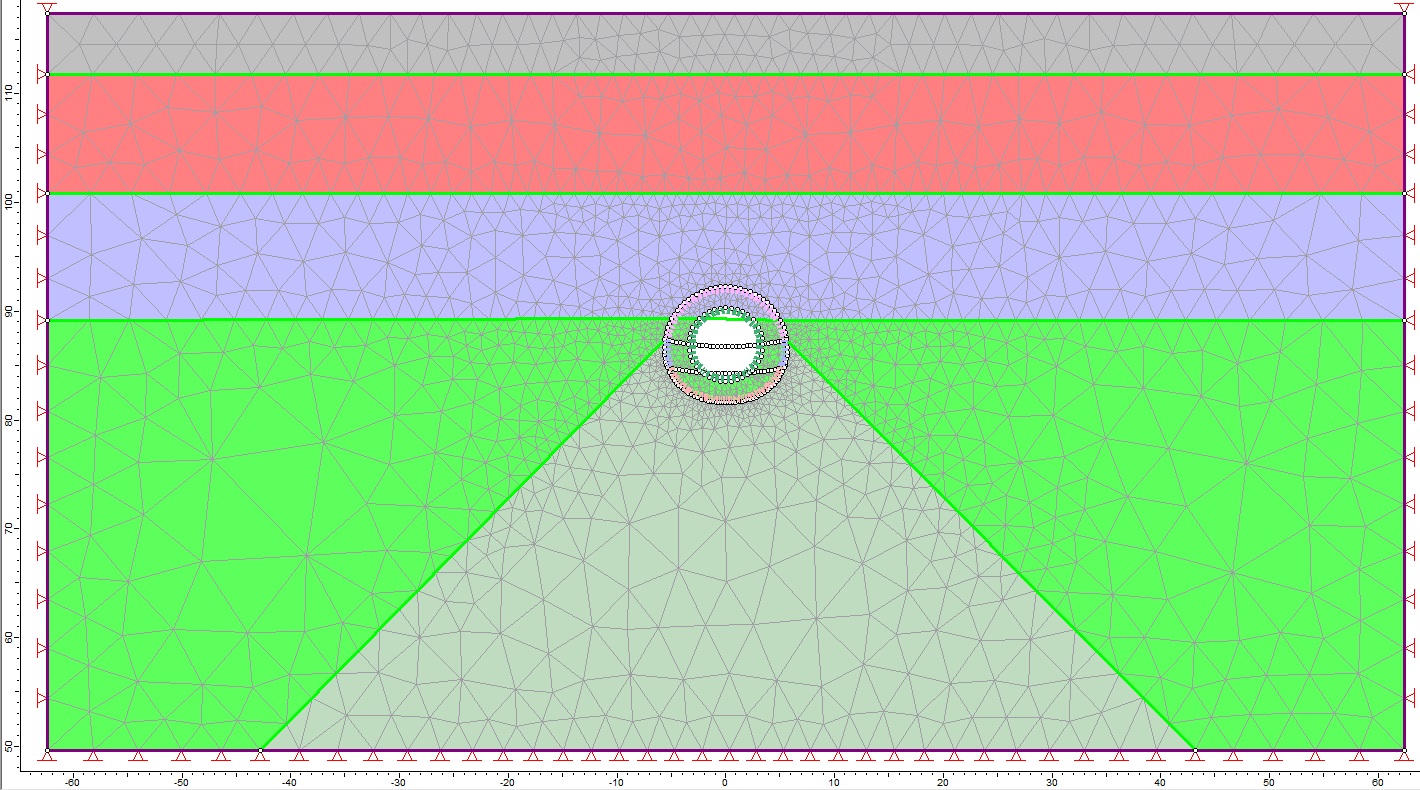
This stage is considered as baseline therefore the displacements have been zeroed. A2. Platform tunnel excavation 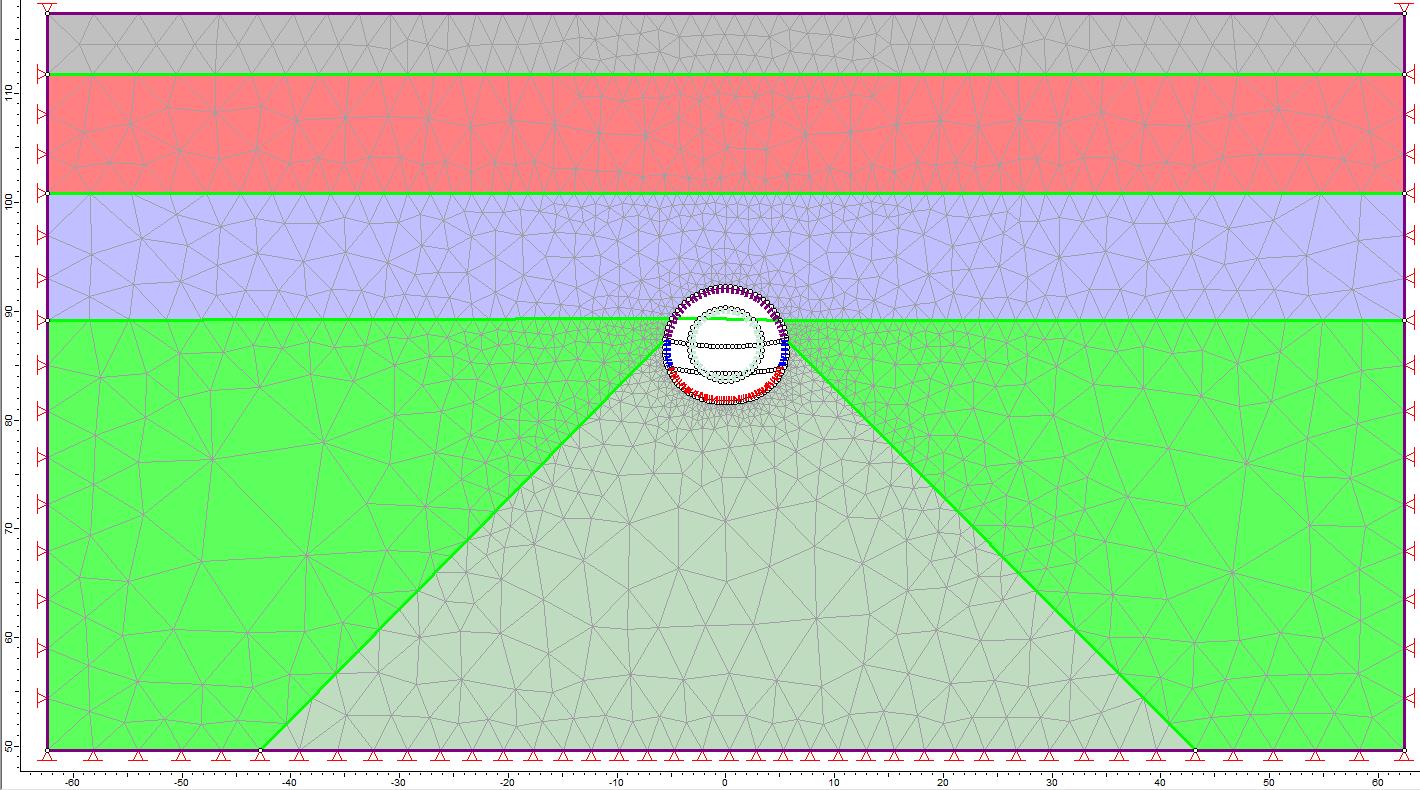
The total surface settlement at the tunnel axis was calculated 12mm.
The total measurable (after the lining installation) displacement of the tunnel crown (point M1) was calculated 10mm.
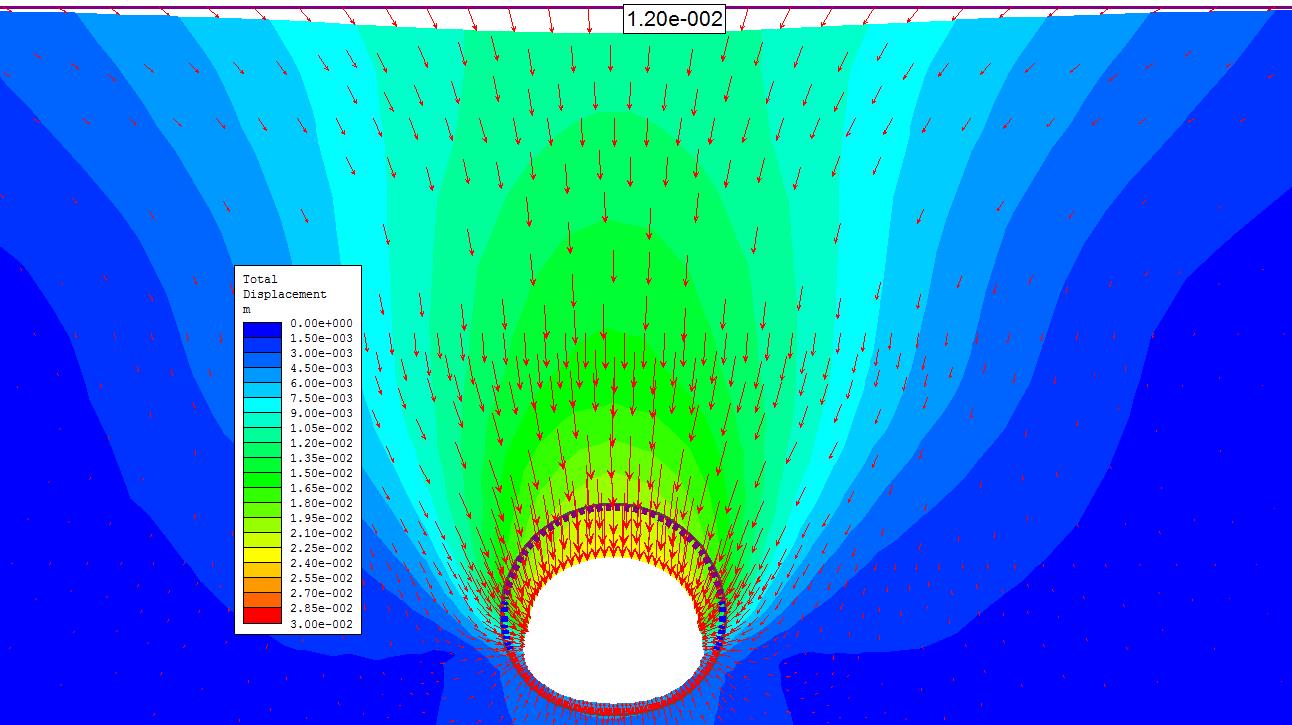
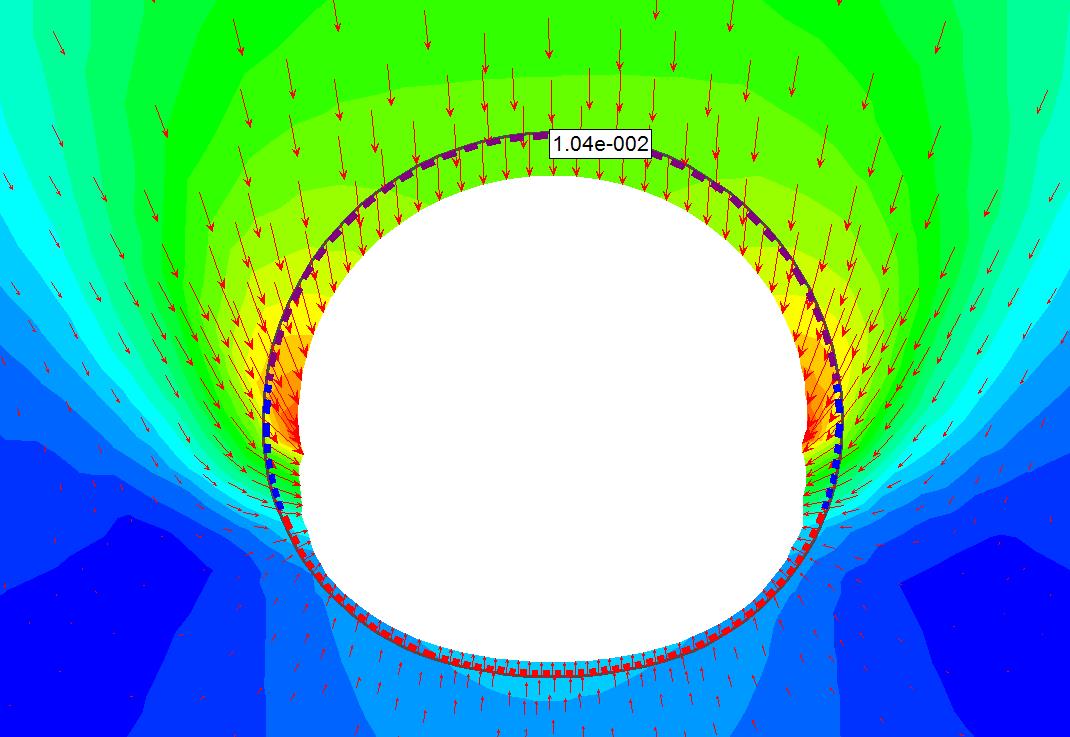
Table 4. 2D FE back analyses – Case A (no grouting).
- Case B introduced the front and rear injection stages. The pressures were applied internally in a joint (linear) element in both directions. Stage B1 included the completed TBM tunnel and was used as a baseline. Stage B2 simulated the front injections by applying an internal pressure of 50kPa in a joint located 5m above the platform tunnel crown. The choice of 50kPa for this pressure was based on the observations where the surface typically heaved by approximately 2mm. Stage B3 included the final step of the platform tunnel excavation. Stage B4 simulated the application of the rear grouting injections in 4 separate episodes. The internal pressure was back calculated to 50kPa for each episode reducing the final surface settlement to a minimum value (2mm). These stages are illustrated in Table 5.
Case B – front and rear concurrent grouting injections B1. TBM excavation (baseline) 
This stage is considered as baseline therefore the displacements have been zeroed. B2. Front Injections (50kPa) 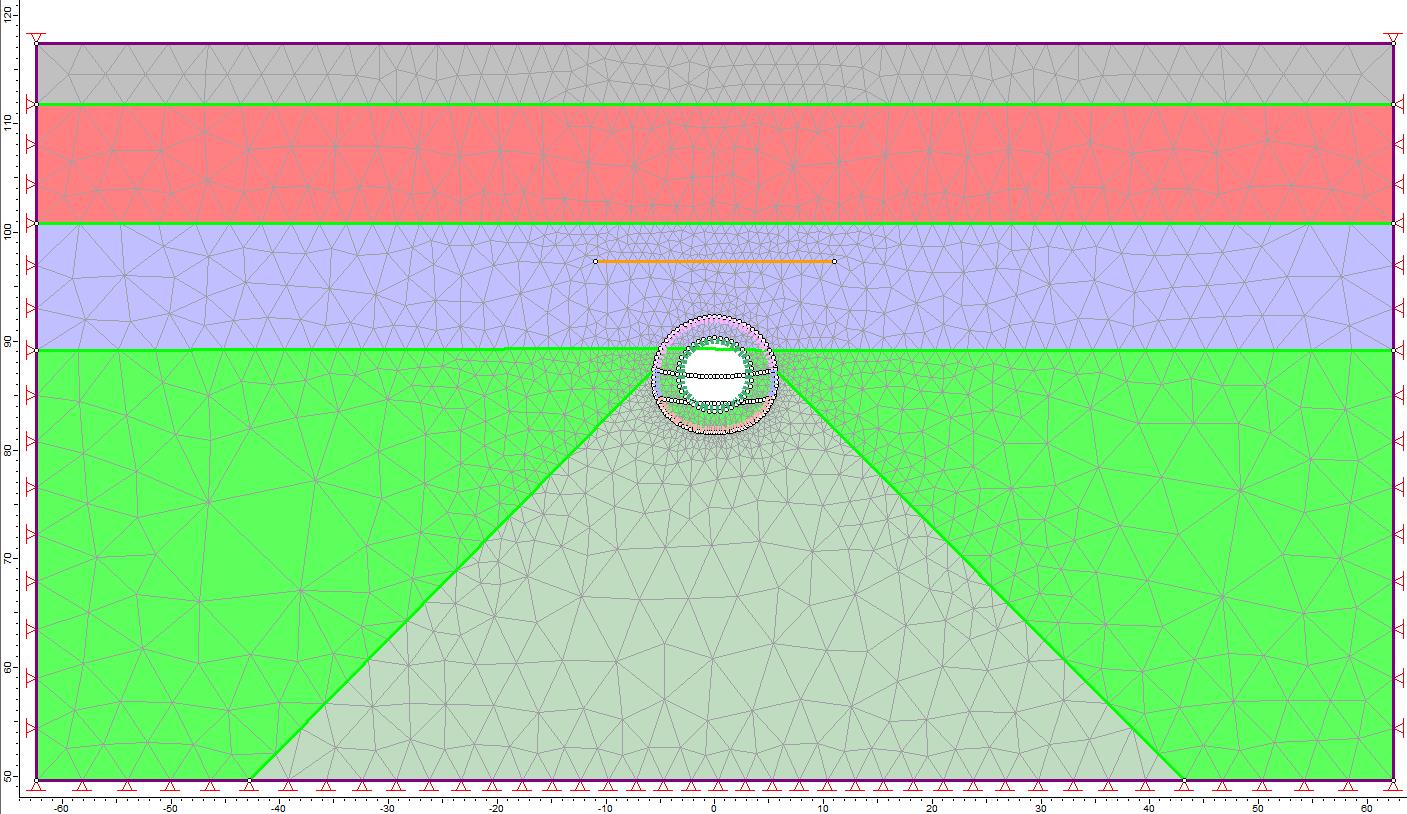
The total surface heave induced by the front injections was calculated 2.5mm. B3. Platform tunnel excavation 
The total surface settlement at the tunnel axis was calculated 8mm.
The total measurable (after the lining installation) displacement of the tunnel crown (point M1) was calculated 13mm.
B4. Rear Injections (4 episodes 50kPa each) 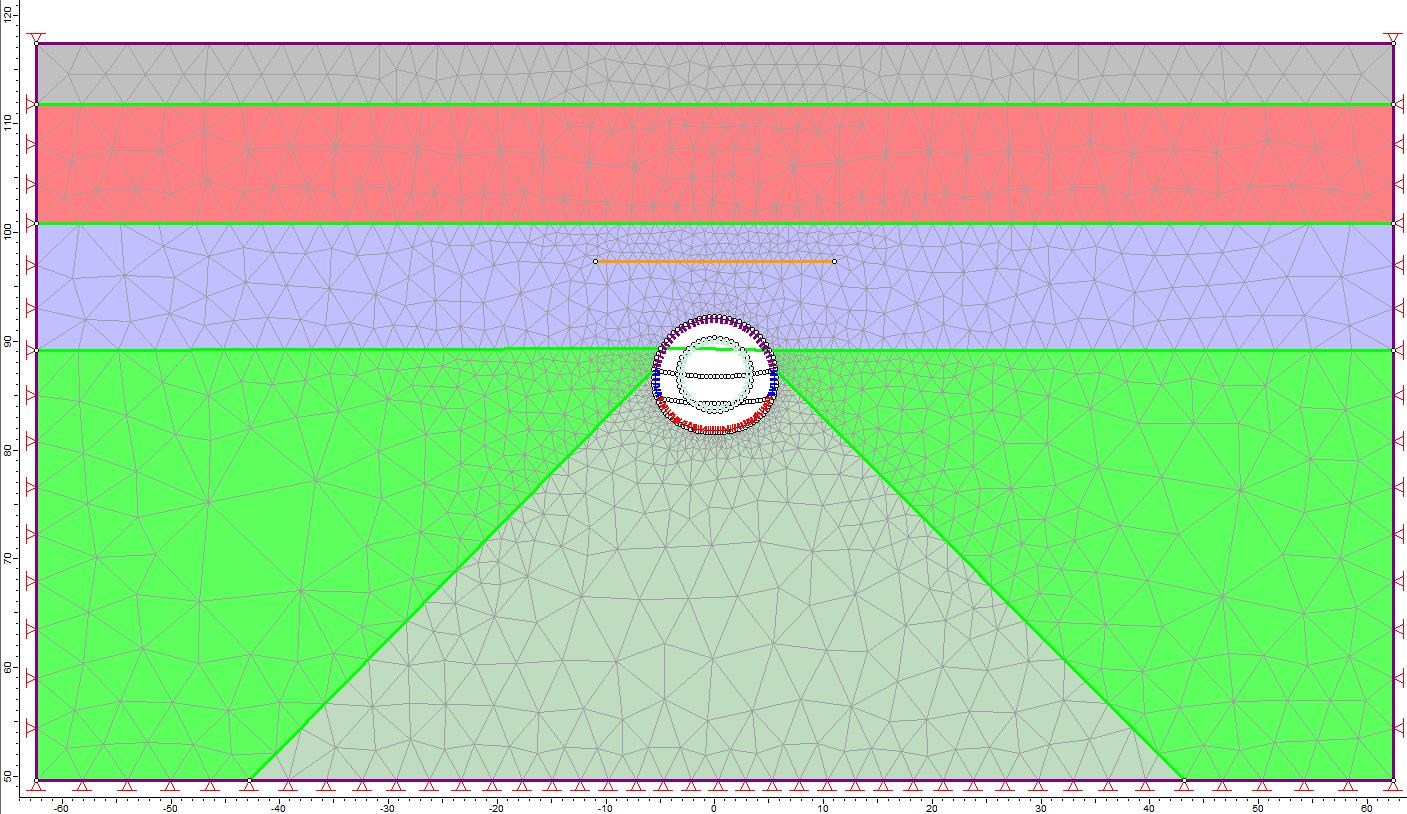
The total expected surface settlement at the tunnel axis was calculated 2mm.
The total measurable (after the lining installation) displacement of the tunnel crown (point M1) was calculated 15.6mm.
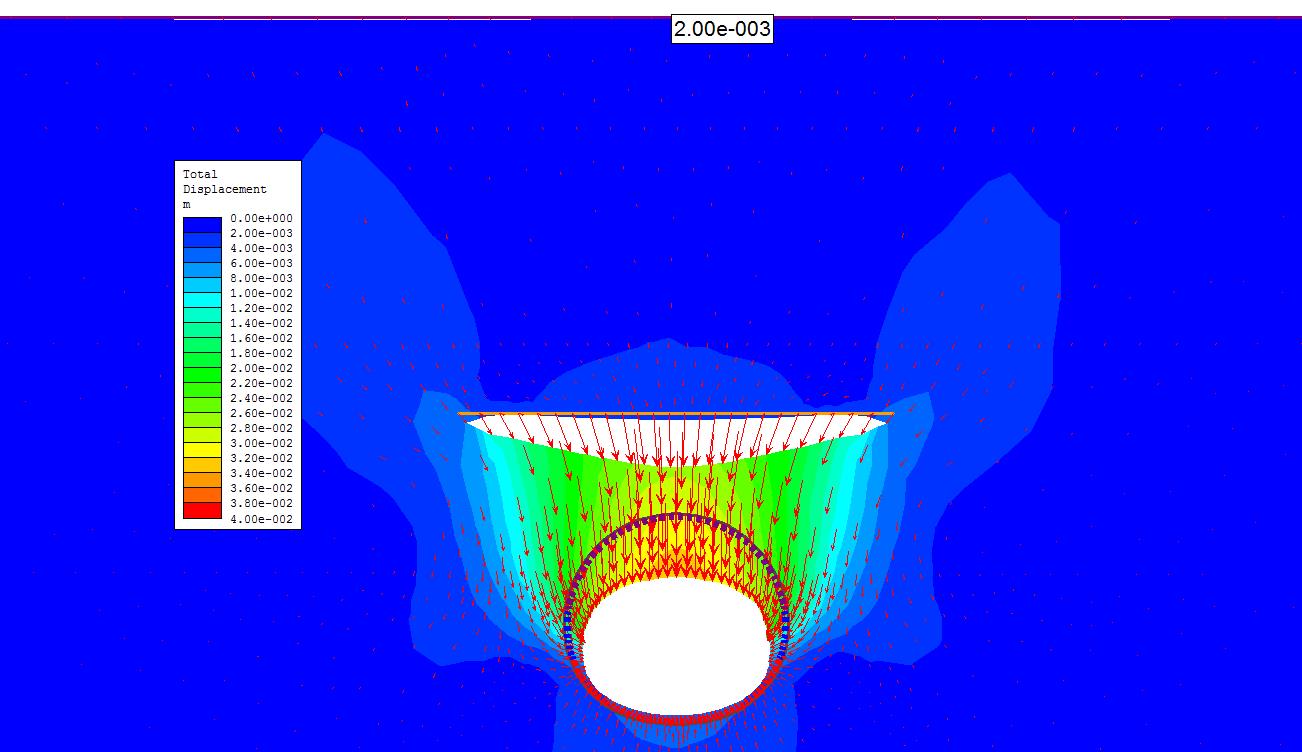
Table 5 – 2D FE back analyses – Case B (front and rear concurrent grouting injections).
The cumulative results of the 2D back analyses are shown in Table 6. The more interesting outcomes were:
- The calculated surface settlement above the tunnel axis after the platform tunnel excavation was 12mm in case A (no grouting) as opposed to the 8mm in case B. This 4mm difference is attributed to the front injections.
- The rear grouting injections reduced the final surface settlement to 2mm (case B).
- The calculated vertical displacement of the platform tunnel crown was 13mm prior to the rear injections (case B3) and 15.6mm after (case B4). That implied a difference of approximately 2.5mm which correlates well with the observations.
- The 50kPa internal pressure per episode (200kPa in total) seems to be the optimal choice based on these results.
Case A – no grouting Case B – with grouting Surface Settlement (mm) Tunnel Crown Displacement (mm) Surface Settlement (mm) Tunnel Crown Displacement (mm) TBM excavation 0 (Baseline – TBM induced settlements are ignored) Front Injections N/A N/A +2.5 N/A Platform Tunnel Excavation -12 -10 -8 -13.0 Rear Injections N/A N/A -2 -15.6 Table 6 – Cumulative results of the 2D FE back analyses (positive sign denotes heave).
3D Finite Element Analyses
A 3D FEA was developed using software Abaqus (Simulia[2]) based on previous work presented in [5], where a back analysed 3D FE model was produced that matched the observed in-tunnel displacements by introducing a very detailed simulation approach for the actual excavation and support steps (see Figure 8).
This 3D FE model was used as a base and consisted of approximately 200,000 elements (Figure 9). The tunnel lining was modelled using shell elements (type S3 in Abaqus) whereas the soil was modelled with continuum elements (type C3D4 in Abaqus).
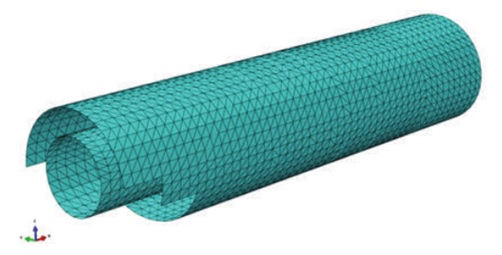
Figure 8 – Sequential excavation and support in the 3D FEA. 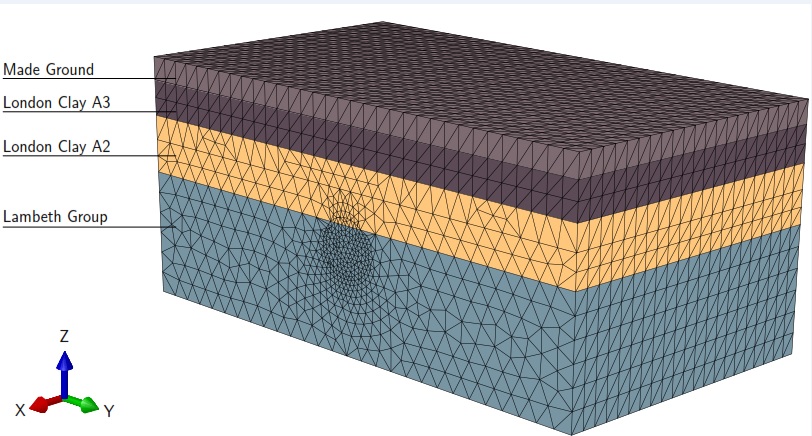
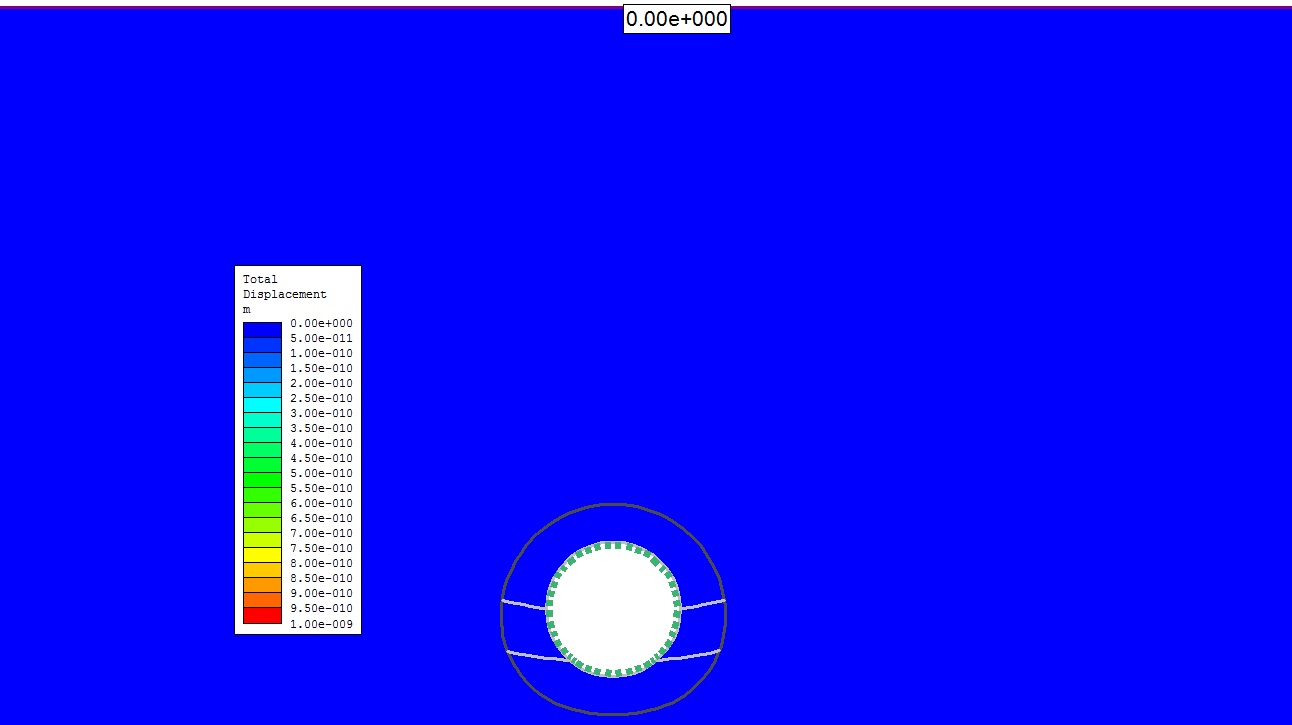
Figure 9 – 3D FEA mesh indicating the different soil layers. The central ring of the tunnel (shown in red in Figure 10) was chosen as a trial section in order to minimise edge effects. For the simulation of the rear grouting injections above this trial section similar to their actual execution, the following steps were followed:
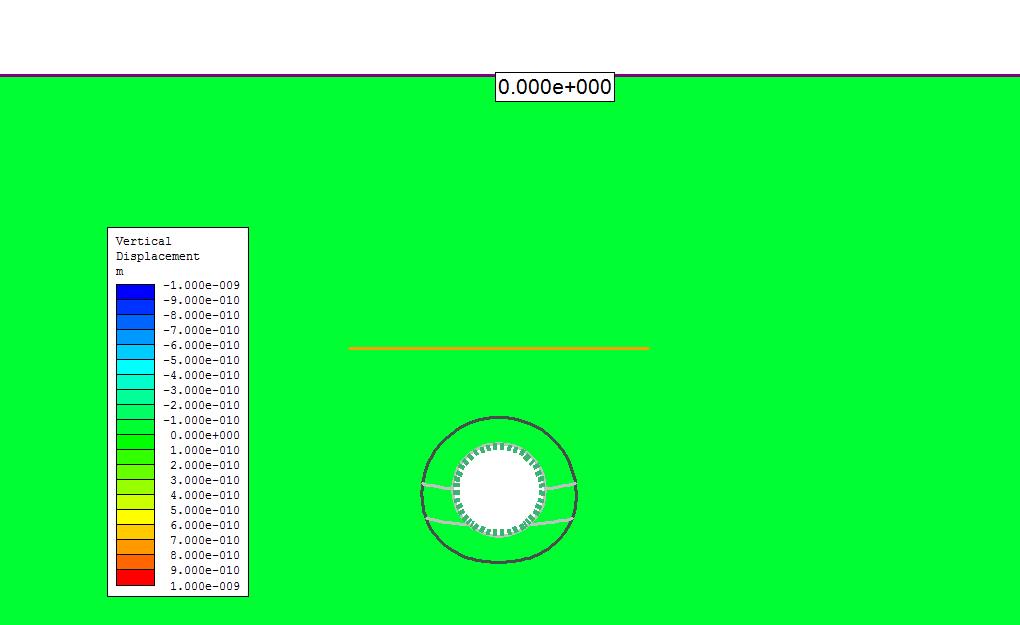
- A surface was initially introduced into the FE model, 5m above the tunnel crown.
- The surface was divided into 7 sub-sections of 1m length.
- 4 separate loading steps were carried out as shown in Figure 10: the pressure on 4 consecutive sub-sections was activated, advancing 1m forward after each step.
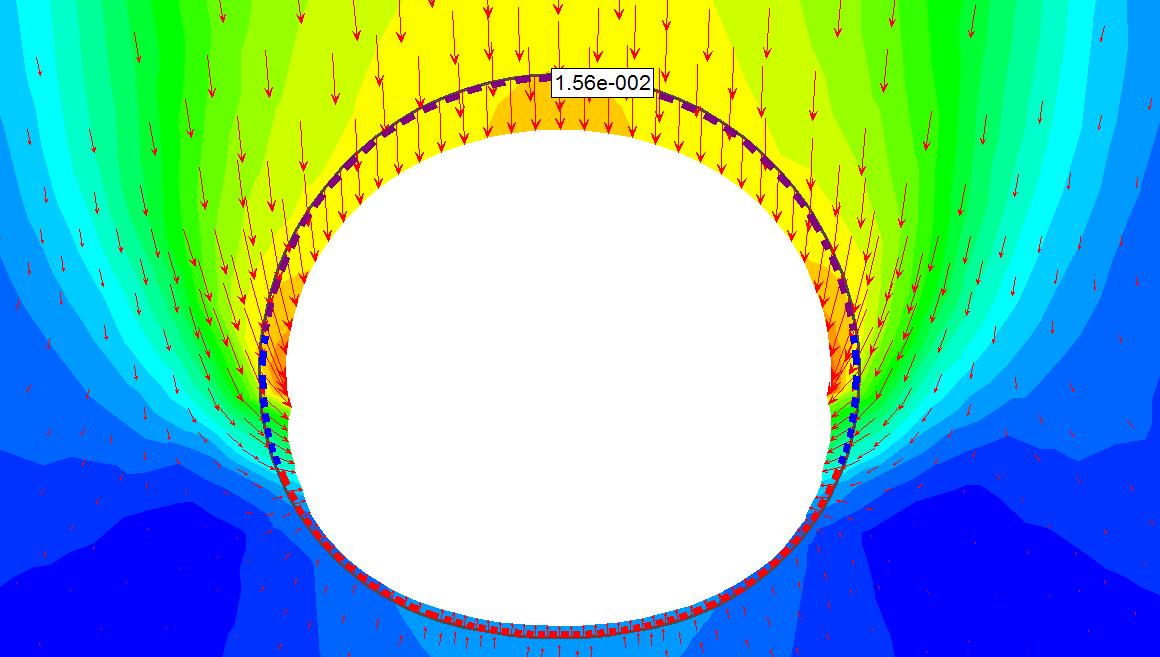
Figure 11 shows the extent of the grouting surface in relation to the trial SCL ring and the corresponding monitoring points.
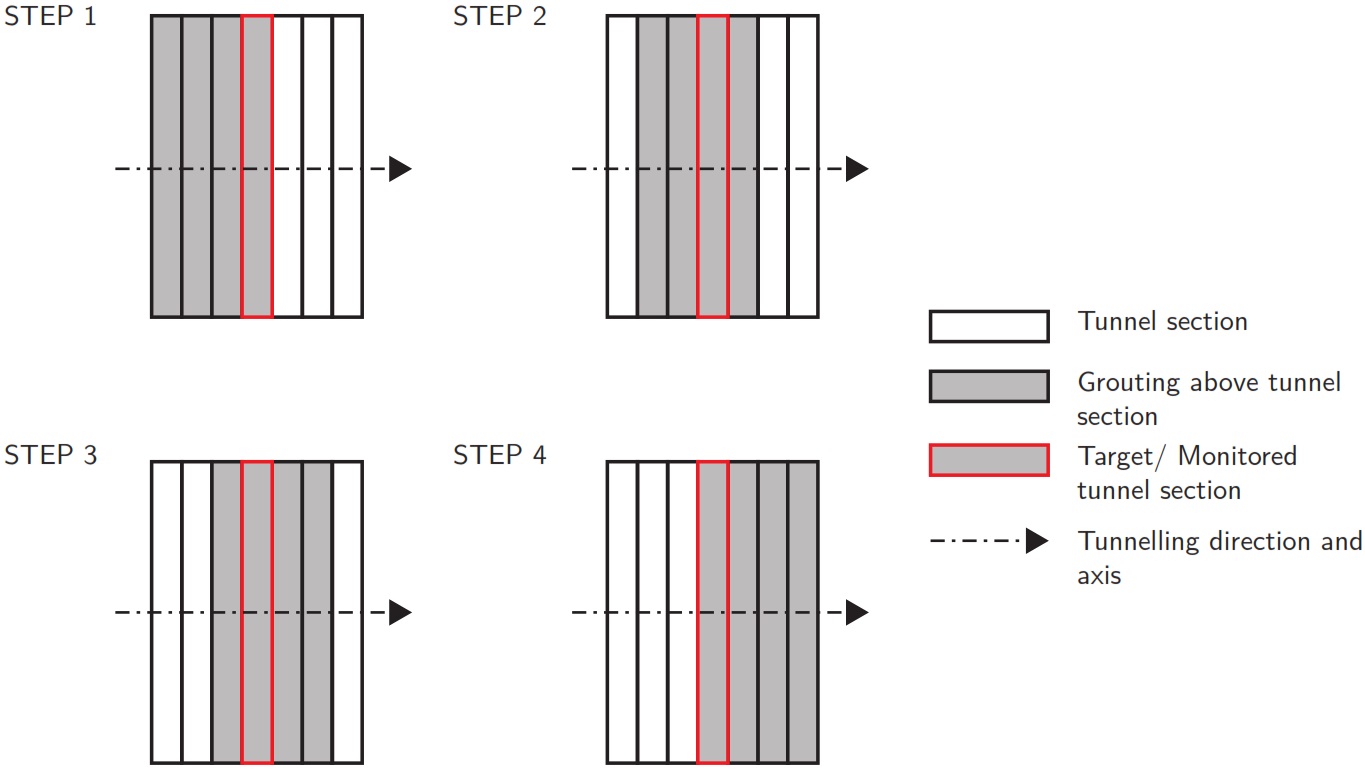
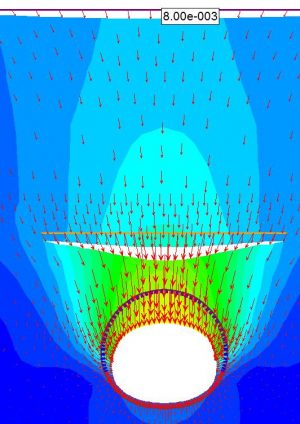
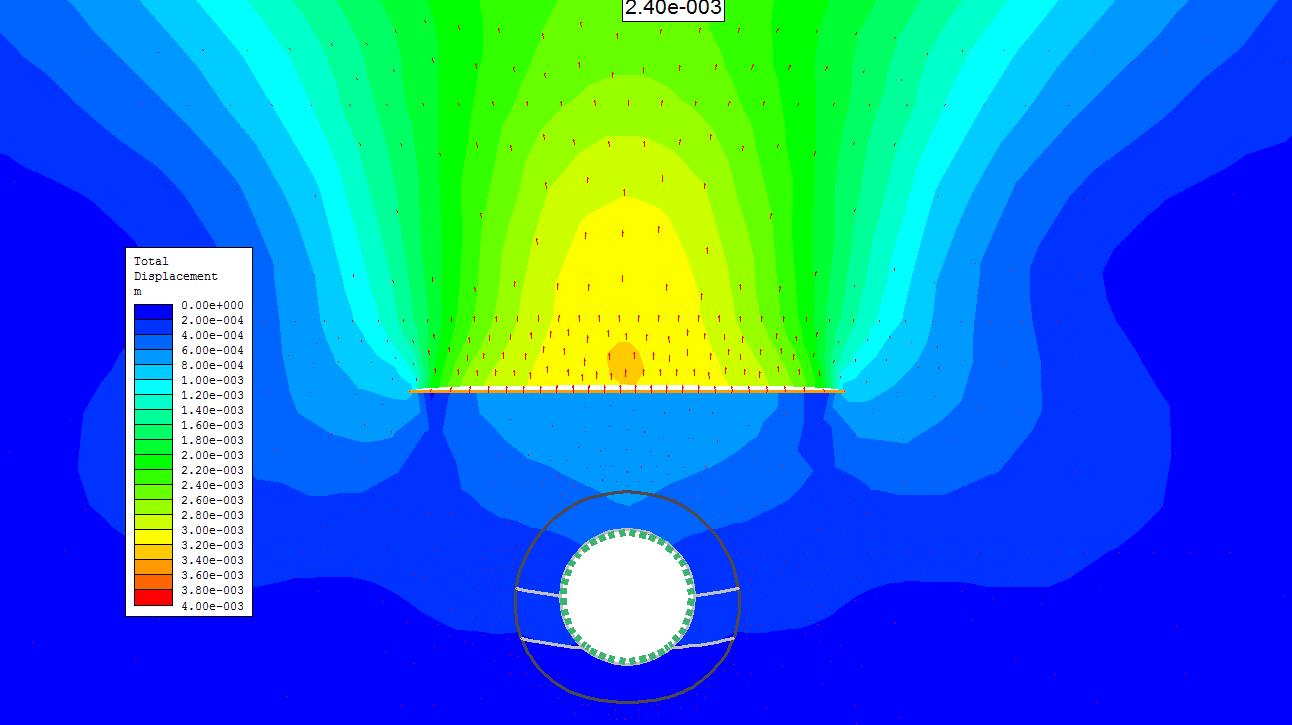
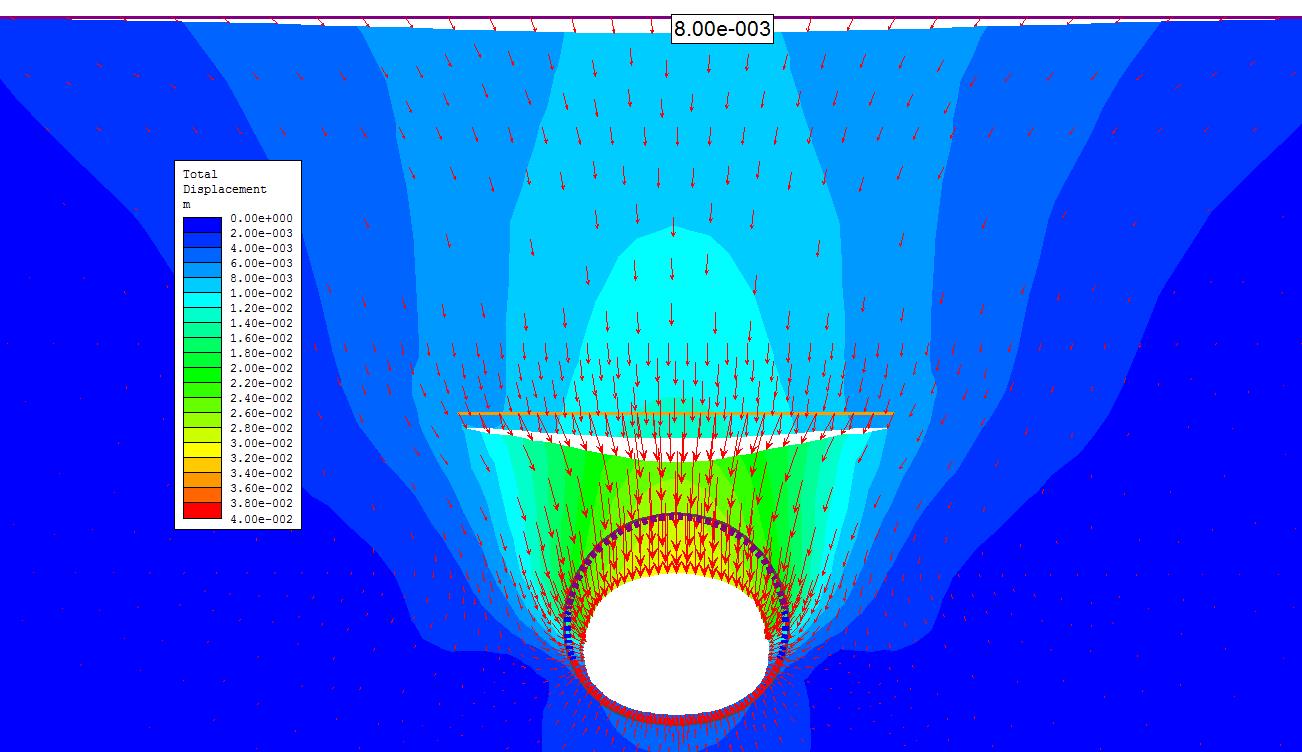
Figure 10 – Steps of simulation of the rear injection episodes. 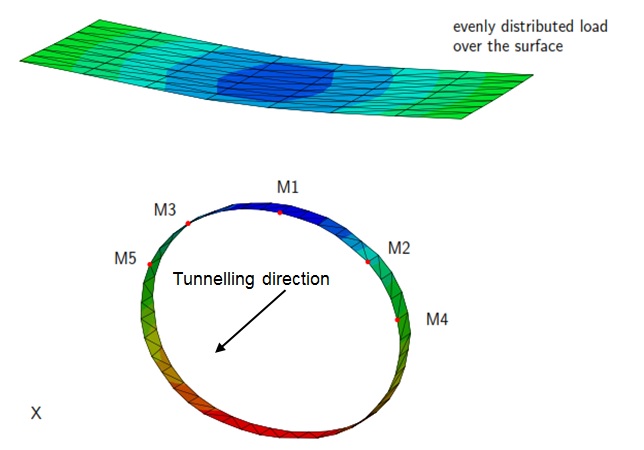
Figure 11 – Grouting application surface and central (trial) SCL ring with the corresponding monitoring points. A sensitivity analysis assessing the effect of both concrete stiffness and the magnitude of the grouting pressure was performed. For that purpose, three different values of the E modulus (3, 13 and 30GPa) and grouting pressures varying between 20 and 350kPa were tested. A total of 28 analyses were executed.
It should be noted that the E modulus values of 3 and 13GPa were tested simply for the benefit of the sensitivity analysis. However, this study assumed that the actual application of the rear injection pressures was carried out solely above shotcrete that had reached the 28-days compressive strength, hence only the results for the long-term stiffness of 30GPa were chosen for the derivation of the grouting pressures.
Table 7 shows the overall results of the sensitivity analyses. The graph of Figure 12 shows the results for pressures up to 150kPa. The 2.5mm target crown displacement was achieved (for E=30GPa) by a 50kPa pressure (in 4 episodes hence 200kPa in total) similar to the results of the 2D FEA.
Grouting pressure (kPa) E modulus of SCL 3GPa 13GPa 30GPa 20 1.9 – – 30 2.8 1.9 1.5 40 3.8 2.5 2.0 50 4.8 3.2 2.6 100 9.7 6.4 5.2 150 14.9 9.8 7.9 200 20.3 13.3 10.7 250 25.6 16.9 13.5 300 31.8 20.5 16.3 350 37.9 24.2 19.1 Table 7 – Tabulated results of the 3DFE sensitivity analyses: crown displacements for various values of grouting pressure and E-modulus.
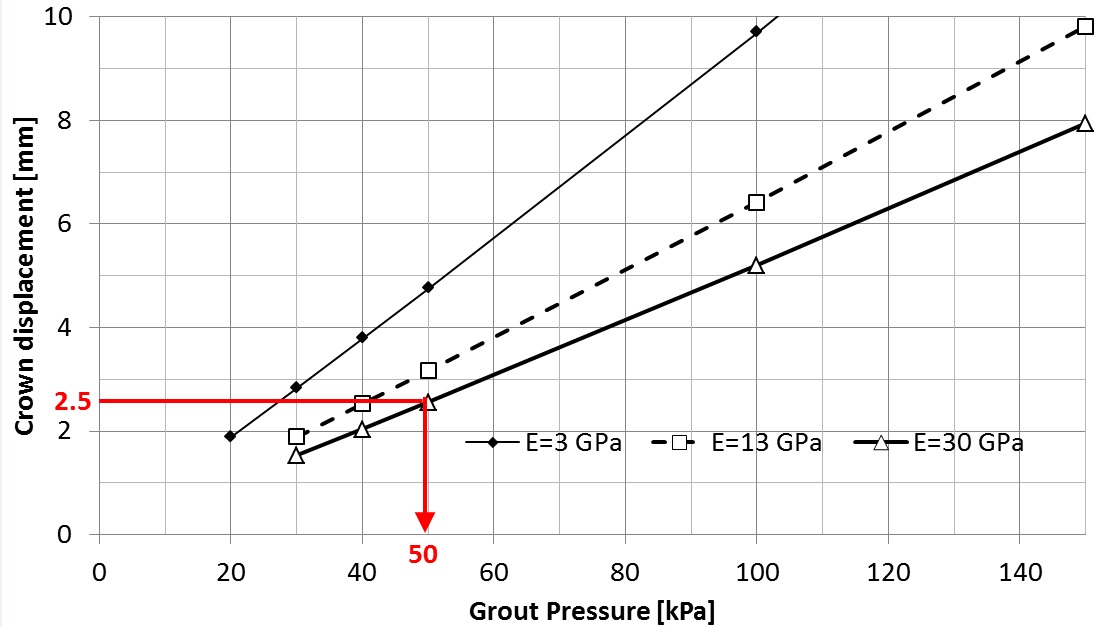
Figure 12 – Graphical representation of the results of the sensitivity analyses using 3D FE for pressures less than 150kPa. Capacity limit curves
A secondary exercise was carried out in order to assess the effect of the rear grouting injections on the structural capacity of the lining and the available safety margin. For this purpose, capacity limit curves [17] were utilised, where the normal forces and the corresponding bending moments were plotted in an interaction diagram. The capacity envelope for the shotcrete corresponds to a compressive characteristic strength of 28MPa using partial material factor of 1.5 and load safety factor of 1.4.
The results for the 50kPa grout pressure analysis (back analysed value) were plotted in the same capacity limit curve of Figure 13 with the results for the 250kPa grout pressure, which proved to be the critical value. It is obvious that the section forces in the 50kPa analysis lie well inside the bounding envelope whereas in the 250kPa analysis, the section forces are marginally inside the envelope. It can thus be concluded that a significant, additional safety margin was in place during the grouting operations (additional safety margin 250/50=5).
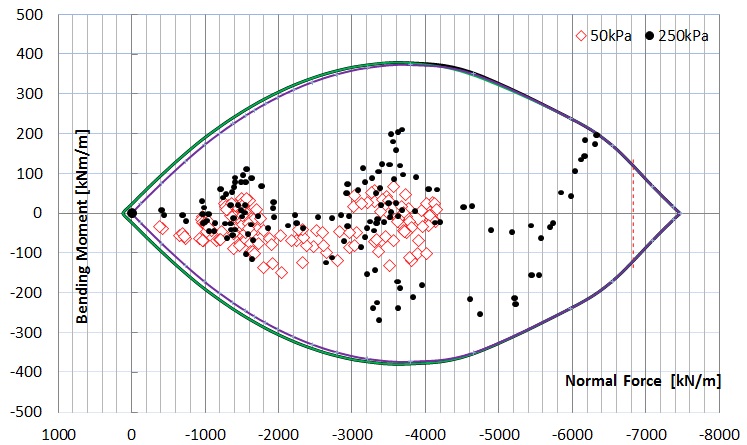
Figure 13 – Capacity limit curve for 50kPa (back analysed case) and 250kPa grouting pressure (ultimate theoretical case). Conclusions
This paper examined the effect of compensation grouting on the completed SCL platform tunnels in Farringdon station. At first a study of the in-tunnel monitoring results was performed in order to assess the additional crown displacements (2.5mm) introduced by the rear grout injections. These additional crown displacements were back calculated by means of 2D and 3D FEA in order to derive the effective grouting pressures applied 5m above the tunnel crown.
The most important outcomes are:
- The additional average displacement of the platform tunnels’ crown due to the rear grout injections was approximately 2.5mm.
- In the 2D FEA, the grouting pressure was applied as internal pressure in a joint (linear) element. In the 3D FEA only the effect on the tunnel lining was investigated by applying vertical downward pressure on a predefined surface.
- Based on the 2D FEA, the calculated maximum surface settlement due to the excavation of each platform tunnel was 12mm when no grouting was considered and 8mm with the inclusion of the front grouting injections. This 8mm settlement was then further reduced to a very low value (2mm) once the rear injections were introduced.
- A grouting pressure of 50kPa, applied in 4 consecutive stages (a total of 200kPa) was the assessed best estimate for the effective grouting pressure in the 2D FEA.
- The 3D FEA produced similar results. The detailed simulation of the stepped excavation and support of the platform tunnels as well as of the rear injection episodes, resulted in an additional 2.5mm of crown displacement for an effective grouting pressure of 50kPa (in 4 rear injection episodes hence a total of 200kPa).
- The structural capacity for the 50kPa back analysed grout pressure exhibited significant additional safety margin (equal to 5) as assessed using capacity limit curves. The critical value was found equal to 200kPa.
Caveat
Although this study presented the results of numerical analyses, it is recommended that these results be looked at in a non-numerical way. The scope of this study was to provide an order of magnitude of the effective grouting pressures as well as to prove the capability of the FE method to replicate the results of the grouting processes. However, the grouting mechanism and the stress changes that it induces in the soil are very complex and not well understood. It is likely that the pre-treatment phase introduces such significant changes in soil (fracturing, rotation of the principle stresses) that allow the subsequent concurrent grouting and grout jacking episodes to be very effective under relatively small effective pressures. In no case should this “effective” grouting pressure, which is a numerical analysis parameter, be confused or compared with the actual grouting pressures acting at the TAM ports and on the soil skeleton.
References
[1] Crossrail C435 (2013). Design Statement for Temporary SCL Works. C435-BFK-C4-XST-M123-50001.
[2] Dassault Systemes Simulia (2011). ABAQUS Analysis User’s Manual-V6.12.
[3] Franzius, J. N., Schroeder, F. C., Grammatikopoulou, A., Cabarkapa, Z., Higgins, K. G., & Potts, D. M. (2007). Comparison of Different Approaches To Model Compensation Grouting. In Proc. 10th Int. Conf on Numerical Modeling in Geomechanics-NUMOG X, Rhodes (eds GN Pande & S. Pietruszczak), Taylor and Francis Group (pp. 359-364).
[4] Gakis, A., Flynn, S. Nasekhian, A. (2014). Back analysis of observed measurements for optimised SCL tunnel design. Proceedings North American Tunnelling 2014.
[5] Gakis, A., Flynn, S., Nasekhian, A., Spyridis, P. (2015). The Role of Inverse Analysis in Tunnel Design. Tunnels and Tunnelling May 2015.
[6] Harris, D. I., Mair, R. J., Love, J. P., Taylor, R. N., & Henderson, T. O. (1994). Observations of ground and structure movements for compensation grouting during tunnel construction at Waterloo station. Geotechnique, 44(4), 691-713.
[7] Harris, D. I., Sismondi, S., Weinmar, W. (2015). Review of Ground Movements during SCL Tunnelling in an Urban Environment. Proceedings of the World Tunnel Congress 2015: Promoting Tunnelling in SEE Region. Dubrovnik, Croatia.
[8] Health and Safety Executive (HSE) (1994). The Collapse of NATM Tunnels at Heathrow Airport. (HSE) Books, Sudbury, UK.
[9] John, M., & Mattle, B. (2003). Shotcrete Lining Design: Factors of Influence. Proc. RETC.
[10] Kettle, C. (2012). Compensation Grouting – Evolution, Field of Application, and Current State of the Art in UK Practice. Grouting and Deep Mixing 2012: pp. 134-199.
[11] Kimmance, J. P., & Allen, R. (1996). The NATM and compensation grouting trial at Redcross Way. In Proceedings of the International Symposium on Geotechnical Aspects of Underground Construction in Soft Ground, London (pp. 385-390).
[12] Kovacevic, N., Edmonds, H. E., Mair, R. J., Higgins, K. G., & Potts, D. M. (1996). Numerical modelling of the NATM and compensation grouting trial at Redcross Way. In Provc. 4th Int. Symposium of International Conference of Geotechnical Aspects on Underground Construction in Soft (pp. 553-559). AA Balkema.
[13] Lee, S. W., Dasari, G. R., Mair, R. J., Bolton, M. D., Soga, K., Sugiyama, T., & Nomoto, M. (1999). The effects of compensation grouting on segmental tunnel linings. Proceedings of the International Geotechnical Aspects of Underground Construction in Soft Ground, 3, 257-262.
[14] Linney, L. F., & Essler, R. D. (1994). Compensation grouting trial works at Redcross Way, London. Grouting in the Ground, London, 313-326.
[15] Poettler, R. (1990). Time-dependent rock—Shotcrete interaction a numerical shortcut. Computers and geotechnics, 9(3), 149-169.
[16] Potts, D. M. & Zdravković, L. (2001).Finite element analysis in geotechnical engineering: application (Vol. 2). Thomas Telford.
[17] Sauer, G., Gall, V., Bauer, E., and Dietmaier, P. (1994). Design of tunnel concrete linings using limit capacity curves. In: Siriwardane & Zaman (eds) Computer Methods and Advances in Geomechanics, Rotterdam. pp. 2621 – 2626.
[18] Wittke, W., Pierau, B., & Erichsen, C. (2006). New Austrian Tunneling Method (NATM)—stability analysis and design. WBI, Essen.
-
Authors

Angelos Gakis Dr. Dipl-Ing, MSc DIC, CEng MICE - Dr Sauer & Partners Ltd
Chief Geotechnical Engineer, Crossrail Farringdon Station
Thomas Schwind BSc - Dr Sauer & Partners Ltd
Technical Director, Dr. Sauer & Partners
