Tunnelling in sand in Farringdon Crossrail Station
Document
type: Technical Paper
Author:
Angelos Gakis Dr. Dipl-Ing, MSc DIC, CEng MICE, Michael Orsario, Noel Cooper, Borja Trashorras
Publication
Date: 31/08/2016
-
Read the full document
Notation
BFK BAM, Ferrovial, Kier Joint Venture, the main contractor
DSP Dr. Sauer & Partners, BFK’s specialist SCL designer
LSB Lower Shelly Beds
LTB Laminated Beds
LMB Lower Mottled Beds
MLGH Mid Lambeth Group Hiatus
PTE, PTW Platform Tunnel east, west
RES(S) Required Excavation and Support (Sheet)
SCL Sprayed Concrete Lining
TAM Tube-a-Manchette
TBM Tunnel Boring Machine
UF Upnor Formation
UMB Upper Mottled BedsIntroduction
Farringdon is one of Crossrail’s major underground stations in central London, set in between the future Liverpool Street and Tottenham Court Road stations. The layout of the station includes two main platform tunnels, eight cross passages, two escalator tunnels with their lower chambers, two ventilation tunnels and four stub tunnels (see Figure 1). The platform tunnels, approximately 300m long each and 10.6m high and 11.4m wide, were enlarged from the previously built TBM tunnels using sprayed concrete lining (SCL) methods. The excavation works for the SCL tunnels were completed in September 2015. BFK joint venture (BAM, Ferrovial Kier) was the main contractor and Dr. Sauer & Partners their SCL specialist designer, responsible for the SCL works prior to ring closure.
The main risks with relation to the SCL tunnelling arose from the interbedded and randomly distributed sand lenses in the Lambeth Group. Although the clayey units of the Lambeth proved to be an ideal tunnelling medium, the sand lenses, water-bearing in their majority and 3m thick in most encounters, required extensive treatment prior to the safe advance of the excavation.
The following sections present two specific cases where sand lenses were encountered during the course of works in both platform tunnel west (PTW) and east (PTE). The implemented mitigation measures that enabled the safe execution of the tunnelling works as well as the considerations that led to the specific solutions are described.
Geology in Farringdon
The tunnelling works in Farringdon were executed mostly in the Lambeth Group formations (ca. 85%) and to a lesser extent in London Clay and Thanet Sand units. The Lambeth Group comprises variable, over-consolidated sediments, ranging from stiff to very stiff clays and silts to dense sands and gravels as well as interbedded sand lenses. The typical units of the Lambeth group encountered in Farringdon are shown in Figure 2.
Five faults were encountered during the tunnelling works (shown in Figure 1 at platform level):
- Farringdon Fault – dipping to the west with a vertical throw of 1 to 2m.
- Smithfield Fault – dipping to the east with a vertical throw of 7 to 9m.
- John’s Street Fault – dipping to the west with a vertical throw of 0.8 to 1.2m.
- Lindsey Street Fault – dipping to the west with a vertical throw of 0.8 to 1.2m.
- Charterhouse Fault – dipping to the east with a vertical throw of 4 to 5m.
Although some deterioration of the soil properties was expected in the faulted zones, no actual effects were visible. In fact, the exposed tunnel faces were as stable inside the zones of influence of faulting as they were outside and the measured convergence of the SCL lining was comparable.
Due to the complexity of the geological conditions, a “real-time” 3D geological model was developed for the area of Farringdon station providing a continuously updated conceptual ground model [1].
The variability and uncertainty of the geological conditions as well as the geotechnical risk arising from the potentially water-bearing sand units rendered the decision-making during the tunnelling works critical.
Sand Lenses
Lambeth Group clay units have been ideal for open face excavation tunnelling, exhibiting significant stand-up time in the exposed faces and only minor, localised instabilities. Interbedded sand lenses were however encountered in both Upper Mottled Beds (UMB) and Lower Mottled Beds (LMB). The sand lenses of the LMB were dry to moist due to the under-drained pore pressure profile of the area, which is attributed to the historical water abstraction from the lower aquifer. The sand lenses in the UMB on the other hand were water-bearing in most of the encounters with a maximum measured pore-water pressure equal to 100kPa (1bar).
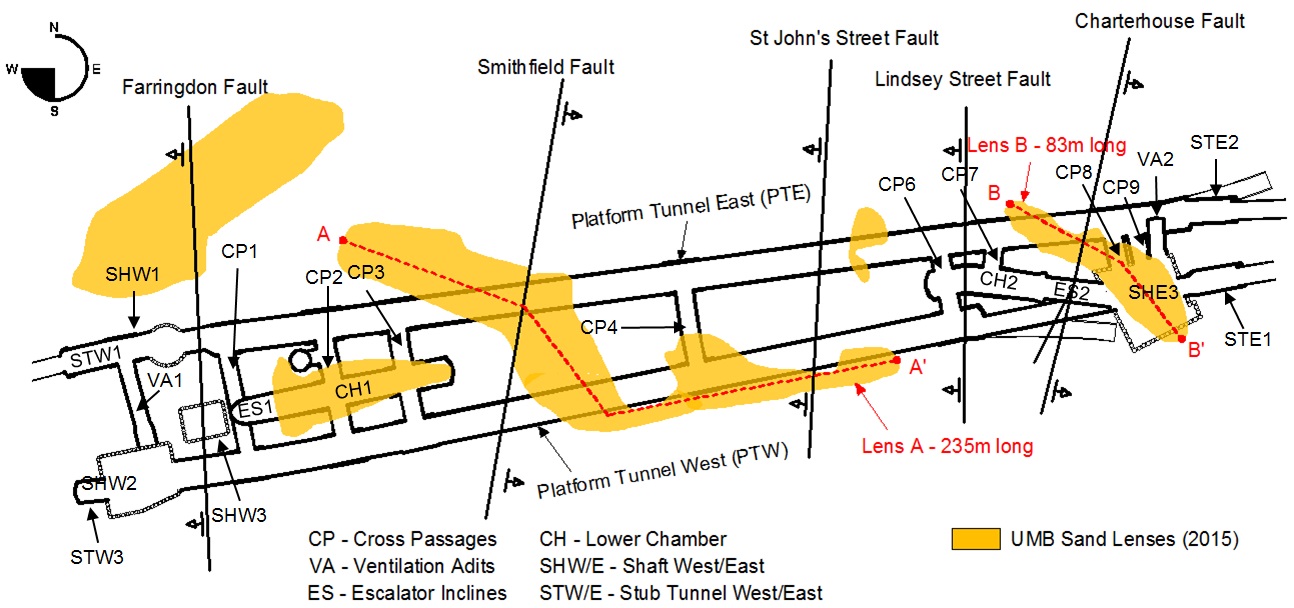
Figure 1 – Sand lenses in the Upper Mottled Beds (UMB) assessed after the end of the SCL works. The distribution of the sand lenses in the UMB as assessed after the completion of the SCL works is shown in Figure 1. Two major sand lenses were encountered during the tunnelling works in Farringdon, shown as “Lens A” and “Lens B”. Both required extensive treatment to allow a safe execution of the SCL works.
Lens A, which was in total 235 running metres long and approximately 3m thick, was mainly encountered in the lower part of the top heading and in the bench excavations in PTW, between Smithfield Fault and St John’s Street Fault. Lens B, which was 83 running metres long and approximately 3m thick, was encountered in and above the crown of the enlargement, at the east end of PTE. Both lenses dipped from north-west to south-east.
Samples from these lenses were collected and grading analyses were carried out. The results indicated that the sand had generally higher fine content at the top of the lens (fine silty sand) becoming clean, medium sand towards its base as shown in the particle size distribution curves of Figure 3.
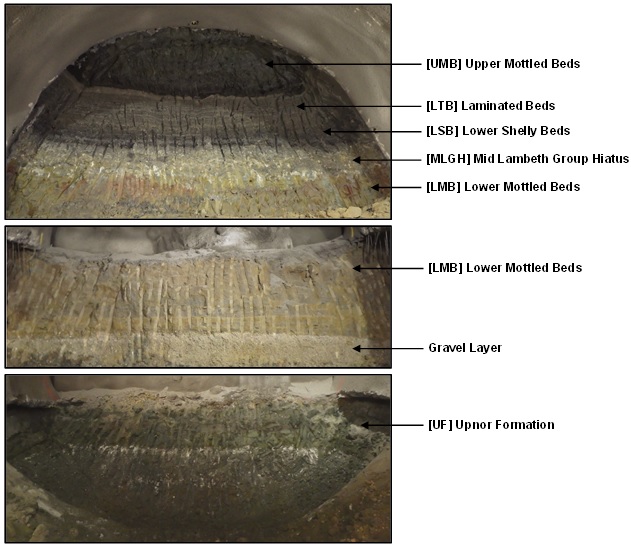
Figure 2 – Sub-units of the Lambeth Group encountered in Farringdon. 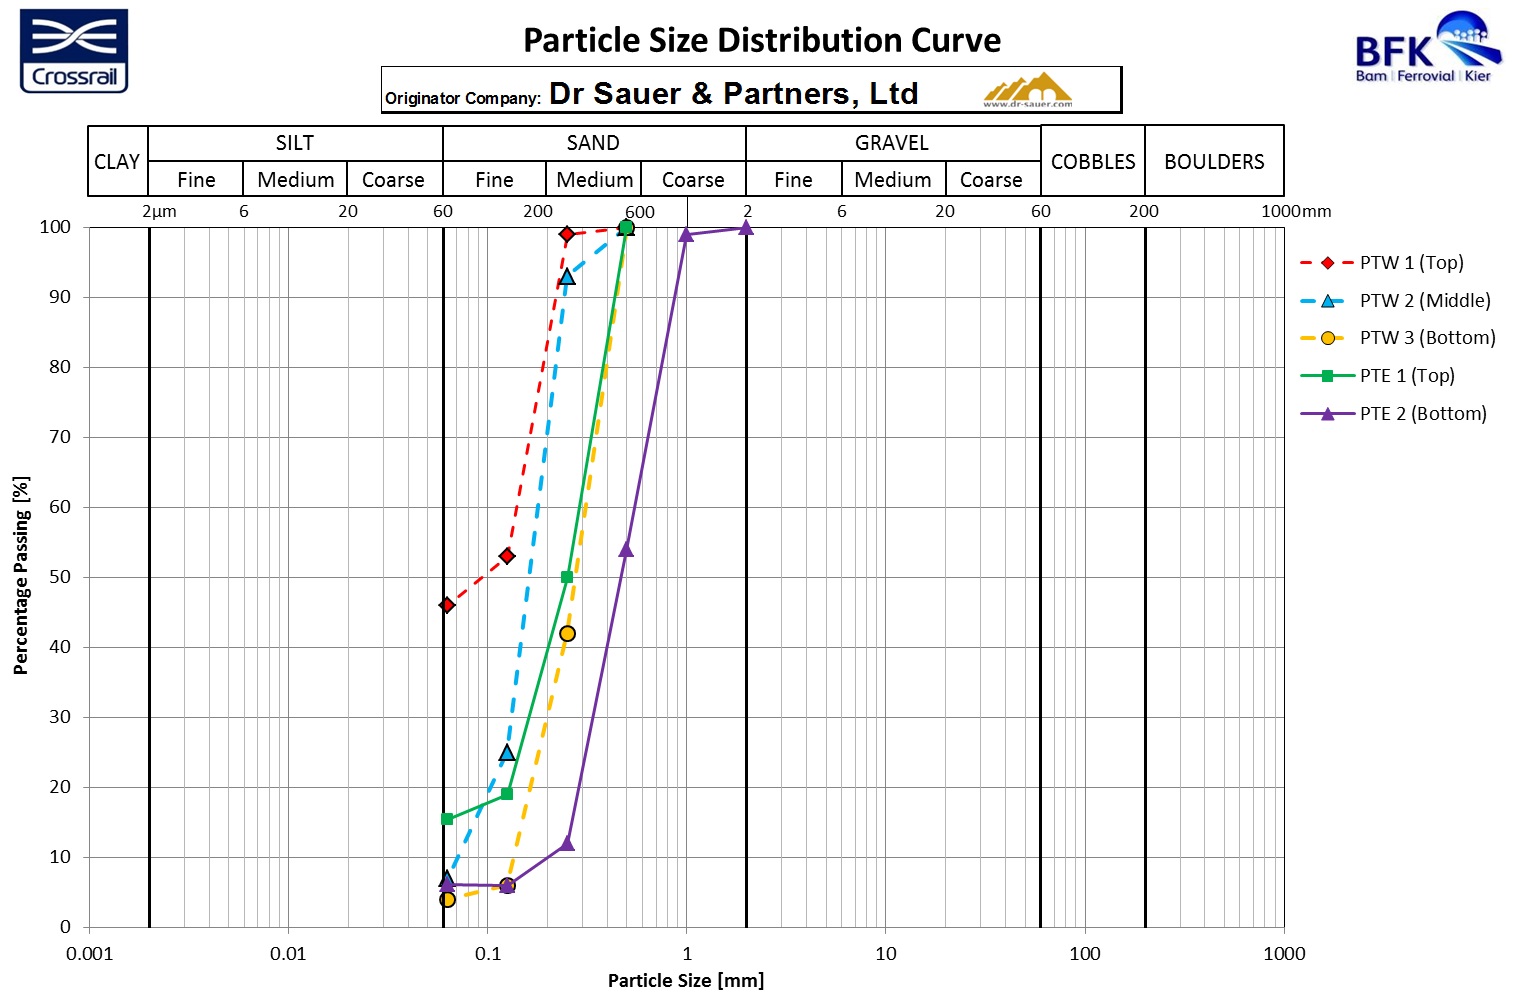
Figure 3 – Particle size distribution curves from samples collected in several positions inside the sand lens in PTW and PTE. Mitigation measures
Several pre-defined toolbox items were deployed to respond to the unforeseen ground conditions encountered during the excavation of the SCL tunnels inside the two sand lenses described in the previous section. These items had either the form of ground treatment (depressurisation and chemical grouting), implemented ahead of the commencement of the excavation or of roof / face support (spiles, pocket excavation), applied right before or during the actual excavation.
The implementation of the toolbox items was managed through the required excavation and support (RES) process in accordance with the BFK Construction Management Plan. The decision-making process included the evaluation of the latest geotechnical information such as face maps of previous advances, probing results, pumping records, monitoring data, the review of the 3D geological model, latest shift reports, sprayed concrete early strength results, compensation grouting data. The decision was detailed and formalised on the Required Excavation and Support Sheet (RESS).
In-tunnel depressurisation
In-tunnel depressurisation included the installation of wellpoints at specific spacing through the existing TBM tunnel lining and in certain cases through the completed primary lining, in order to target the sand lenses. The wellpoints were connected to a vacuum pump which enabled water pumping under constant pressure or flow rate. In Farringdon the decision was made to maintain a constant vacuum pressure of approximately 0.6 bar following small scale trials. All the drillings were performed with appropriate means for the control of ground water in case of significant seepage (stuffing boxes and inflatable packers).
Chemical Grouting
Chemical grouting involved the injection of a sodium silicate-accelerator mix through tube-a-manchette (TAM) pipes under low pressure, targeting the water-bearing sand units. The objective was to reduce the permeability and increase the strength of the granular material.
Pocket Excavation
Pocket excavation refers to the division of the face excavation into smaller sections. The objective was to control the stability of the ground with reduced stand-up time and to allow a more rapid initial support installation. In general it may range from a vertical division into two pockets (split-face) to numerous small pockets.
Grouted Spiles
Refers to perforated steel pipes, rammed or installed in pre-drilled holes or self-drilling pipes with a lost drill bit. They were installed above the crown of the tunnel and extended ahead of the face to enhance roof stability. The injection of suitable grout should improve the stability of the ground and reduce the permeability of non-cohesive material. The distance between the spiles may generally be adjusted to the ground conditions.
Case A: Westbound platform tunnel
Problem description
Based on the in-tunnel probing results (see Figure 4) and the updated 3D geological model in the area of the platform tunnel west, a succession of sand lenses was expected to be encountered between TM 131 and TM 265. Although there was no encounter of the sand lens during the enlargement works west of Smithfield Fault, the approximately 7.5m down-throw of the fault moved these lenses in the lower part of the top heading and bench excavations of the tunnel. A certain level of hydraulic continuity was implied by the significant horizontal extent and thickness of the lenses.
Preliminary testing during the in-tunnel probing revealed a maximum water pressure of 0.7bar (70kPa), which dropped significantly (to 0.2-0.1bar) once free gravitational flow was allowed. Maximum free flow rates of 7l/min were measured through the hose of the packers used to safely seal the open holes.
Considerations
In order to facilitate the enlargement of PTW, the design requirement was to reduce the residual pore-water pressure in the sand to less than 10kPa and any flow rate from drilled holes (typically 100mm diameter) to less than 3l/min prior to the advance of the excavation. The sand lenses were expected to be encountered in the lower part of the top heading and in the bench excavations, positions that were considered as moderately unfavourable.
Two alternative ground treatment solutions were investigated by the contractor: an in-tunnel depressurisation scheme utilising vacuum-aided depressurisation through wellpoints and two grouting schemes, introducing either cementitious grout or chemical grout injections. These solutions were compared based on the total programme impacts, their cost, the subsequent construction impacts and health and safety considerations. Small-scale trials were also performed to assess the efficiency of each method in the site-specific conditions. After the comparative assessment, in-tunnel depressurisation qualified as the optimal solution.
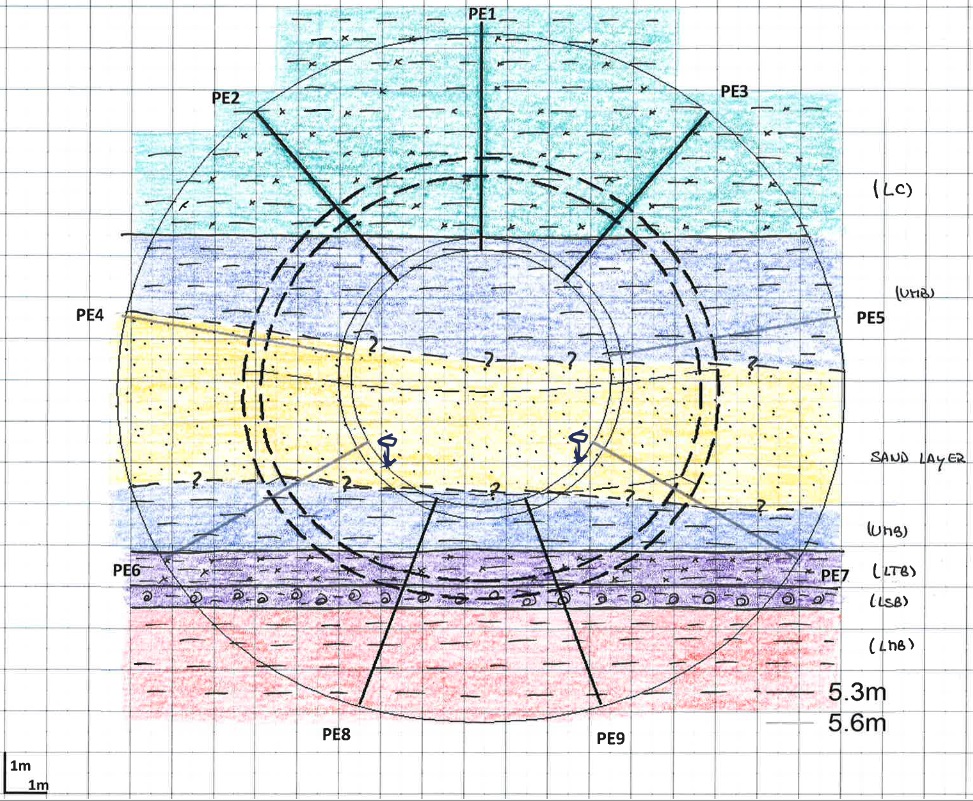
Figure 4 – Expected ground conditions in PTW TM 149.2 based on in-tunnel probing results. At the top is the London Clay followed by the Upper Mottled Clay with an interbedded sand lens, 3 to 3.5m thick. At the bottom are the Laminated Beds, the Lower Shelly Beds and the Lower Mottled Clay. Ground treatment
The in-tunnel depressurisation scheme for PTW included the installation of 106 wellpoint, from the TBM tunnel, distributed in both sides with every 10th wellpoint being used as a piezometer. Pumping was performed under constant vacuum pressure (0.6 bar).
The details of the in-tunnel depressurisation installations are summarised in Table 1 and the locations of the installed wellpoints are shown in Figure 5. Figure 6 shows the installed wellpoints inside the TBM tunnel.
Installation location Both sides of the TBM pilot tunnel. Typically installed through the lining or just below the tunnel axis, inclined downwards to intercept the Sand/Clay interface, approximately 3.5 to 4.0m beyond the enlargement envelope. Spacing 3m. Quantity 80No wellpoints in total installed along both sides in the TBM tunnel with a standpipe piezometer every 10th wellpoint. Length 6 to 8m. Bore Size 76mm internal diameter (lost drill bit) or 90mm (open hole). Completion 38mm internal diameter PVC liner (lost drill bit) or 25mm (open hole). Screen Length/Type 2m length, slotted or resin-bonded filter sand. Annulus Backfill Grout seal through tunnel lining only. Drilling Equipment Track mounted rotary drilling rig (5T or 10T depending on the level and the inclination) Pumping Equipment Duty and standby vacuum pumps. Table 1 – Details of in-tunnel depressurisation installations in PTW.
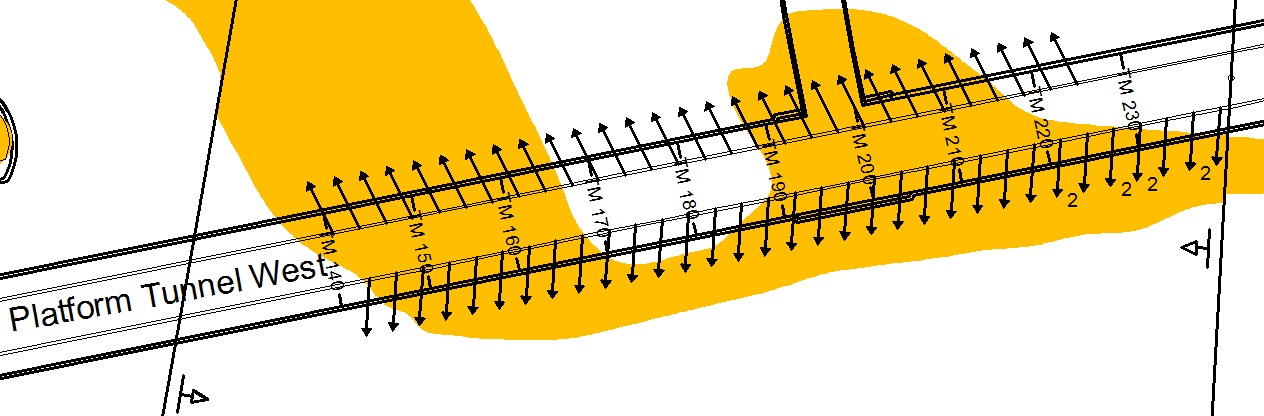
Figure 5 – Location of the wellpoints installed in PTW. After vacuum pumping under constant pressure of 0.6bar was maintained for a period of approximately 2 weeks, the pumping rate dropped from an initial value of 15l/min to a stable value of 4l/min as shown in Figure 7. The additional drop of the pumped flow rate that is observed in the graph is due to the advancing of the tunnel works and the decommissioning of the wellpoints behind the excavated face.
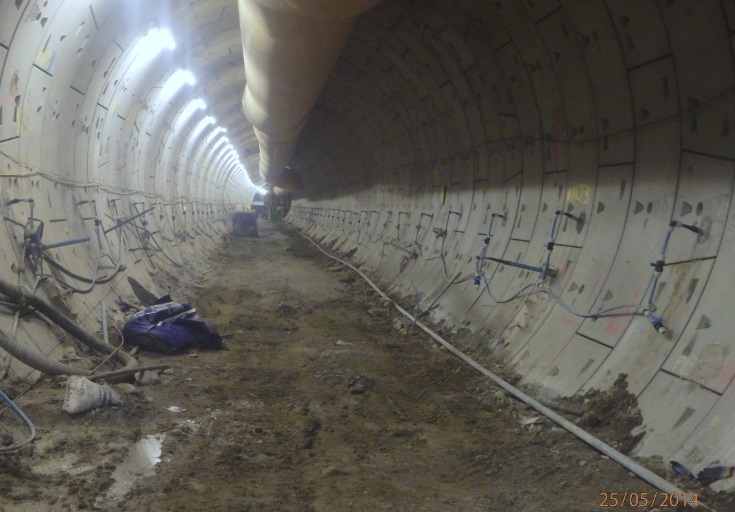
Figure 6 – Wellpoints installed in PTW. 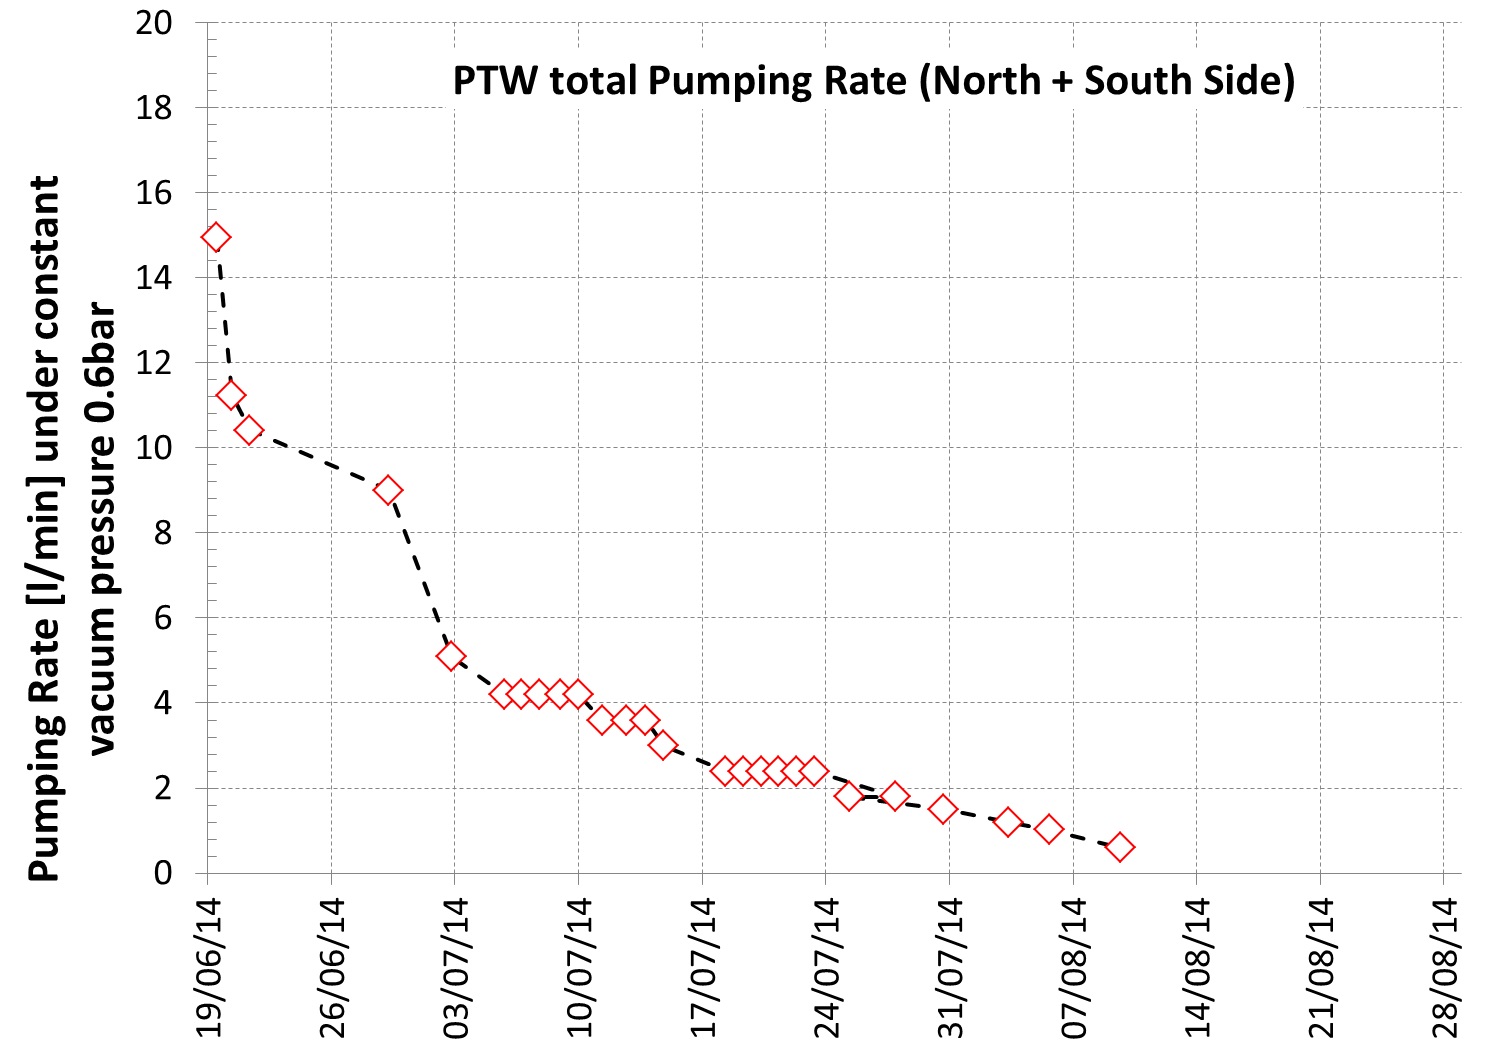
Figure 7 – Pumping rate (l/min) under constant pressure with time in PTW. Excavation and support
Once a steady flow rate was achieved, it was considered safe to proceed with the excavation works inside the area of the sand lens with vacuum pumping operational. In order to achieve enhanced stand-up time of the exposed sand, it was decided that the excavation would be performed in four pockets. Each pocket was excavated and subsequently sealed with an initial, 75mm thick shotcrete lining. The exact division of the face was decided in the daily RES meetings and detailed on the corresponding RESS after an examination of the depressurisation and ground investigation data and the agreement between all the signatories.
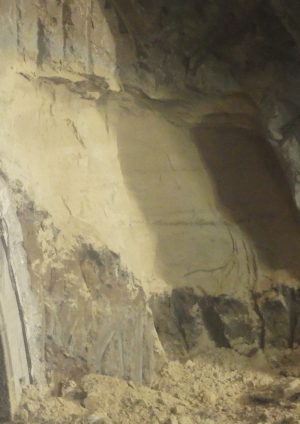
Figure 8 shows the face map from a top heading excavation (TM 156 in PTW) and Figure 9 shows a close up of the excavated sand. The depressurisation and the implementation of the pocket excavation resulted in a stable excavated face. The treated sand itself exhibited a significant stand-up time with only minor, superficial ravelling.
An advance rate of approximately 1.8m/day was achieved inside the treated area.
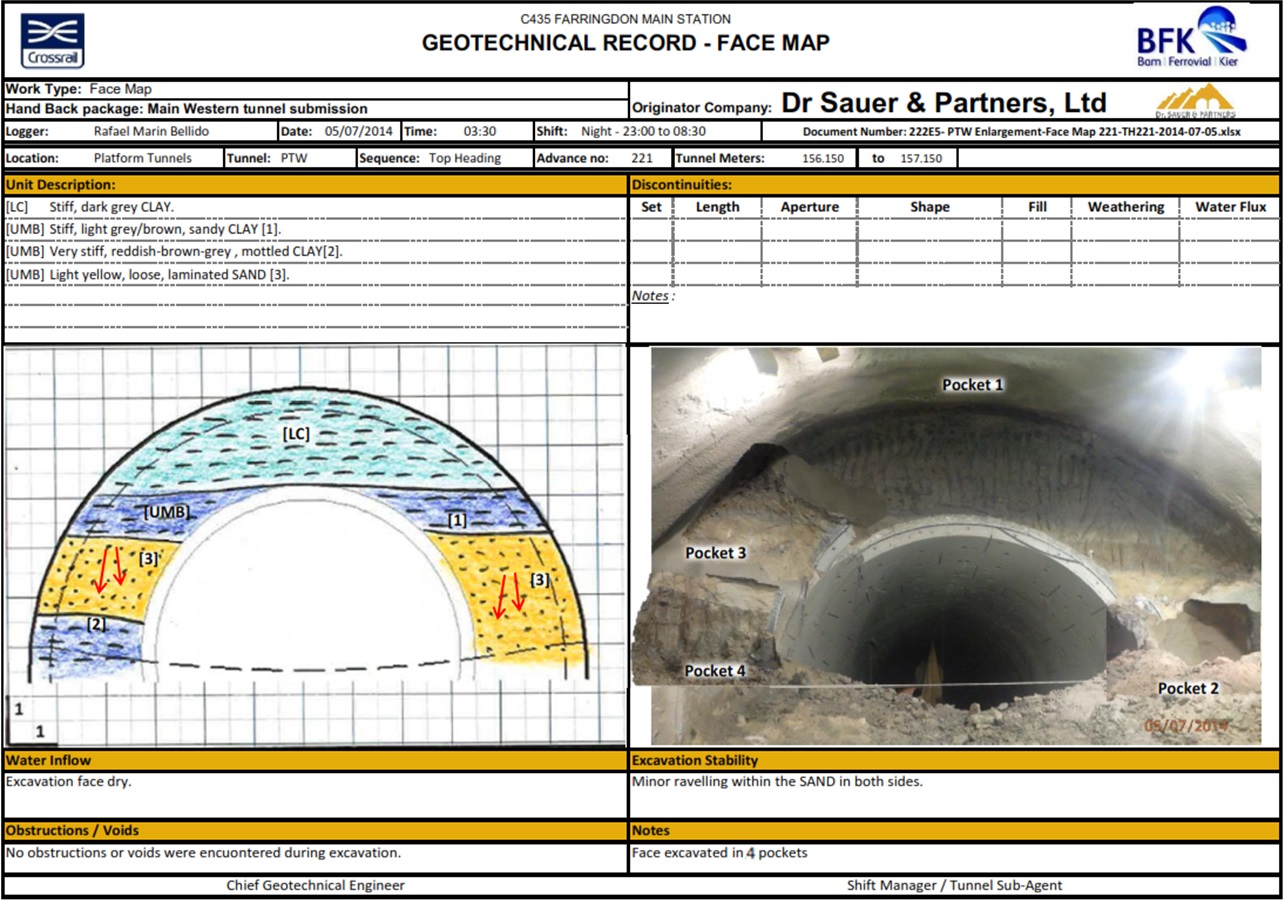
Figure 8 – Face map of top heading excavation in PTW TM 156.2 after the depressurisation implementation. 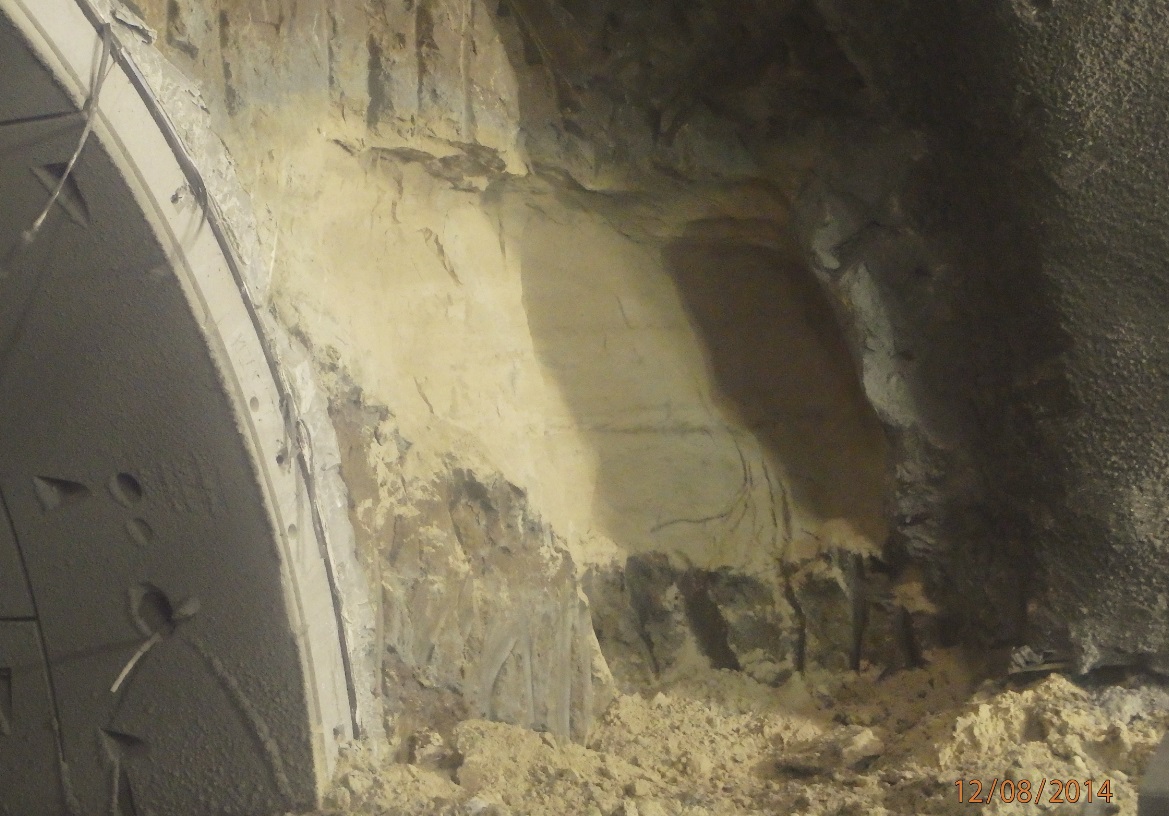
Figure 9 – Exposed sand lens in PTW TM 156. The sand has been depressurised and exhibited adequate stand-up time with minor superficial ravelling. Case B: Eastbound platform tunnel
Problem description
The sand lens in PTE was expected to be encountered in a significantly unfavourable position for the sequential, open face excavation. Detailed in-tunnel probing results (see Figure 10) implied that the sand units would be mainly located in and above the crown of the planned enlargement. Additionally a maximum water pressure equal to 1bar (100kPa) was measured during probing. This condition was expected to be encountered between TM 290 and TM 315 of PTE. After TM 315, the presence of Charterhouse Fault was expected to move the sand lenses 4 to 5m lower, placing them inside the bench excavations, in a more favourable position. Furthermore, through the examination of the updated conceptual model provided by the 3D geological model [1] it was assessed that the sand body would present a certain continuity and would dip from north-west to south-east.
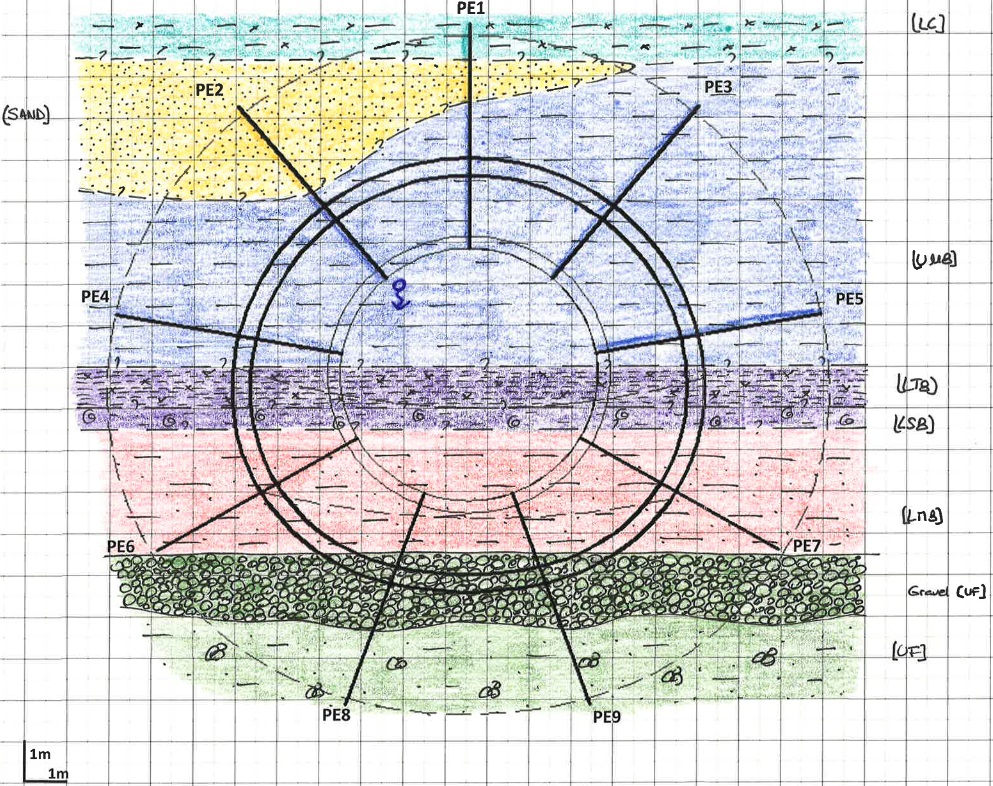
Figure 10 – Expected ground conditions in PTE TM 296.1 based on in-tunnel probing results. At the top is the London Clay followed by the Upper Mottled Clay with an interbedded sand lens, 3m thick, followed by the Laminated Beds, the Lower Shelly Beds and the Lower Mottled Clay. At the bottom is the Upnor Formation (Gravels and clayey Sand). Considerations
A solution had to be found to reduce the risk to a level as low as reasonably practicable, satisfying the design requirements for maximum water pressure (10kPa) and flow rates (3l/min) without introducing severe delays to the project.
A two-step solution was proposed: At first the water-bearing sand lens would be depressurised by vacuum pumping through in-tunnel wellpoints. Subsequently, a sodium silicate grout would be injected in the sand in order to reduce its permeability and increase its strength.
Ground treatment
Depressurisation
The in-tunnel depressurisation scheme for PTE included the installation of 21 wellpoints, 6 in the north side and 15 in the south side of PTE. Two of the north wells were installed through the completed primary lining, behind the tunnel face. This provided the benefit of targeting the sand lens at its highest points and making it possible to maintain this active dewatering operational at all times.
The details of the in-tunnel depressurisation installations are summarised in Table 2 and the plan view showing the installed wellpoints is shown in Figure 11. The installed wellpoints in the north side of the TBM tunnel are shown in Figure 12 (left).
Installation location Both sides of the TBM pilot tunnel. Most of them installed through the segmental lining above the tunnel axis, inclined downwards or upwards to intercept the Sand/Clay interface, approximately 3.5 to 4.0m beyond the enlargement envelope. Two wells were installed through the primary lining of the enlarged platform, prior to the location of the sand lens in order to remain functional during the subsequent enlargement. Spacing 3m. Quantity 21No wellpoints in total. Length 6 to 12m. Bore Size 76mm internal diameter (lost drill bit) or 90mm (open hole). Completion 38mm internal diameter PVC liner (lost drill bit) or 25mm (open hole). Screen Length/Type 2m length, slotted or resin-bonded filter sand. Annulus Backfill Grout seal through tunnel lining only. Drilling Equipment Track mounted rotary drilling rig (5T or 10T depending on the level and the inclination) Pumping Equipment Duty and standby vacuum pumps. Table 2 – Details of in-tunnel depressurisation installations in PTE.
Chemical grouting
After the completion of the wellpoint installations and a period of trials, pumping was temporarily halted to allow for the installations for the chemical injections. In total 141 holes, 5m long were auger drilled and logged. Sand was encountered in 78 of them sand and TAMs were installed for the subsequent injections.
The philosophy of the chemical grouting was to inject a low viscosity sodium silicate/water/accelerator mix, under low pressure, in order to reduce the permeability and increase the undrained shear strength of the sand. The chemical reaction of the mix is expressed as:

Where:
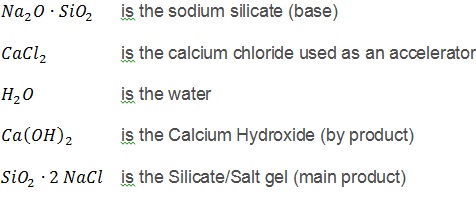 The weight ratio of the sodium silicate (
 ) was 3.3. When mixed with the accelerator and water it was expected to instantaneously yield an adhesive gel that would fill the pores of the sand [2] reducing its permeability and increasing its strength. The expected unconfined compressive strength was 1MPa (implying an undrained shear strength of 500kPa).
The details of the chemical grouting installations are summarised in Table 3.
The performance control criteria for the injections that were performed in two phases were:
- Grout would be injected from each port until either the pressure reached 3bar or the total injected volume reached 100l (phase A).
- In a second round (phase B), the ports where the maximum pressure was less than 2bar would be re-injected until either the pressure reached 3bar or the total injected volume reached 50l.
Installation location Installed in the crown of the TBM tunnel. Spacing 10o radially (per section) and 1m in longitudinally (1x1m grid). Max injection rate 5l/min Max injection volume 100 l/port Max injection pressure 3 bar Injection ports 3 ports per metre of TAM, 12 ports per TAM in total Quantity 78No. TAMs installed Length 5m (a minimum 2.5m beyond the enlargement outline) Bore Size 90mm internal diameter (open hole) Completion PVC pipes 40mm internal diameter with non-return valves (TAMs) Annulus Backfill Grout seal through tunnel lining only. Drilling Equipment Track mounted 11T rotary drilling rig. Pumping Equipment Portable grout pump (max pressure 60bar). Mix Sodium silicate – Calcium Chloride – Water Table 3 – Details of the chemical grout injections in PTE.
Figure 11 shows the position of the tips of the injected TAMs. In total approximately 55m3 where injected during phase A and another 45m3 during phase B. The injection tubes are shown in Figure 12 (right).
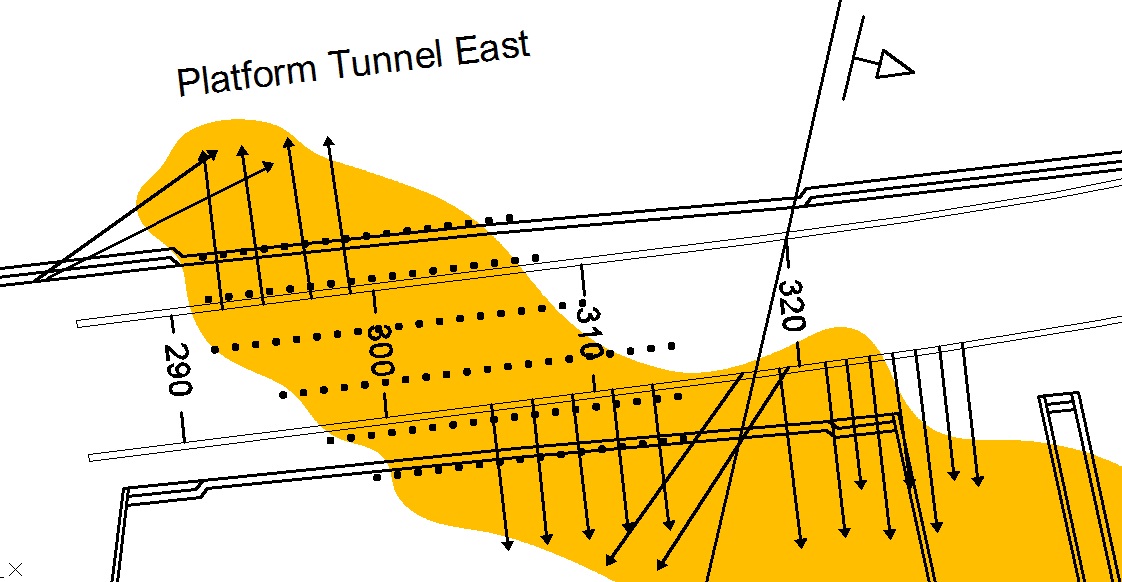
Figure 11 – Location of wellpoints (arrows) and chemical grout injections (dots) in PTE. The circles indicate the end points of the drillings. 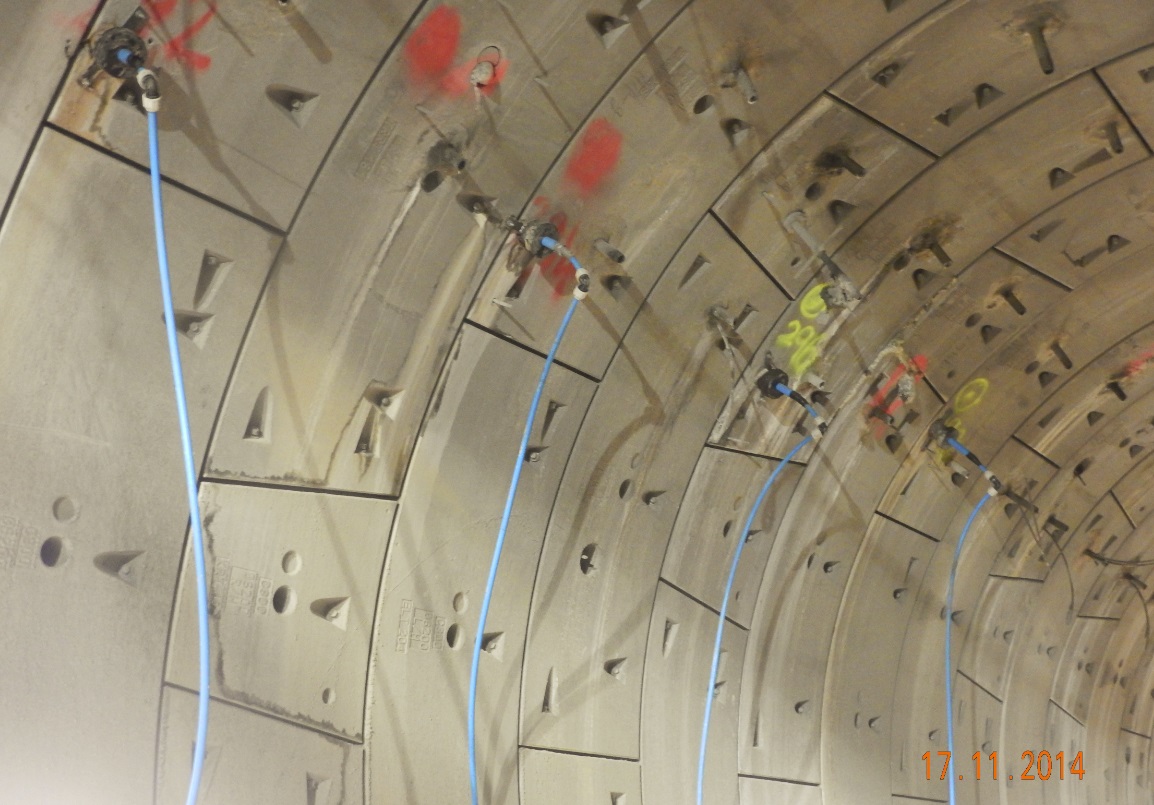
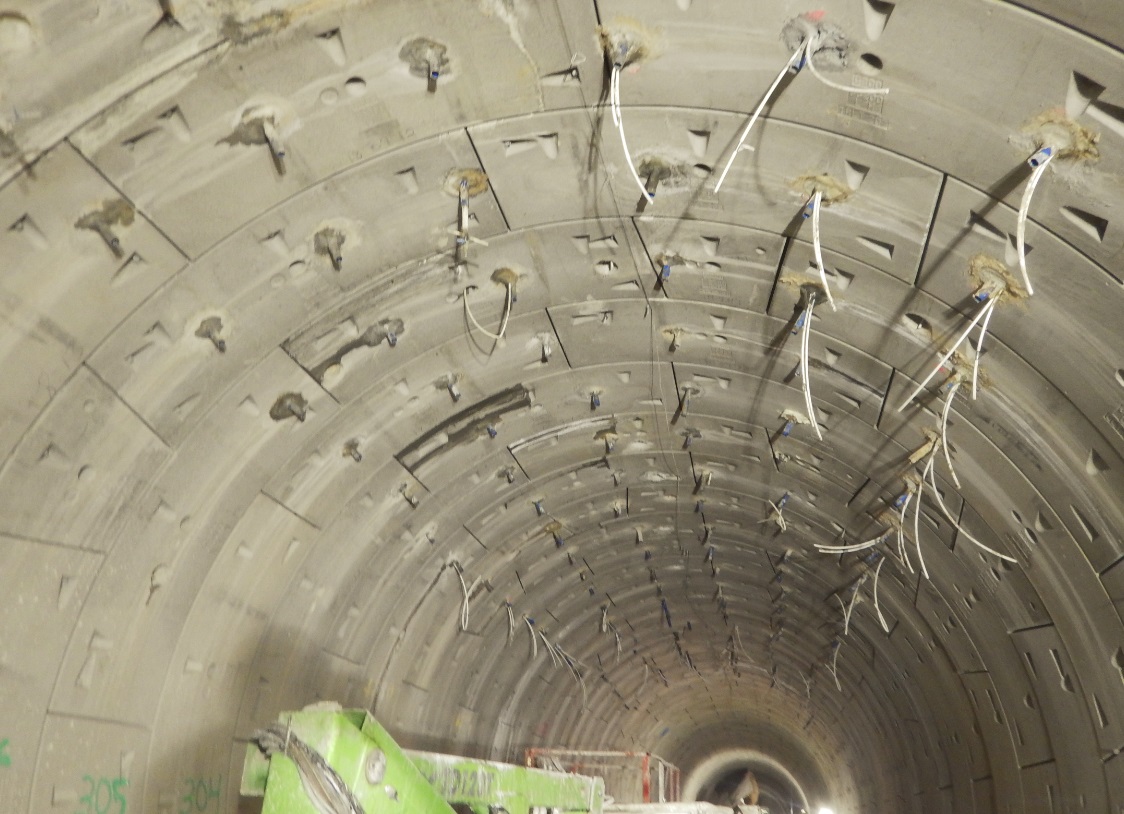
Figure 12 – Wellpoints installed in the North side of PTE (left) and chemical grout injection tubes (right) in PTE. Once the chemical grout injections were completed, the temporarily suspended depressurisation restarted. The flow rate dropped quickly to a more or less steady state of approximately 1.5l/min as shown in Figure 13. It has to be noted that similar to what was observed in PTW, a continuous drop of the flow rate with was evident due to the advancing of the tunnel which gradually intersected and cut-off the sand lens.
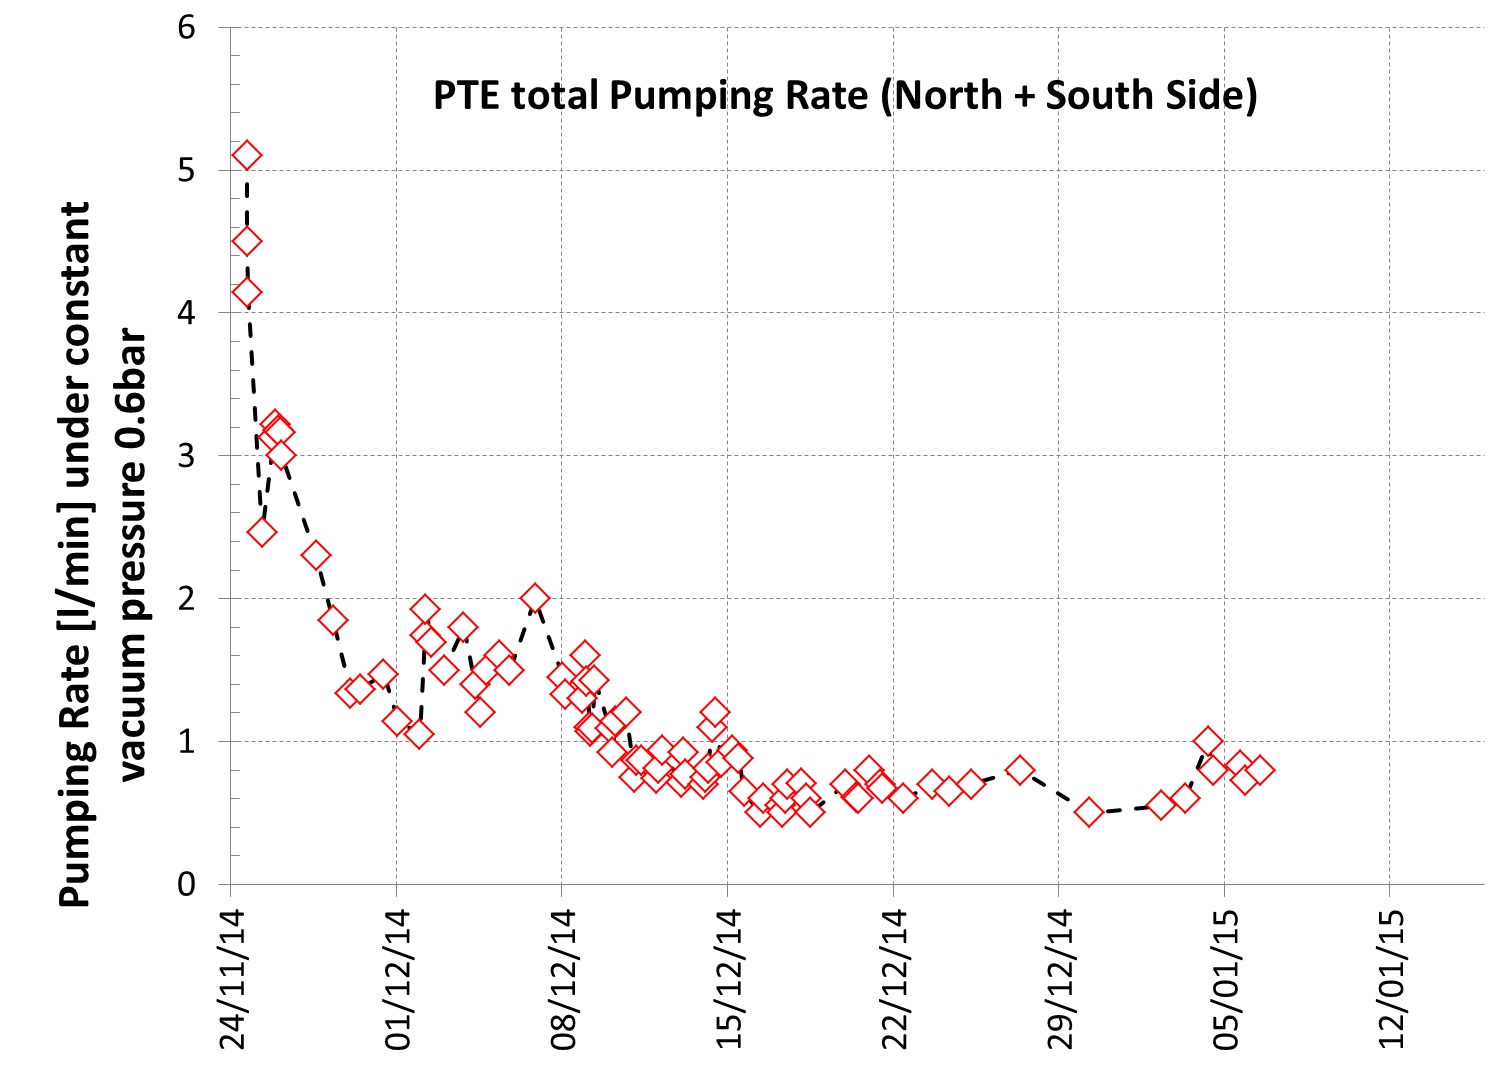
Figure 13 – Pumping rate (l/min) under constant pressure with time in PTE. Excavation and support
After the completion of the chemical grouting injections, additional investigation drilling was carried out with 21 dry auger-drilled probe holes and 2 rotary cored samples retrieved from the treated area. The results were considered as satisfactory and the project team agreed that excavation within the affected area could commence.
A decision was made to split the top heading excavation into 3 or 4 pockets (Figure 14) and install 4m long grouted spiles in the crown of every second top heading. The arisings from the drilling of these spiles were reviewed by specialised geotechnical engineers in order to assess if any water-bearing or potentially untreated material was encountered. Additionally, prior to the commencement of each excavation step, the vacuum pumping system was inspected to ensure that it was operational with a more or less stable vacuum pressure and without increase in the flow rate.
The excavation and support of the treated area progressed with no issues as the exposed sand exhibited a significant stability, implying an efficient treatment (Figure 15). Due to the time required for the installation of the spiles, the average advance rate was in the range of 1m/day.
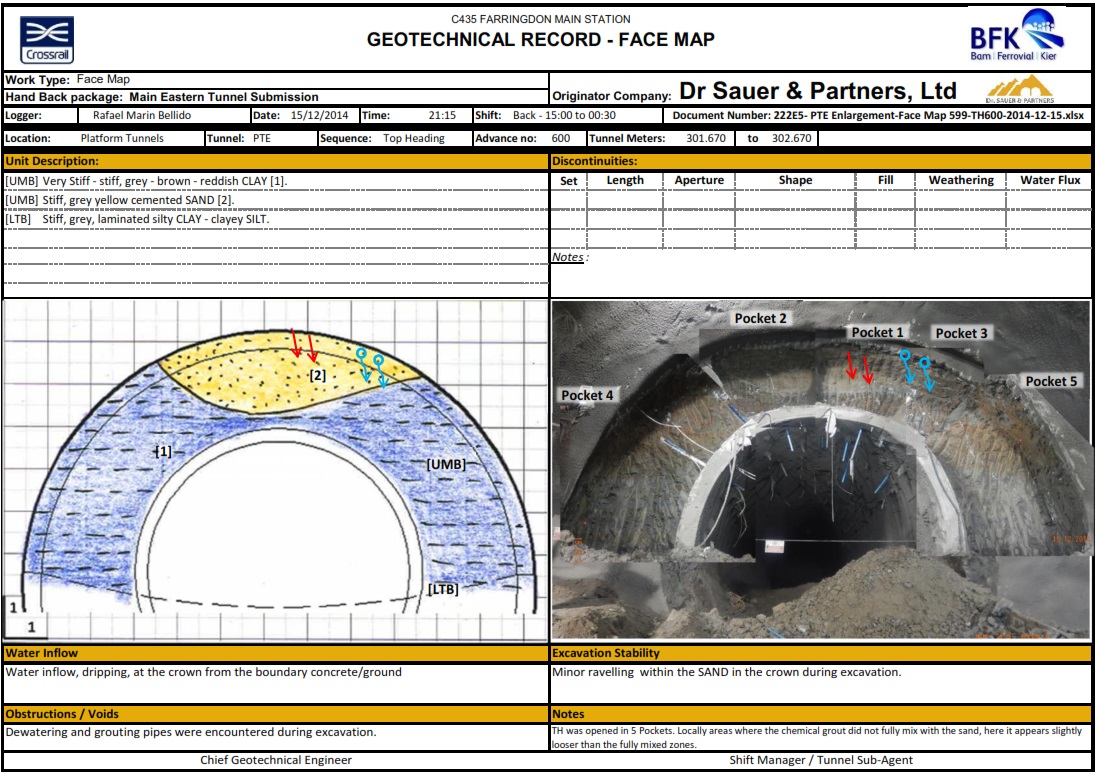
Figure 14 – Face map of top heading excavation in PTE, TM 301.7 after the depressurisation and chemical grouting implementation. 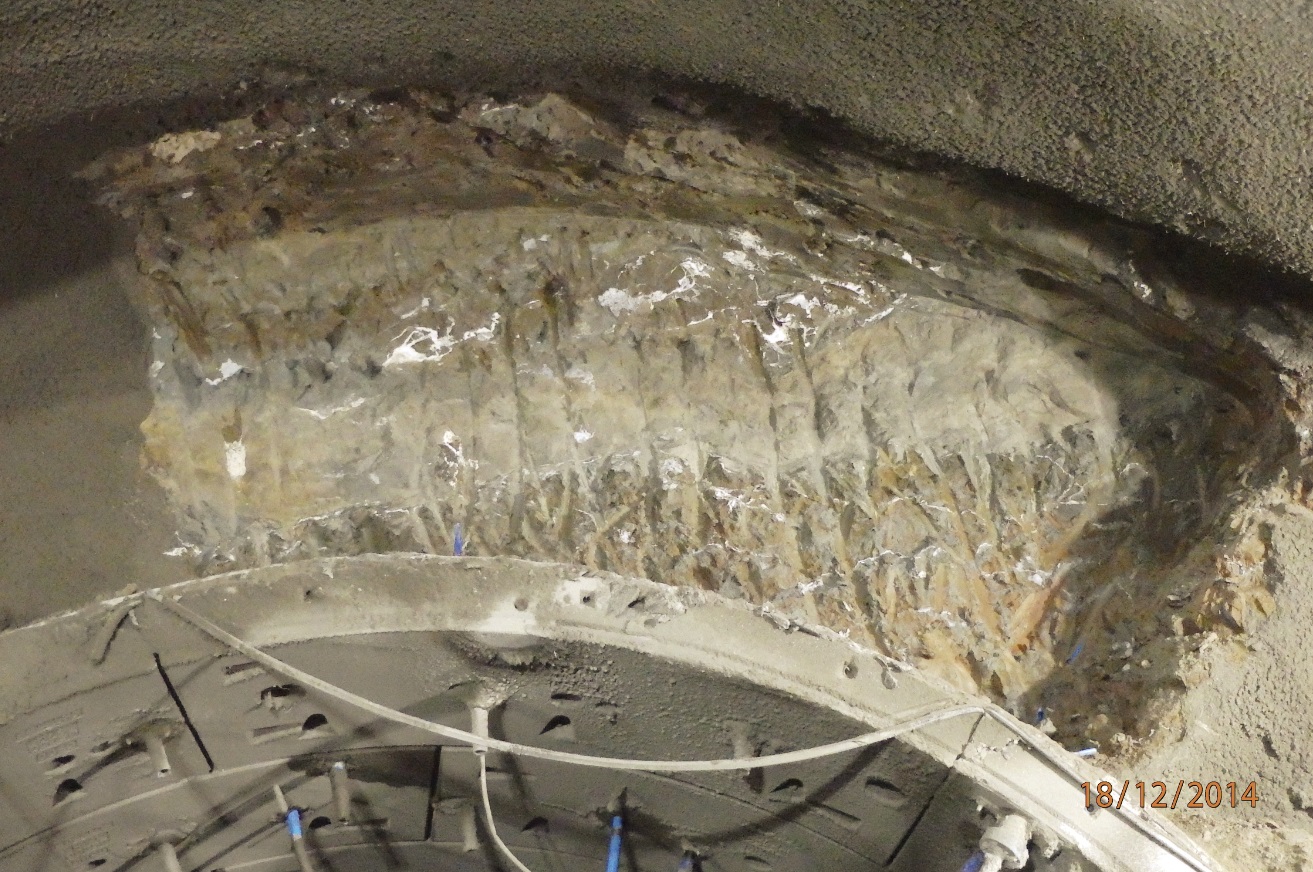
Figure 15 – Exposed sand lens in the first top heading pocket in TM 301 of PTE. The sand has been depressurised and injected with chemical grout thus exhibiting adequate stand-up time. Conclusions
The platform tunnels in Farringdon station were completed successfully despite encountering in two cases extensive, water-bearing sand lenses. In platform tunnel west, the sand lens was encountered in a moderately unfavourable position, that being in the bottom of the top heading and in the bench excavations. In platform tunnel east however, the position of the sand lens was significantly more unfavourable as it extended in the crown of the planned enlargement and above.
In both cases, the sand lenses were approximately 3 to 4m thick with a pore-water pressure of 0.7 to 1bar and exhibiting hydraulic continuity. The proposed solutions included a combination of ground treatment methods with the available SCL toolbox items.
In platform tunnel west, it was decided to depressurise the sand lens through the installation of numerous in-tunnel wellpoints through a constant pressure vacuum dewatering process. The excavation of the enlargement in the affected area commenced once a steady pumped flow rate was reached approximately after one month of continuous pumping. The face was split into four pockets and no significant instabilities occurred as the tunnelling works advanced with an average rate of 1.8m/day.
In platform tunnel east, it was decided to mitigate the significantly higher risk by a combination of in-tunnel depressurisation and sodium silicate grout injections. The former reduced the initial water pressure and the latter enhanced the sand by reducing its permeability and increasing its undrained shear strength. In total approximately 100m3 of grout were injected and the excavation works within the affected area commenced once additional ground investigation yielded satisfactory results. The top headings were split into 3 or 4 pockets and spiles were installed in every second top heading to further enhance the roof stability. The implementation of all the measures proved to be successful and no instabilities occurred as the tunnel was excavated with an average rate of 1m/day.
ReferenceS
[1] Gakis, A., Cabrero, P., Entwisle, D., Kessler, H. (2015). 3D geological model of the completed Farringdon underground railway station. Crossrail technical papers competition 2015
[2] Karol, R. H. (2003). Chemical grouting and soil stabilization, revised and expanded (Vol. 12). CRC Press.
-
Authors

Angelos Gakis Dr. Dipl-Ing, MSc DIC, CEng MICE - Dr Sauer & Partners Ltd
Chief Geotechnical Engineer, Crossrail Farringdon Station