The Use of Shape Accel Arrays (SAA) for Measuring Retaining Wall Deflection
Document
type: Technical Paper
Author:
R. Lipscombe, C. Carter BEng, Olivia Perkins MEng(Hons), Paul Thurlow, S. Guerrero MICE CEng MBA, ICE Publishing
Publication
Date: 03/11/2014
-
Read the full document
Introduction
It is usual practice to instrument diaphragm walls with inclinometers and these are read either manually or automatically as required by the specification or excavation progress. The deflection is measured as a cumulative plot between each reading. Manual inclinometer readings are usually taken once a day at pre-set times and the data interpreted and displayed on specific software. The readings are taken at half metre intervals, working from the bottom upwards. In place inclinometers are usually installed or fixed at specifically designed centres within the reservation tube installed while the diaphragm wall is cast. The readings are taken automatically via a data logger and sent for processing.
These systems of measurement have been sufficient in the past but are limited by several factors which include, repeat ability of measurements using manual techniques, and the spacing of sensors using in place inclinometers.
The introduction of Shape Accel Arrays for the measurement of deflection within a diaphragm wall is relatively new in the UK construction industry. The instrument is successfully used for real time monitoring of slopes and embankments and has been used for reviewing positions of jet grouting drilling positions and sewer monitoring in the UK previously. The SAA is very quick to install and base read with the data output configurable for various monitoring software programmes.
Sensor Design and Specifications
Shape Accel Arrays (SAAs) are manufactured in Canada by Measurand Inc. An SAA is a rope-like array of sensors and microprocessors used to measure deformation or vibration. It is made up of a number of rigid segments either 500mm or 305mm in length and has a diameter of 25mm. Each segment has three temperature-calibrated MEMS (Micro Electro Mechanical System) accelerometers and the segments are connected by flexible joints that can move in any direction but cannot twist. There is one processor and temperature sensor for every eight segments. The in-array microprocessors collect and send signal data through a single wire output.
The 3D shape of SAA in near-vertical casing is determined from static accelerations of X and Y accelerometers. In near-horizontal mode, the Z accelerometers are used to determine 2D shape in a vertical plane.
The SAAs are installed in 27mm diameter PVC casing and can be installed either vertically or horizontally. Any deformation that moves the casing is accurately measured as a change in shape of the SAA. SAAs are re-usable and are able to withstand huge deformations. Data can be collected from the SAAs either manually by use of a laptop or tablet computer and a SAA-PC Interface Box or in real time wirelessly via a data logger. The SAA features the following :
- Resolution: 2 arc seconds
- Accuracy: ±0.5mm/32m when the casing is grouted in place, ±1.5mm/32m when the casing is not grouted
- Pressure: tested to 100m depth water
- Vibration: can measure ±2G
After production, every sensor in every SAA is calibrated through a range of multiple temperatures and multiple orientations. Calibration constants are calculated and are programmed into the data logger specific to the SAA. The only calibration procedure required after installation is to zero the SAAs when installed to produce a zero value for the SAA which will be used to compare all future readings to.
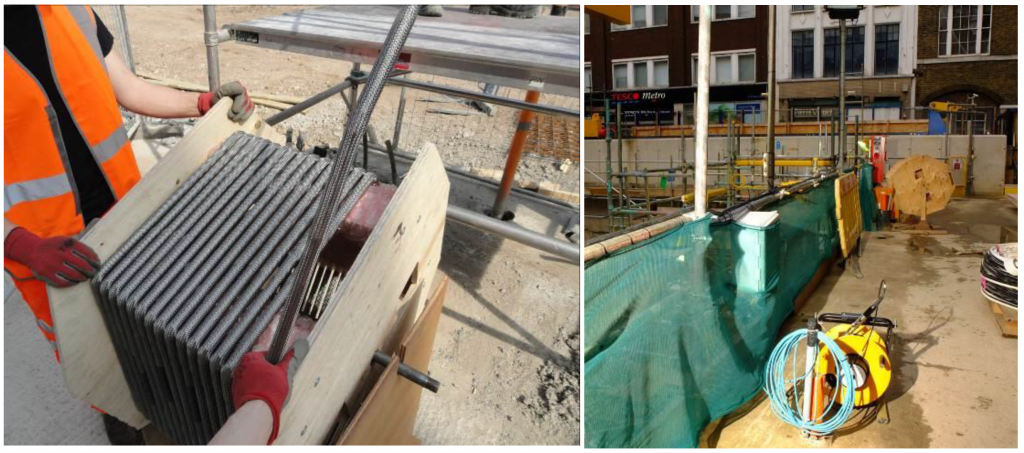
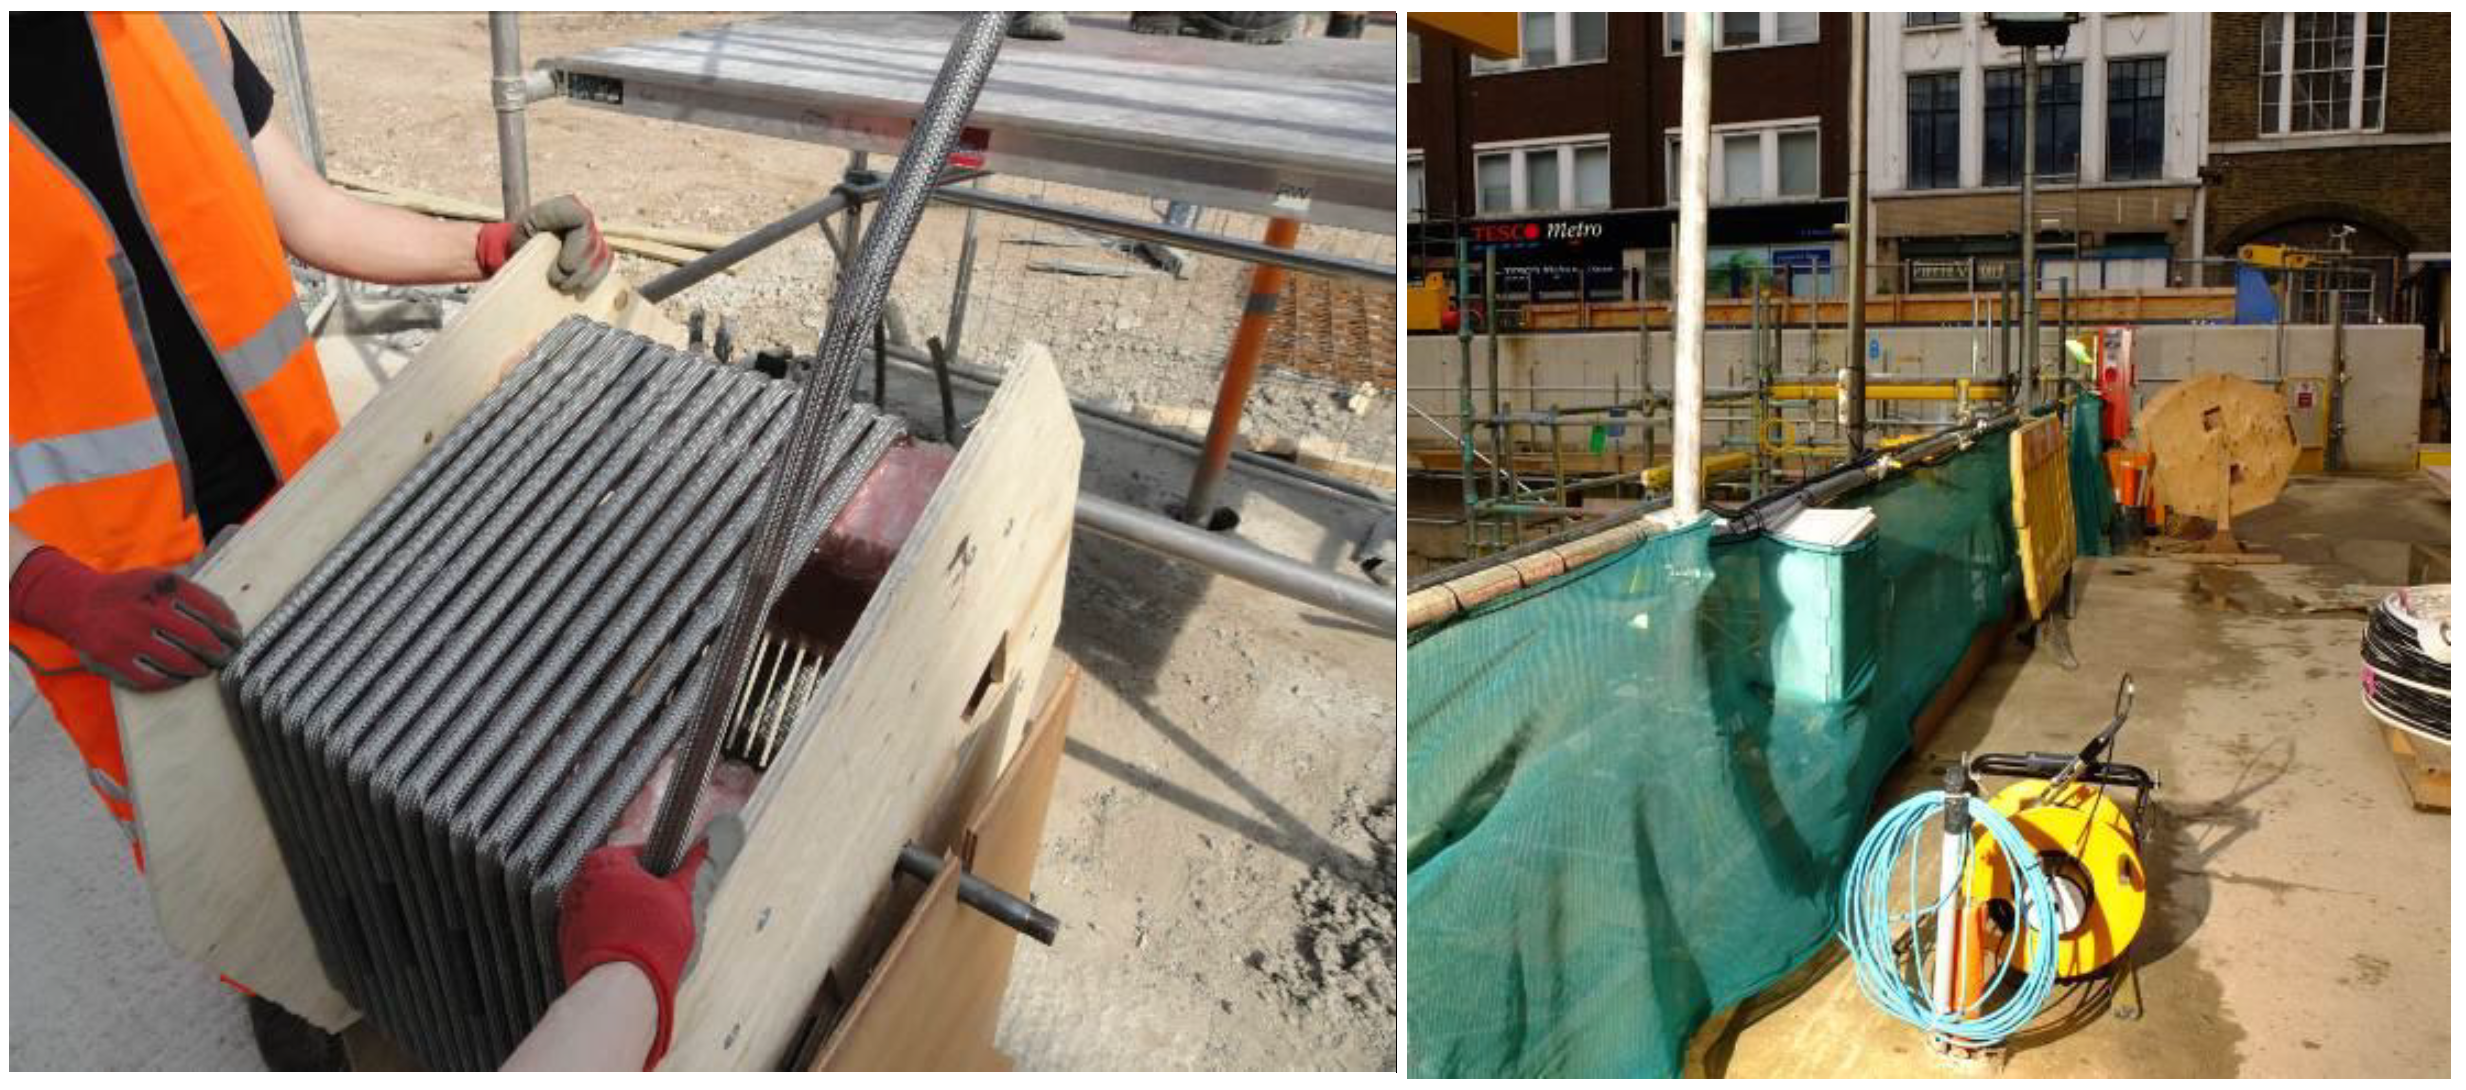
Figure 1 – An SAA on the reel, prior to installation and a view of logger box and inclinometer
The Site
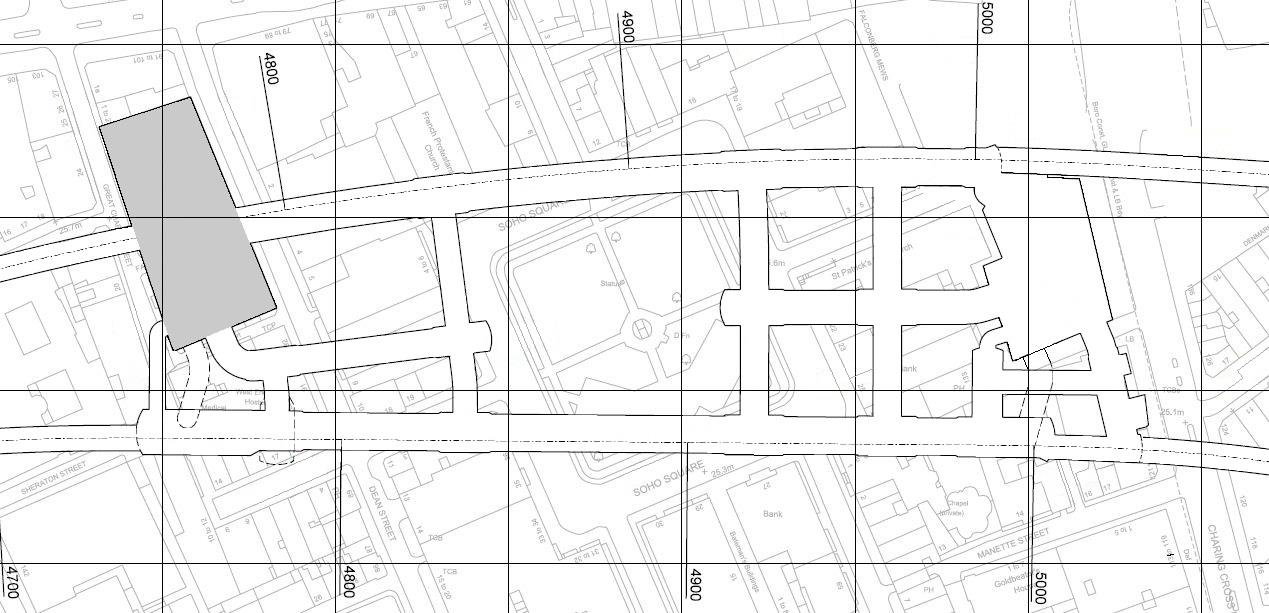
Tottenham Court Road Station is located in London’s West End, where Oxford Street meets Tottenham Court Road. Crossrail is working alongside Transport for London on a £1bn transformation of the station, which includes the upgrade of the existing London Underground station, as well as the construction of a completely new station specifically for Crossrail. The construction works involve the building of two brand new ticket halls; the Eastern and Western Ticket Hall (WTH) (see Figure 2).
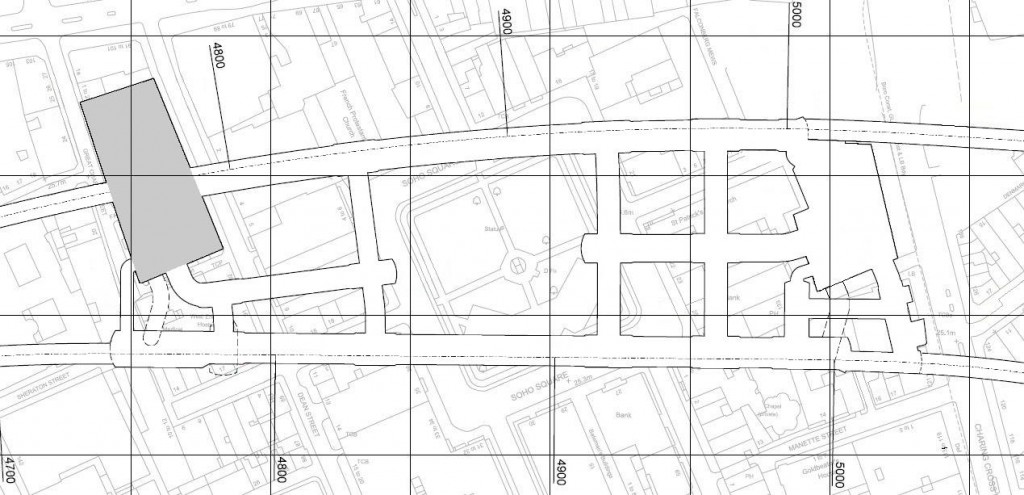
Figure 2 – Location Map showing the new Tottenham Court Road Station
The excavation of the Western Ticket Hall is divided into three zones; a 29m deep southern section, a 13m deep northern section, and a shallow excavation at the northern end of the site associated with the over-site development. The diaphragm walls and piles for both the southern and northern sections were completed in early 2012 by BBMV (a joint venture between Balfour Beatty, Morgan Sindall and VINCI Construction). The excavation is being undertaken in two phases: the southern (deep) box and the northern box, with the southern box being constructed first to allow Spray Concrete Lined (SCL) tunnels to be constructed prior to the arrival of the Tunnel Boring Machines (TBMs). The southern box is approximately 41m by 31m and the northern is approximately 27.5m by 22m.
This paper will document the use of SAAs within the diaphragm wall for monitoring deflection in the southern section of the WTH during excavation and temporary propping works. This work falls under C300/410 contract; the principle contractor for these works is Bam Ferrovial Kier – Joint Venture (BFK) and the sub-contractor for Instrumentation and Monitoring (I&M) is KGi JV (a joint venture between Keller Getec and ITMSoil). Excavation of the southern box commenced in April 2012.
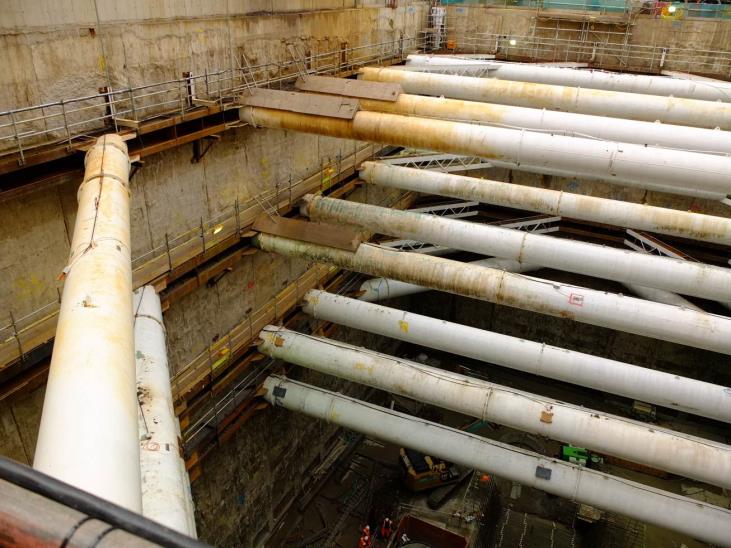
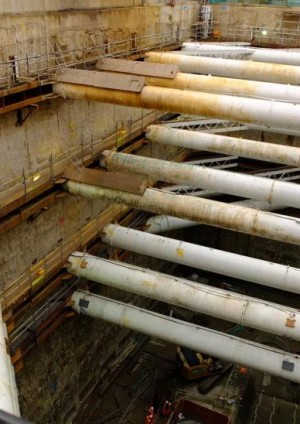
Plate 1 – View of props within the excavation
In the original scope of works it was proposed that there would be five levels of temporary props to be installed by C300/410 during the excavation. BFK submitted a Value Engineering (VE) proposal to use the observational method at the TCR WTH south box excavation to omit the P5 propping level. This was accepted by Crossrail. A cross-section through the TCR WTH south box is shown in Figure 3.
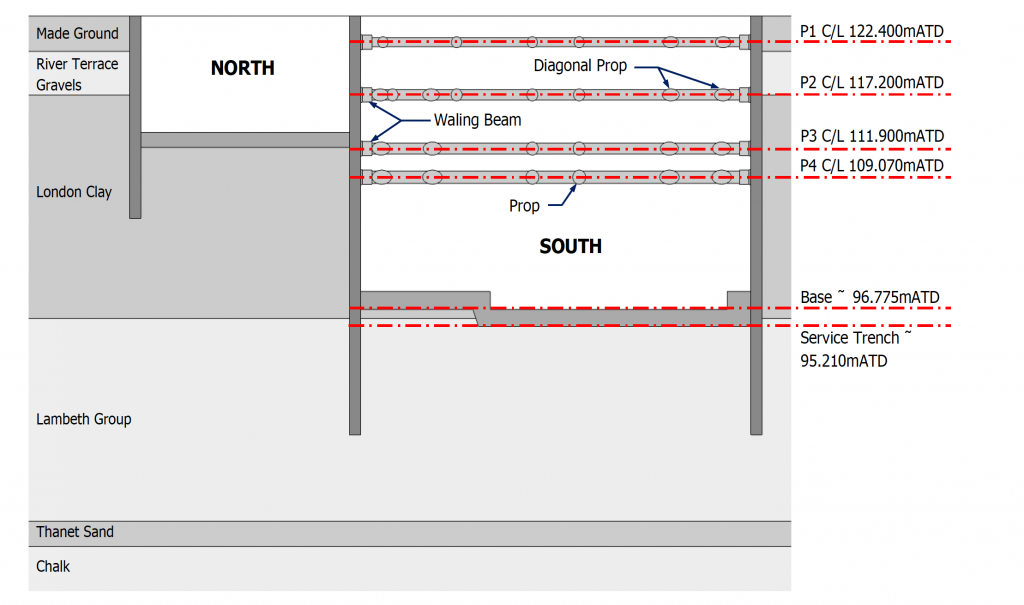
Figure 3 – Cross-section of the TCR WTH
Installation of SAA into the Diaphragm Wall alongside Manual Inclinometers
At the Tottenham Court Road Western Ticket Hall site eight no. SAAs were installed at locations around the diaphragm wall. The SAAs were installed in vertical 27mm diameter PVC tubes alongside standard inclinometer casing into 140mm diameter reservation tubes. The casing was grouted into place within the reservation tubes, see Figure 4. The reservation tubes had been pre-installed into the diaphragm walls to facilitate installation. The SAAs installed were of varying lengths, dependant on the panel length of the diaphragm wall. The SAA’s were installed to the bottom of the panel and not drilled through the toe of the diaphragm wall as it was considered that the requirement of a 10m anchor would not be sufficient in the ground conditions. The SAA’s were made up of rigid segments of length 500mm. In all instances the SAA were installed with the x-axis facing into the excavation. Eight no. data loggers were also installed, one for each SAA, to allow the data to be sent via GPRS to a central FTP server and downloaded to the site monitoring database.
Figure 4 – Diagram of an SAA installed alongside Inclinometer Casing
The excavation and installation of temporary props was divided up into nine stages. After the VE proposal to omit the temporary P5 props was accepted these stages were redefined as shown in Table 1.
Stage: Description of Works: Completion Date: 2 Excavate to 121.400 mATD. 30/04/2012 3 Prop P1 and excavate to 116.200 mATD. P1 propping complete 22/05/2012
Excavation to 116.200 mATD complete 15/06/2012
4 Prop P2 and excavate to 110.900 mATD. P2 propping complete 06/07/2012
Excavation to 110.900 mATD complete 15/07/2012
5 Prop P3 and excavate to 108.070 mATD. P3 propping complete 27/07/2012
Excavation to 108.070 mATD complete 05/08/2012
6 Prop P4 and excavate to 100.970 mATD. P4 propping complete 14/08/2012
Excavation to 100.970 complete 04/09/2012
7 Excavate to 97.285 mATD (500mm above hold level). 04/09/2012 – 19/09/2012 8 Excavate to 96.775 with structural binding strut. 19/09/2012 – 27/09/2012 9 Excavate service trench to 95.210 mATD. 23/09/2012 – 26/09/2012 Table 1 – Stage summary and completion dates
As part of the Management Plan for the Control of Ground Movement (MPCoGM) for the WTH excavation, Amber and Red triggers of displacement of the diaphragm wall were provided by Crossrail. The Red trigger was calculated by the designer, Arup Atkins (C134), based upon the design expected deflection at a percentage of the load, and the Amber trigger was calculated as 75% of the Red trigger. Observed displacement is compared directly with the trigger values. Any trigger breach results in immediate verbal notification of the BFK Monitoring Engineer and the BFK Sub-Agent by the KGi JV I&M Engineer. If the trigger breach is confirmed all BFK members of the Contract Technical Committee (CTC) are notified with the BFK Sub-Agent instigating any actions required to ensure the safety of the works, the public and third-party assets. E-mail notification detailing the specific trigger breach and rate of movement, as well as any specific actions taken or planned, was sent to all CTC / Shift Review Group (SRG) / Engineering Review Panel (ERP) members. An emergency CTC or Emergency Engineering Response Team (EERT) meeting is held dependant on the risk associated with the trigger breach. Target response times of 4 hours and 1 hour for Amber and Red triggers respectively were detailed in the Specification for the Control of Ground Movement (SCoGM).
The following actions and communications at trigger levels are detailed in Table 2.
Trigger: Communication: Action: Green Review at SRG meeting. No further action unless the rate of change of movement is sufficient to warrant a special CTC meeting. Formal review of instrumentation data compared to excavation progress. Pre-emptive action to be taken if trends indicate that the Amber trigger is likely to be exceeded. Potential impact on buildings and utilities to be reviewed. Amber Verbally notify all Monitoring and members of the Contract Technical Committee. all members of CTC/SRG/ERP to meet within four hours.. Inform Project Manager immediately providing records of construction activities prior to the trigger breach. Implement contingency plans. Review data for consistency and identify trends with respect to trigger levels at each stage of excavation. Investigate the possible impact of the environment and any other works in the vicinity. Review the wall deflections and decide if changes to the construction method or sequence are necessary to ensure the Red trigger is not breached. Review potential impact on buildings and utilities. Red Verbally notify Monitoring Engineer and members of the CTC. All members of CTC/SRG/ERP to meet within one hour As per Amber trigger breach, but stop all construction activities that may lead to further increase in movement around trigger breach. Backfill area around trigger breach with spoil. Seek instruction from the Project Manager on how to proceed. Review potential impact on buildings and utilities. Black Call emergency services as appropriate. Phone select on-call representatives and contractors reaction line. Immediately put in place any actions required to ensure the safety of the works, public, and third-party assets. As necessary; evacuate excavation, call emergency services, backfill against walls from stockpile, place structural binding strut, mobilise priority props to site. Table 2 – Communication and action to be taken in case of Trigger breach
The Black trigger has no numerical value, but is reserved for when the stability of the excavation is deemed at risk due to a dangerous condition being observed.
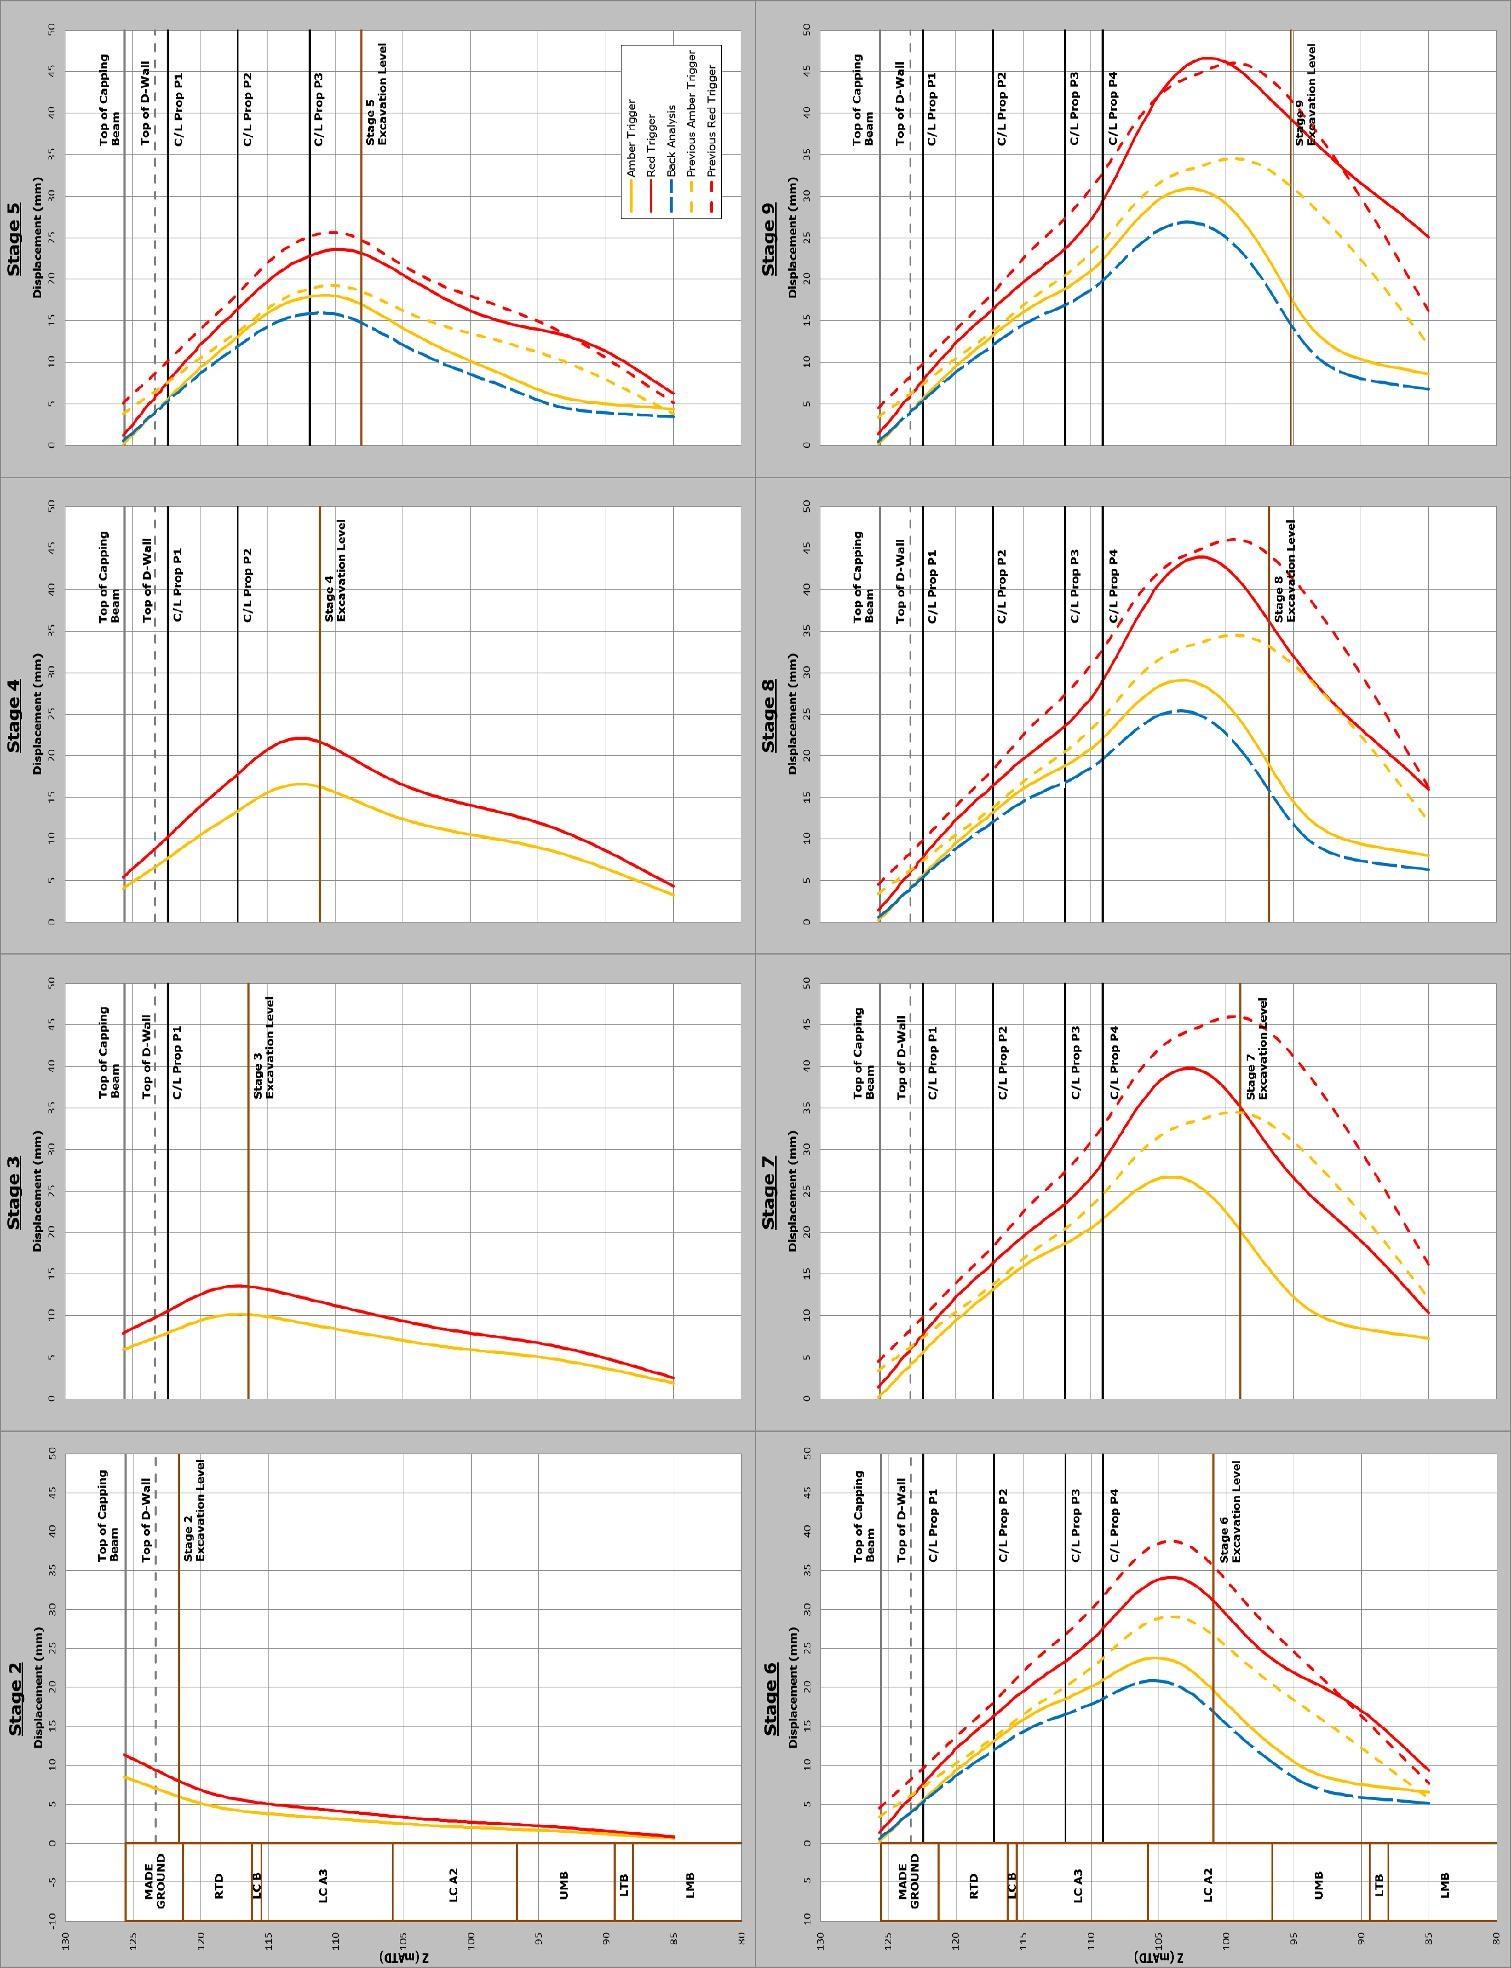
The VE proposal to omit the P5 props was based upon the use of the observational method. The designer undertook a back-analysis of the observed behavior of the diaphragm wall during excavation to P4 level. From this the calculations were refined and new triggers defined for the excavation to base slab level. A back analysis with the ‘most probable’ soil parameters is currently being treated as a Green trigger, the Amber trigger is mid-way between the ‘most probable’ and ‘moderately conservative’ soil parameters, and the red trigger is based upon ‘moderately conservative’ soil parameters. The most recent stage triggers and the calculated back analysis for stages 1 to 9 are shown in Figure 5. The superseded triggers are also shown on the graph, along with the levels of strata, appropriate prop levels, the top of the diaphragm wall and capping beam, and the stage excavation level for reference.
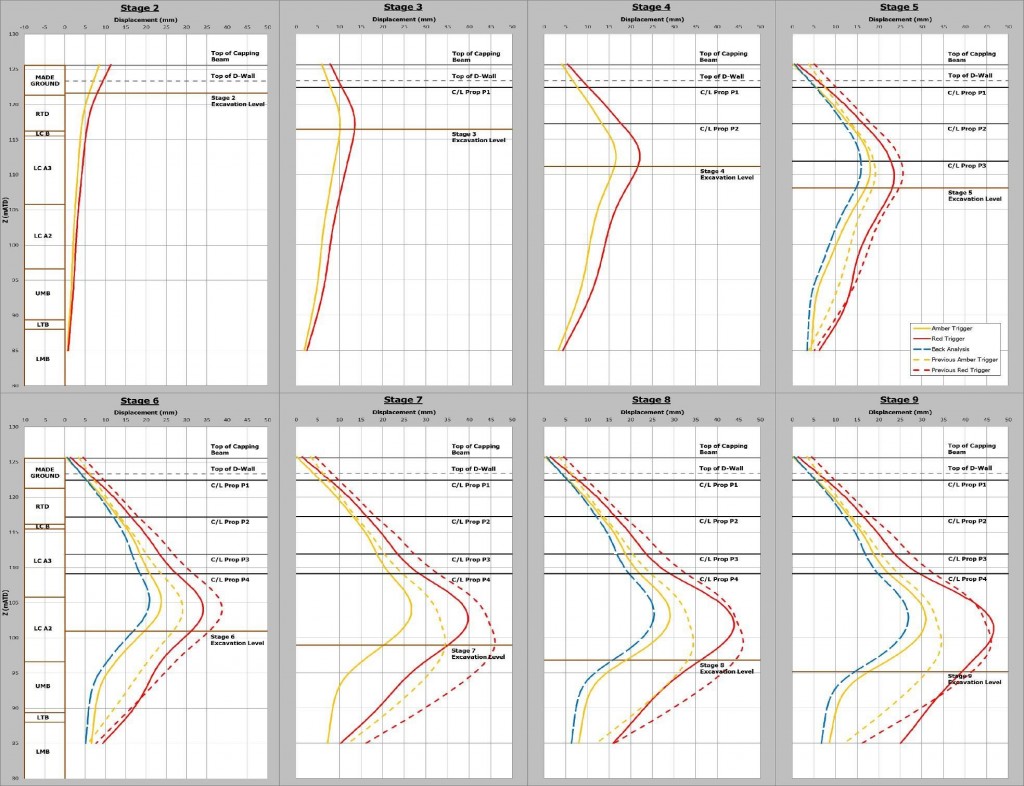
Figure 5 – Graphs showing the Stage Triggers for Stages 2 to 9
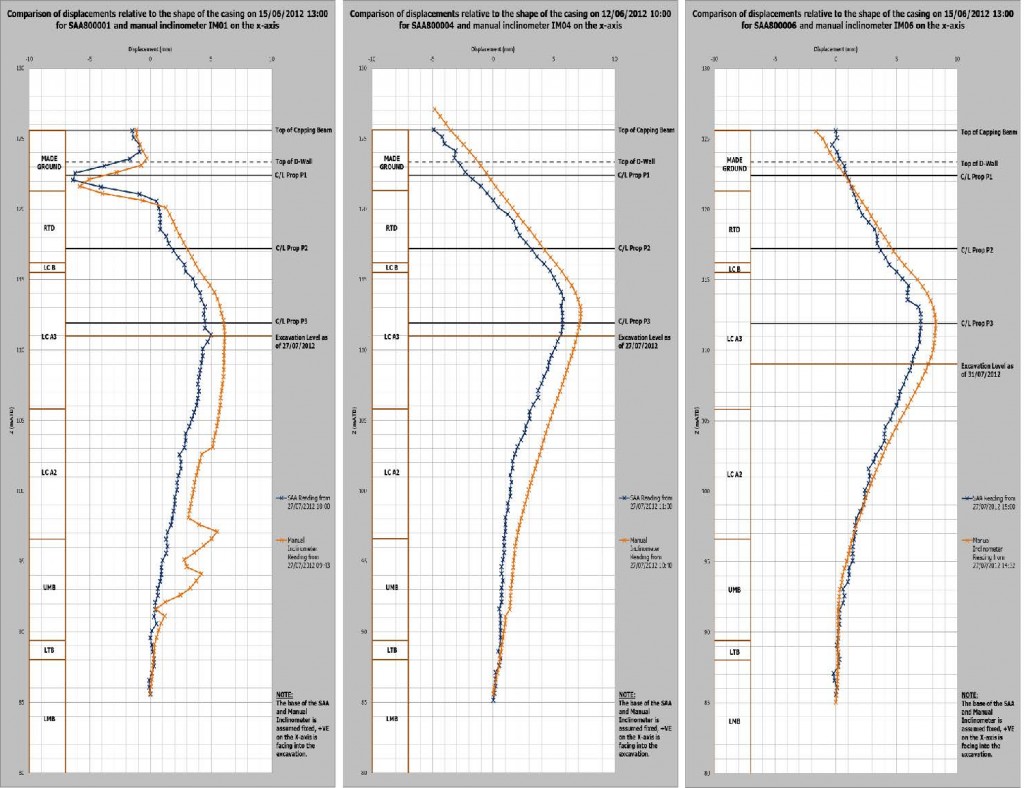
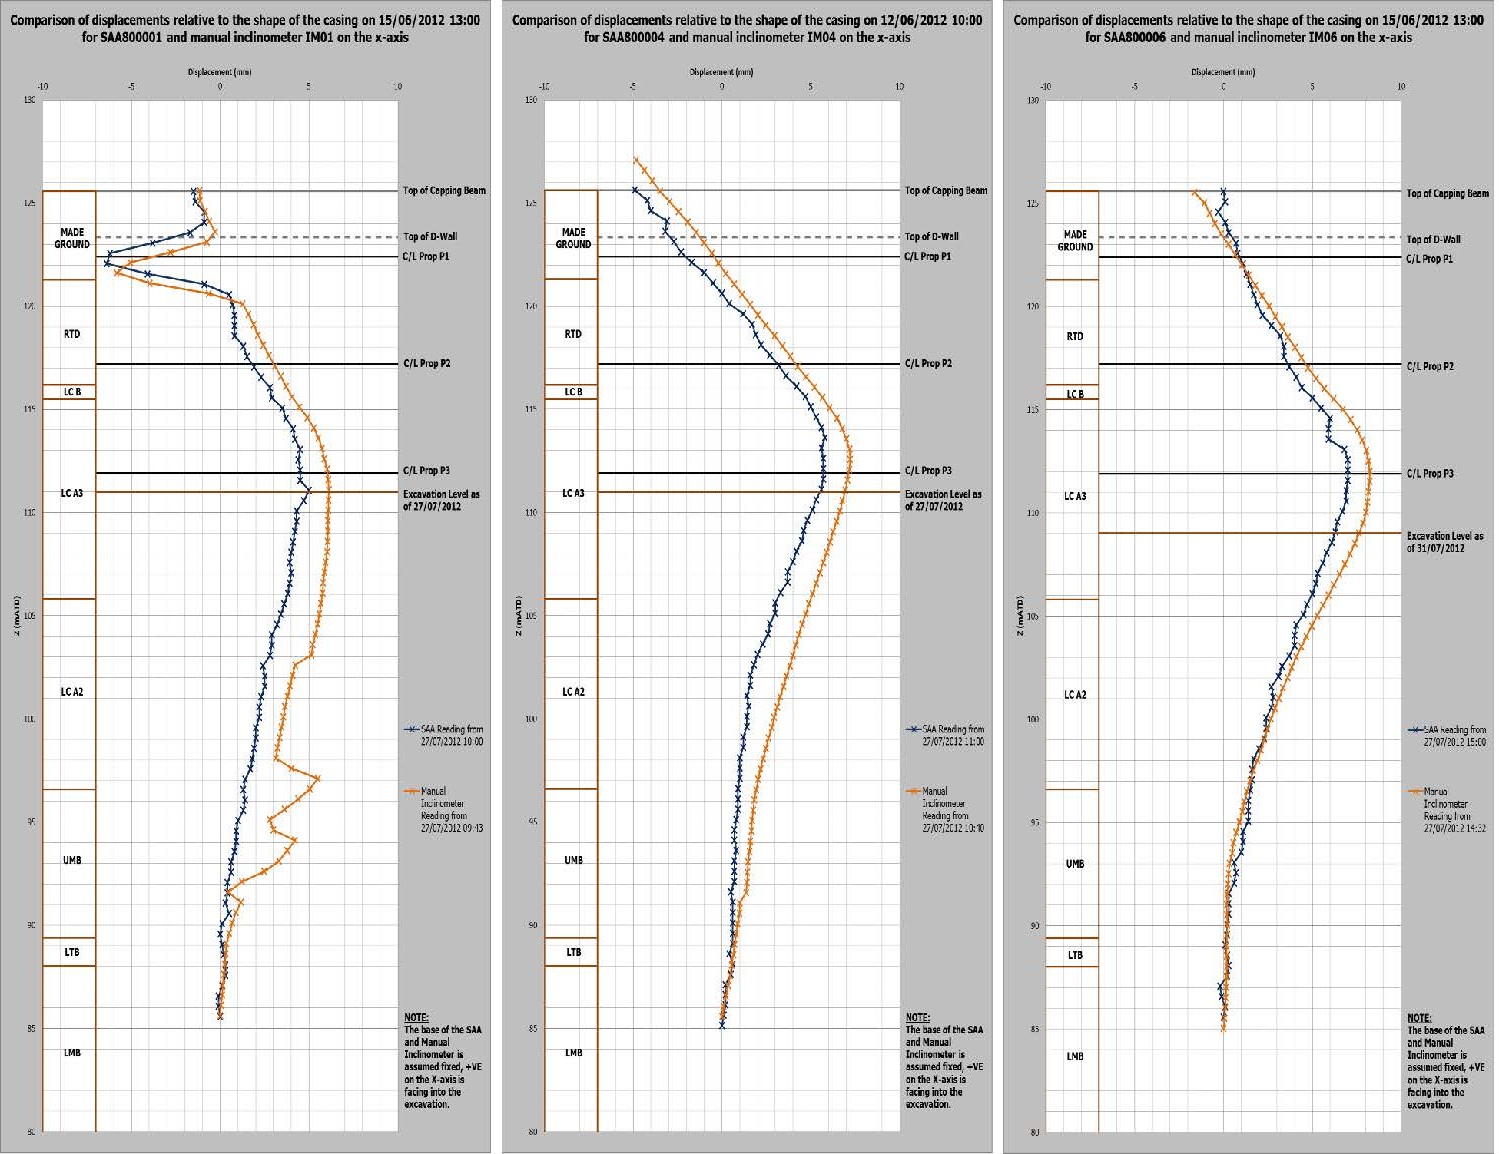
Figure 6 – Comparison of displacements of the SAA and Manual Inclinometer in three locations around the Diaphragm Wall
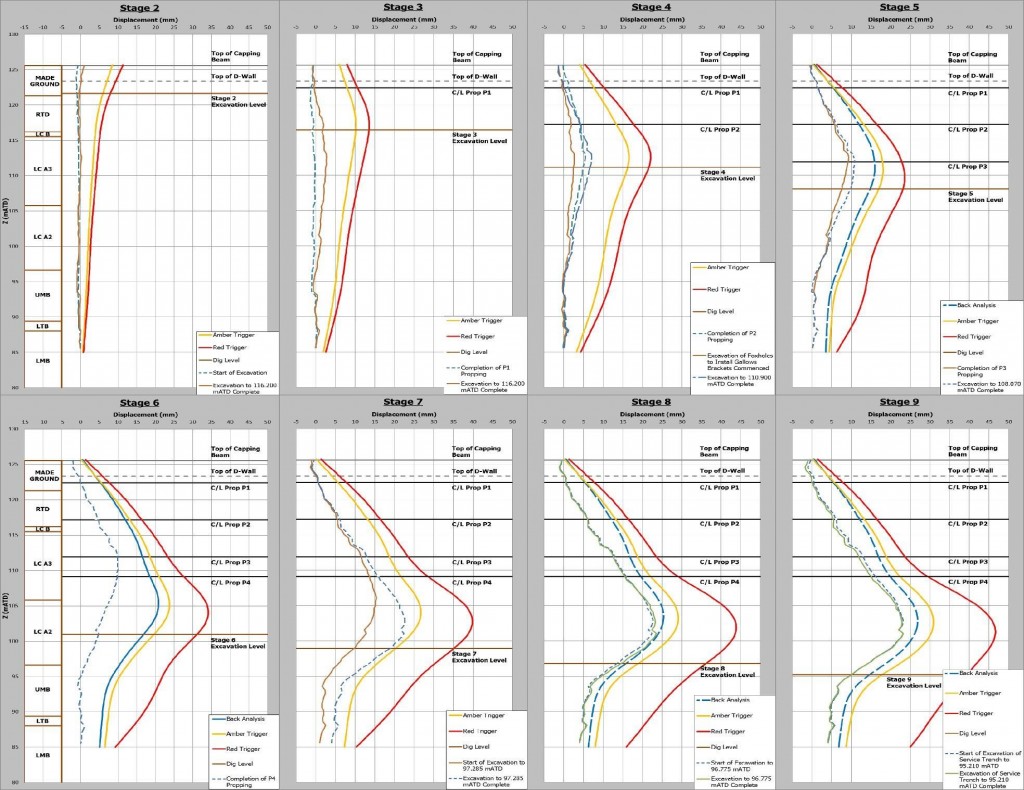
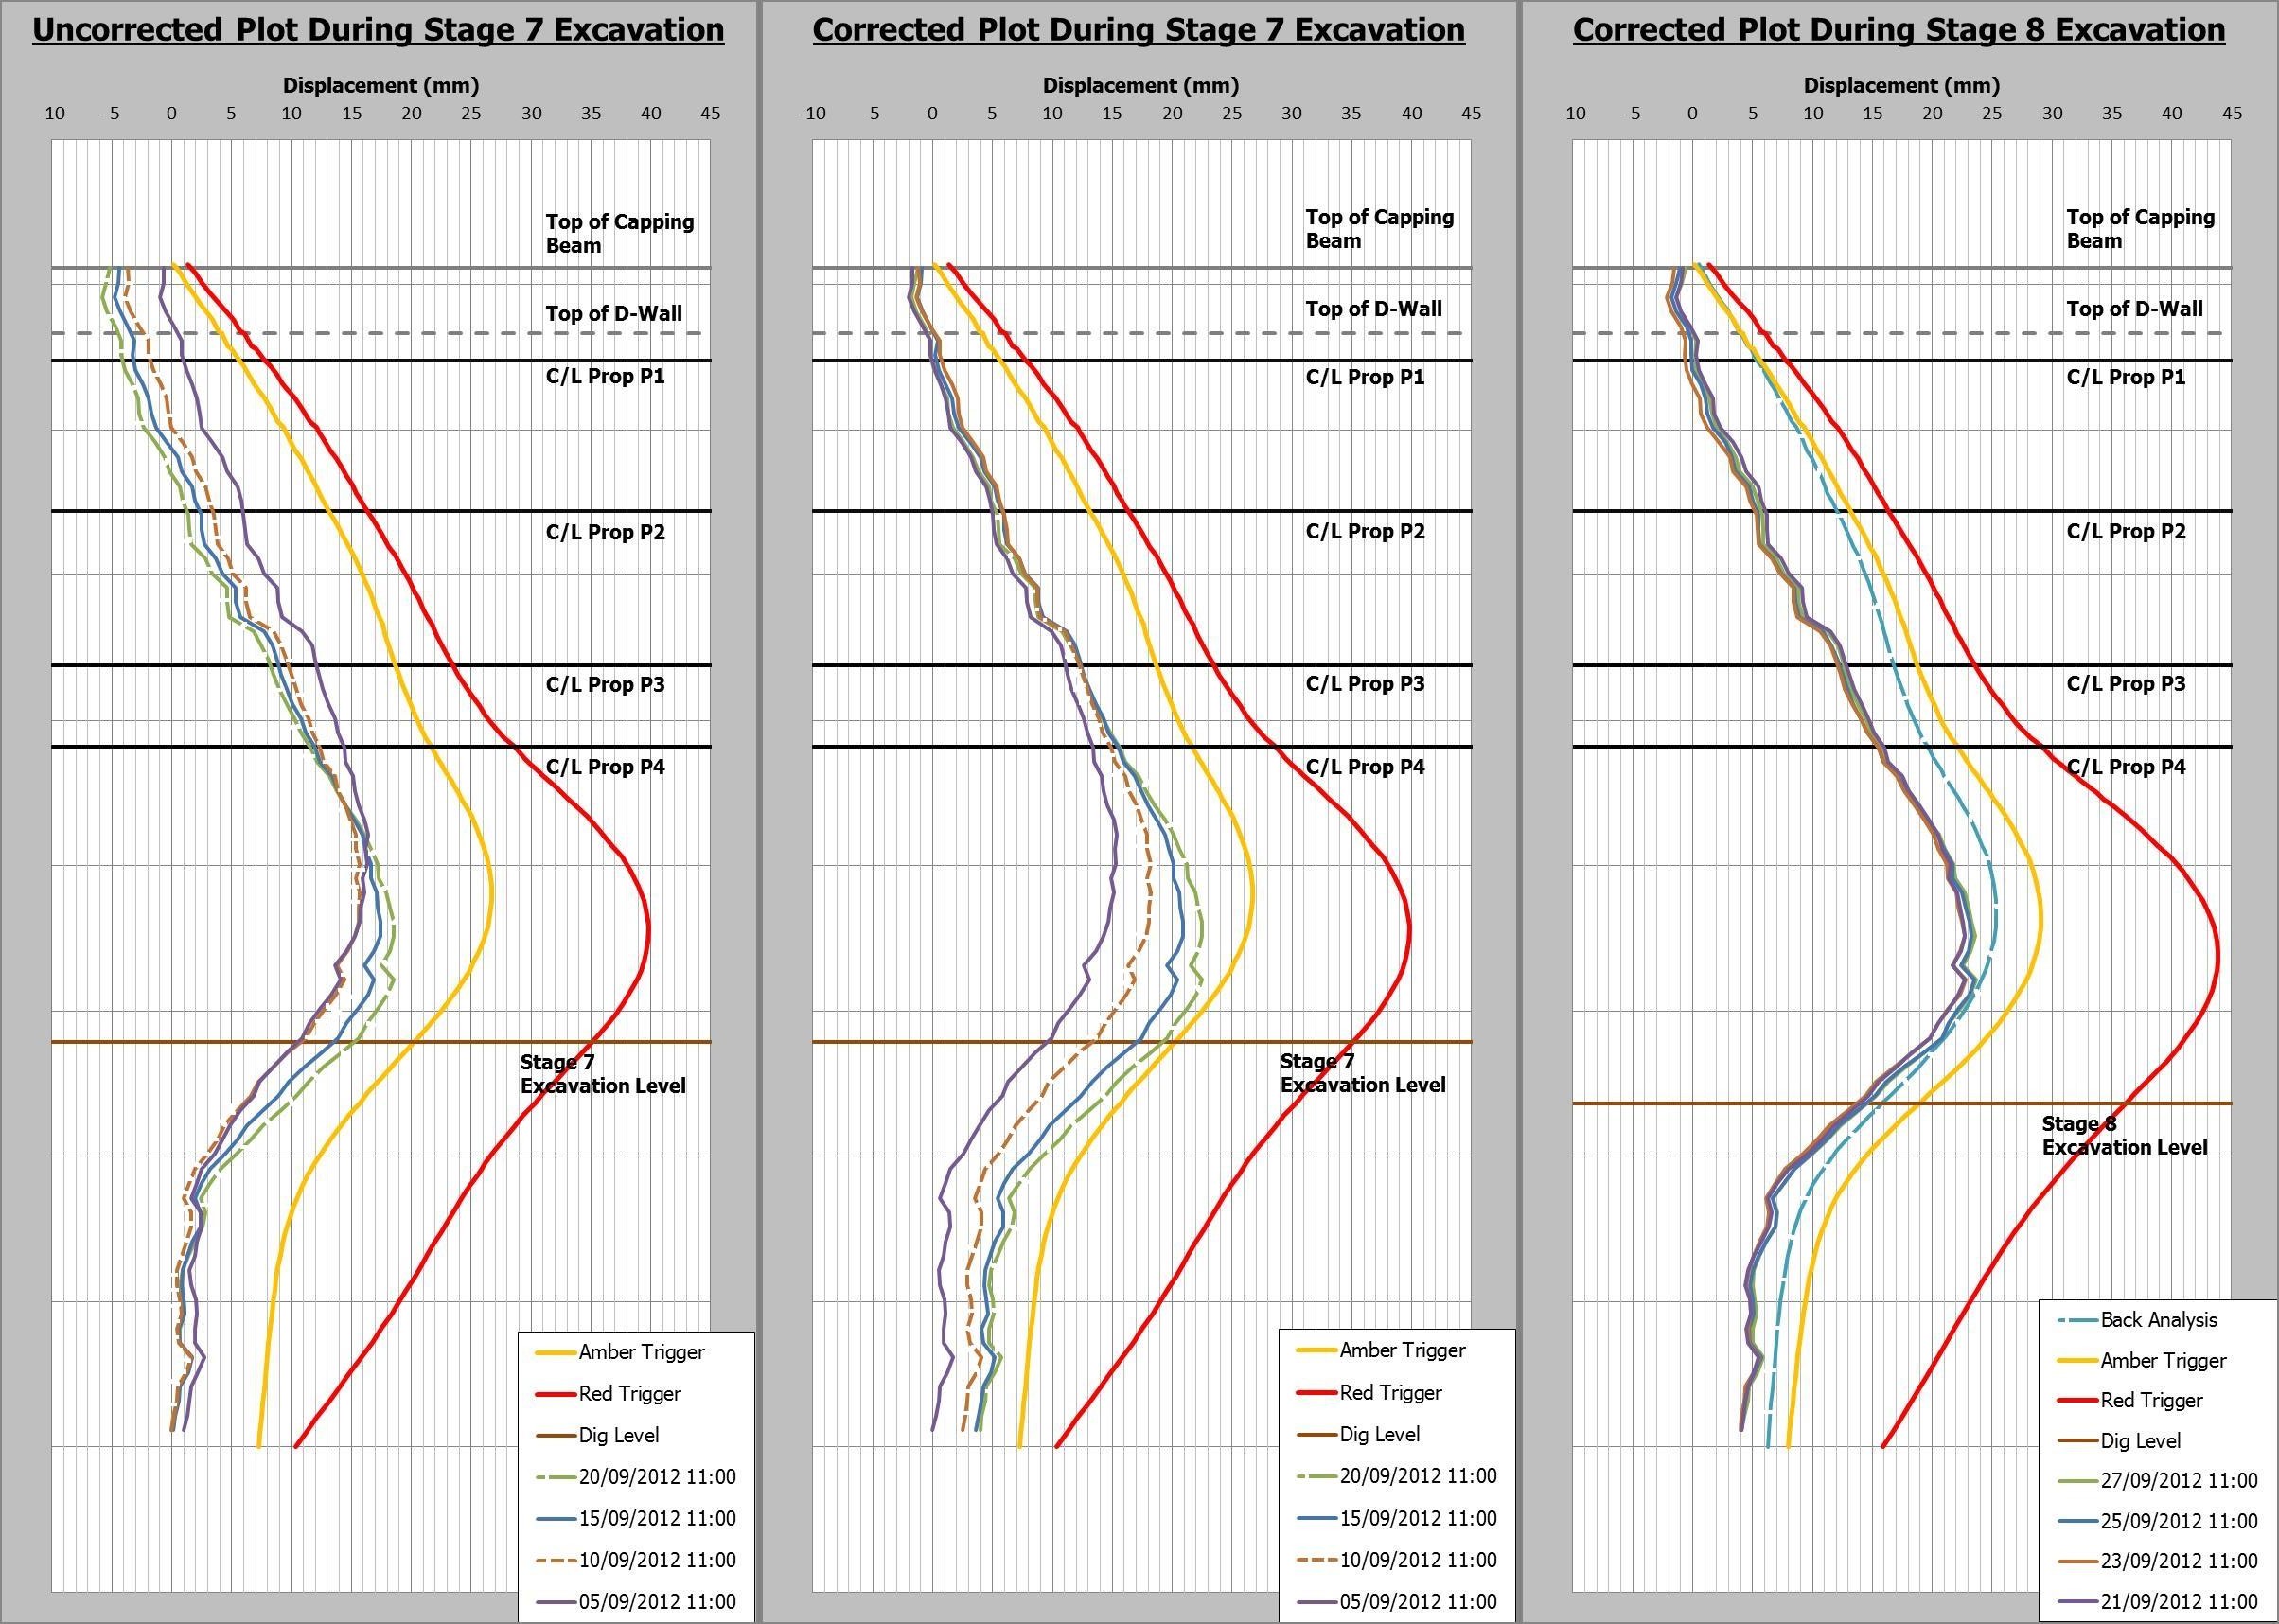
Figure 7 – Graphs showing the movement of the Diaphragm Wall throughout Stages 2 to 9
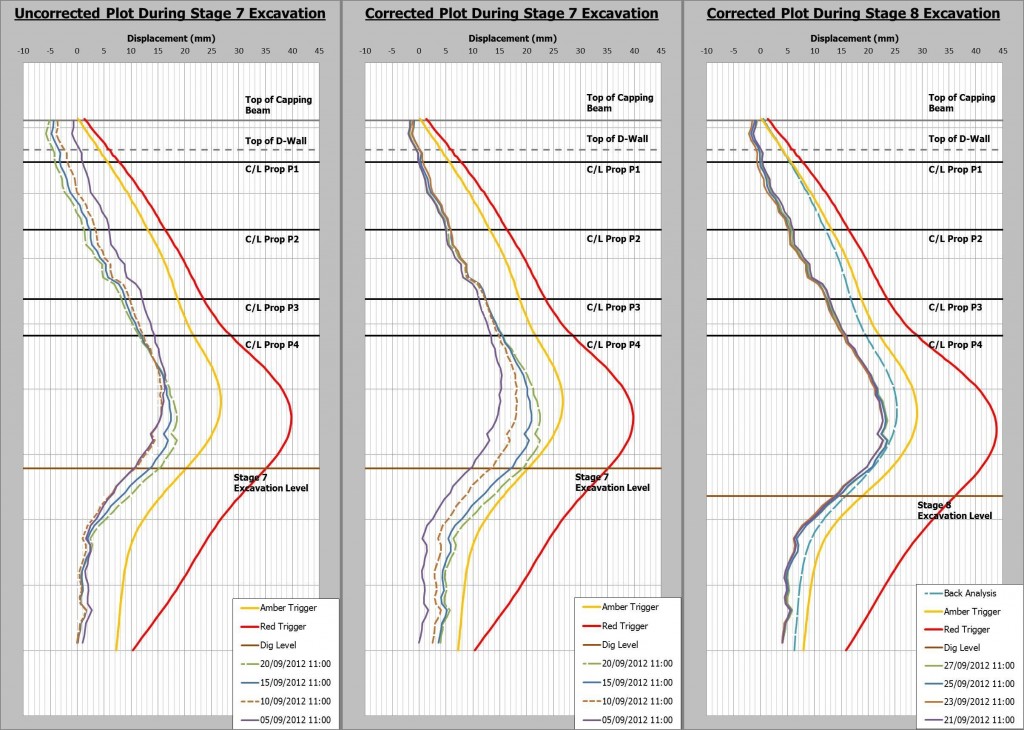
Figure 8 – Graphs showing the movement of the Toe of the Diaphragm Wall
Results and Discussion
Figure 6 shows a comparison of the displacements of the diaphragm wall, as read by both a manual inclinometer probe and the in-place SAA, on the same date and time, taking the same reference time for both the manual inclinometer readings and the SAA readings. The centre line of the props installed and the excavation level at the time of the readings has been indicated on the graph as well as the top of the diaphragm wall, the top of the capping beam, and the different strata.
A good comparison is shown on Figure 6 between the manual inclinometer readings and the SAA readings, showing the accuracy and reliability of the relatively new Shape Accel Array compared to the manual inclinometer probe. The SAA seems to show a more accurate profile of the casing, with the graphs showing even the slightest deformation of the casing due to the high resolution of the instrument and the snug fit of the instrument within the casing. As can be seen from the comparison for SAA80001 and IM01, the manual inclinometer readings between the Z values of 91mATD and 98mATD show a significant difference of up to 5mm from the SAA readings. This is most likely due to an error in the manual inclinometer readings, possibly due to site conditions and the inclinometer probe not being given a chance to stabilise before the reading was taken.
Figure 7 shows the movement of the diaphragm wall as shown by SAA800006 at the start, completion of propping (if relevant), and the completion of the excavation for each stage as detailed in Table 1. As with Figure 5, the Amber trigger, the Red trigger, and the back analysis (Green trigger) are displayed on the graphs. The graphs show movement of the diaphragm wall into the excavation with the dig, roughly following the shape of the trigger lines as would be expected.
As the base of the SAA are assumed fixed, all plots of the SAAs are expected to show movement from the excavation at the top. In reality the SAA is moving into the excavation at its base and the top of the SAA is not moving. A manual survey of 3D Geodetic Prisms fixed at the top of the diaphragm wall, in line with the SAAs, takes place concurrently with the SAA readings to monitor the position of the top of the diaphragm wall. Interpretation of these readings show that little or no movement has occurred at the top of the wall, as was predicted. From the movement of the 3D Geodetic Prims and the movement of the SAAs at the top of the diaphragm wall, the correction factor that must be applied to the SAA readings can be calculated. Due to the manual survey of the 3D Geodetic Prisms being lass accurate and at a lesser frequency than the SAA readings, intervals of 0.5mm were used as corrections to the SAA readings.
Figure 8 shows the movement of the diaphragm wall during Stage 7 with no corrections applied to the SAA readings, with corrections applied to the SAA readings, and the corrected SAA readings through Stage 8, which overlaps with Stage 9. As can be seen from Figure 8, after corrections were applied to the Stage 7 readings, a movement of around 4mm can be seen at the base of the diaphragm wall and the top has moved less than previously shown. The displacement of the SAA at the Stage 7 excavation level is also a lot closer to the Amber trigger. Movement over the two week excavation period is shown to be 10mm as opposed to 5mm. Based on this observation, concrete for the construction of the base slab was poured around the foot of the diaphragm wall first in order to provide extra support and slow the movement at the toe of the wall. The concrete pour commenced on 23/09/2012 and after completion the movement of the diaphragm wall at excavation level and at the base was observed to slow and no further increase towards the Amber trigger was observed. The remaining excavation was re-scheduled to start from the centre of the box, to allow the movement of the diaphragm wall additional time to stabilise. The graph showing the corrected movement through Stage 8 shows that there were no trigger breaches and any movement was negligible due to the remedial actions that were taken.
Conclusions
This paper has documented the role the Shape Accel Arrays have played in the monitoring of the diaphragm wall of the southern section of the Tottenham Court Road Western Ticket Hall during excavation and propping, and how they have been used within the Management Plan for the Control of Ground Movement to assist in the control of the works. It has shown the huge advantage they have over the previously used in-place inclinometers and manual inclinometer probes, in terms of cost, time, and the quality of the data and the frequency of the readings.
The use of the SAAs at the WTH enabled the Value Engineering proposal for the omission of the level P5 props to be drawn up, and the subsequent acceptance of this proposal due to the quality and frequency of the SAA readings taken from the start of the excavation to P4 level. The data obtained from the SAAs allowed the back-analysis of the readings and the refinement of the triggers. The omission of the P5 level props has provided the contract with significant cost saving and reducing the programme by 26 days. The use of the observational method, and the continual evaluation of the SAA data throughout the dig to the base slab, have provided confidence that wall movements were not breaching the trigger levels and thus not exceeding the structural capacity of the diaphragm wall.
As the SAA were installed to the bottom of the panel of the diaphragm wall, and not drilled through the toe of the wall with a 10m anchor, the 3D Geodetic Prisms at the top of the wall were manually monitored and the data obtained from this used to provide correction values to the SAA data. This showed an increase in movement into the excavation of the base of the wall, as opposed to a movement in the top of the wall as was previously shown when the base of the SAA was assumed fixed. By noticing this movement the preventative pouring of concrete binding around the diaphragm wall, and the commencement of the next stage of excavation from the centre of the box, allowed the movement in the wall to stabilise ensuring that no triggers were breached.
Unlike traditional In-Place-Inclinometers (IPIs), SAAs fit snugly within their casing with the joints or ‘knuckles’ between segments expanding outward when downward pressure at the top of the SAA is applied and then clamped. Traditional IPIs have probes at set lengths (usually 500mm) with sprung loaded jockey wheels at the top and bottom of each probe. The jockey wheels can be prone to failure over time, reducing the accuracy of the instrument. These can be time consuming to replace and involve the removal of the instrument.
Manual inclinometer readings were taken alongside the SAAs at the TCR WTH, and because of this the clear advantages of the SAA were highlighted. A trained technician is required to install and take readings with manual inclinometer probes, and process the data obtained. This is costly and considerably more expensive than using SAAs, which only require a trained technician to install and set up the instrument. There was also the issue of access to the inclinometer casing to take readings with the inclinometer probes, as some of the inclinometer casing was within the gantry crane beam and hence required the gantry crane to be stationary for upwards of half an hour per manual inclinometer to allow time for reading. This resulted in loss of time for the contractor, BFK, and was not desirable.
References
- Harris D.I., 2012, ‘Management Plan for the Control of Ground Movements: Addendum 5: Tottenham Court Road Station – Western Ticket Hall Excavation’ Revision 4.
- Harris D.I., 2012, ‘Tottenham Court Road – Western Ticket Hall, Instrumentation and Monitoring Proposals’ Revision 2.
- Ridley A., Kavanagh J., Lardi M., Saffari N., ‘Results from a Trail of a New Displacement Monitoring Tool (Shape Accel Array)’
- SAAF Specifications, [Online], Measurand Geotechnical, Available: http://www.measurandgeotechnical.com/docs/saaf_specification_5sep2012.pdf
- ‘Is this the shape of things to come?’, [Online], Railway Strategies, Available: http://www.railwaystrategies.co.uk/article-page.php?contentid=11389&issueid=346
- Akram N. Alshawabkeh, Krishna R. Reddy, Milind V. Khire, 2008, ‘Characterization, Monitoring, and Modeling of Geosystems: Proceedings of Selected Sessions of Geocongress 2008’ pp.534-540.
- Abdoun T., Bennett V., Dobry R., Thevanayagam S., Danisch L., 2008, ‘Full-Scale Laboratory Tests Using a Shape-Acceleration Array System’
-
Authors

R. Lipscombe - Keller Getec ITMSoil JV
Keller Getec ITMSoil JV
C. Carter BEng - Keller Getec ITMSoil JV
Keller Getec ITMSoil JV
Olivia Perkins MEng(Hons) - BAM Ferrovial Kier
BAM Ferrovial Kier JV
Paul Thurlow - Getec UK, Keller Getec ITMSoil JV
General Manager, Getec UK
S. Guerrero MICE CEng MBA - BAM Ferrovial Kier
Bam Ferrovial Kier JV