Validation of the Tunnel Pressure Signature of the Crossrail Class 345 Train
Document
type: Technical Paper
Author:
Ian Ryall, Martin Wilson, ICE Publishing
Publication
Date: 31/08/2016
-
Read the full document
Notation
CFD Computational Fluid Dynamics
DMS Driving Motor Second
DTS Driving Trailer Second
FS Full-Scale
MMR Moving Model Rig
TPS Tunnel Pressure Signature
△p Change in pressure relative to the undisturbed condition
△pfr Friction pressure rise
△pN Nose pressure rise
ρ Density of air
V Velocity of the model or full-scale trainSubscript MMR denotes a value from the moving model rig test.
Subscript FS denotes the value for full-scale conditions.Introduction
For any particular combination of train and tunnel, the characteristic pressure transient is known as the tunnel pressure signature.
This paper describes the measurements and analysis that have been carried out to demonstrate that the Class 345 train design meets Crossrail’s requirements for the nose pressure rise and friction pressure rise of the tunnel pressure signature to be below clearly specified limits. Compliance with these requirements is necessary to ensure an enhanced level of passenger comfort, and to avoid excessive loading on items of infrastructure such as platform screen doors and tunnel ventilation equipment.
Tunnel Pressure Signature Requirements
For the Class 345 project, the Train Technical Specification[1] specifies a limit of 3 kPa in 4 seconds for the train entering, passing through, and exiting from the Central Section tunnels at the line speed of 100 km/h. There is also a requirement for individual repeated pulses not to create a pressure change in excess of 0.7 kPa with a period of 1.7 seconds.
Analysis by Crossrail has determined that these requirements will be met if the nose pressure rise and friction pressure rise do not exceed 0.68 kPa and 0.37 kPa respectively, when measured on the tunnel wall at a height of 1.5 m at a location 100 m from the portal.
These requirements are more onerous than the usual British pressure comfort criterion which since 1986 has been for the pressure change on entering a tunnel to be limited to 4 kPa within a 4 second period.
Figure 1 shows how the nose pressure rise and friction pressure rise are defined in the Train Technical Specification[1].
![Figure 1 - Definition of Nose Pressure Rise,△pN, and Friction Pressure Rise △pfr (Reproduced from Train Technical Specification[1])](https://learninglegacy.crossrail.co.uk/wp-content/uploads/2016/12/7E-029-Figure-1.jpg)
Figure 1 – Definition of Nose Pressure Rise,△pN, and Friction Pressure Rise △pfr
(Reproduced from Train Technical Specification[1])In an Appendix to the Train Technical Specification[1], Crossrail provided further details of the methodology for demonstrating compliance with these requirements.
Methods for Demonstrating Compliance
The specification allows three different methods for determining the required characteristics. These are: simulation using validated Computational Fluid Dynamics (CFD) simulations; full-scale test; and model-scale testing on a moving-model rig.
Use of CFD simulations would have been possible, given Bombardier’s expertise in this field. However, it would have been necessary to validate the simulation software for use on this task. This validation would have involved either full-scale measurements or model-scale measurements of a similar train and tunnel combination.
Measurement of the tunnel pressure signature in a full-scale experiment, inevitably involves some practical difficulties. A suitable tunnel, of the requisite length, needs to be identified, and checked to ensure that it is adequately air tight. Any ventilation shafts would need to be sealed. If a full-scale experiment had been used to validate CFD simulations, a train or trains with some similarity to the Class 345 would have had to be tested.
Measurement of the tunnel pressure signature of the Class 345 train in the Central Section tunnel could not have taken place until both the train and tunnel were ready for operation.
It was considered important to demonstrate at an early stage that the train design would meet the demanding technical requirements for tunnel pressure signature, and to eliminate any risk of non-compliance as early as possible in the design process. Therefore, it was chosen to measure the tunnel pressure signature using a scale model on a moving model rig.
Test Methodology
The Moving Model Rig
The moving model rig used for this investigation enables measurements to be made of transient aerodynamic effects. It consists of a 150 m long track, along which model vehicles can be propelled by catapult at representative train speeds.
For the tests on the Crossrail Class 345 train project, a model train and a model tunnel of 1/25th-scale were used.
Model Tunnel Geometry and Characteristics
To obtain representative results for the Tunnel Pressure Signature of a train, it is necessary to test with at least a critical length of tunnel. When the head of a train enters a tunnel, a compression wave is generated which propagates through the tunnel at the speed of sound. At the exit portal the majority of this head wave is reflected as a rarefaction wave and propagates back towards the entry portal. The tunnel used in the test needs to be sufficiently long such that the head has passed the pressure measurement point on the wall of the tunnel before the rarefaction wave reaches that point.
For a train entering a tunnel at 100 km/h, a minimum length of tunnel of 670 m (full scale) is required. The model tunnel was constructed with a length of 27 m, corresponding to a full-scale length of 675 m.
In a model-scale experiment, the Mach number must be respected, so the test is performed at the real train speed and the critical length of tunnel is scaled by the same factor as the model.
For the rig to produce representative results for Tunnel Pressure Signature, the blockage ratio, the ratio of the cross-sectional area of the train to the cross-sectional area of the tunnel, has to be correct. As the real tunnel incorporates a number of features, including a walkway, which reduce its effective cross-sectional area, it was necessary to adjust the geometry to obtain the necessary blockage ratio. The approach that has been taken is to maintain the correct 6 m diameter of the tunnel bore, but to lower the tunnel slightly relative to the track bed to give the correct cross-sectional area of 26.22 m2.
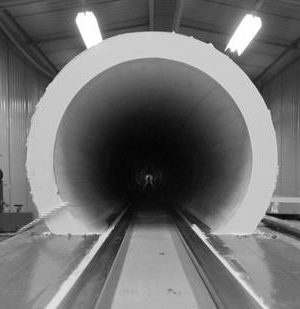
Pressure measurements were required at a height of 1.5 m above rail level, 100 m from the tunnel entrance. Pressure tappings were drilled in the left and right walls of the tunnel at the required locations and unsteady pressure transducers were mounted on the outside of the tunnel wall.
Figures 2 and 3 show the tunnel model.
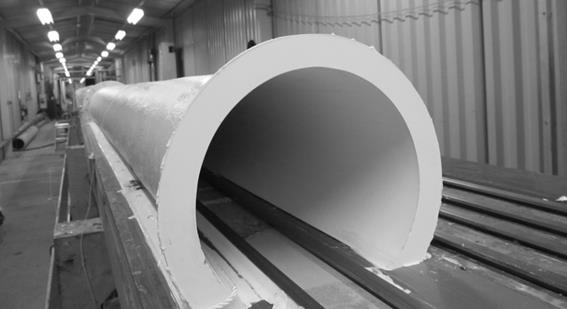
Figure 2 – View of Tunnel Entrance 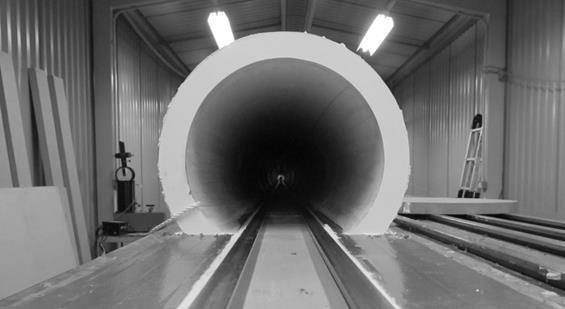
Figure 3 – View Into Tunnel Sealing of Model Tunnel – Methodology
To obtain reliable measurements of Tunnel Pressure Signature from the moving model rig, it is essential for the model tunnel to be very well sealed, such that any decay in pressure due to leakage during the passage of the train is insignificant compared to the pressure changes caused by the train. In other words, the time constant for the decay due to leakage must be much longer than the time taken for the train to pass the measurement point.
The methodology for assessing the leakage of the moving model rig tunnel was to seal the ends of the tunnel with end caps, pressurise the tunnel to approximately 2 kPa, and then measure the leakage rate. This test was performed after each section was laid, so that any inadequacy with the sealing could be identified and rectified before proceeding. The results of the final leakage test showed that the pressure decays to half its initial value in approximately 9 seconds. At a speed of 100 km/h, the first four cars of the train (length 3.6 m) take 0.13 seconds to pass the measurement point in the tunnel, during which time the leakage of a steady-state pressure would be less than 1%. The leakage rate was therefore acceptable.
Model Train Description
The model train was made using conventional model-making techniques. Each car was made as two GRP half shells, mounted on a metal spine and sealed together around the outside. Details such as underframe equipment were generally made from balsa wood.
As the pressure signature is required 100 m from the portal of the tunnel, the first four cars of the train were made to represent the design of the train. A fifth car was added to avoid an unrepresentative situation after the fourth car. To provide some useful data for a driving car at the rear of a train, another driving car was used as the fifth car of the model train.
For the assessment of the tunnel pressure signature, only the first four cars are relevant. The first four and last four cars of the real train are externally identical, so the tunnel pressure signature of a nine-car train is the same in both directions.
Figure 4 shows the model on the moving model rig. At the time the photographs were taken, the driver’s steps and intercar couplers were not present on the model, but representations of these were subsequently added, as described below.
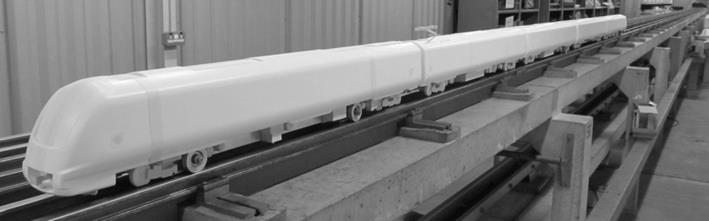
Figure 4 – View of All Five Cars of Model Full-Scale Conditions
All results presented in this paper have been scaled with dynamic pressure to represent full-scale conditions of standard atmospheric pressure (101325 Pa) and a tunnel air temperature of 27°C. A reference temperature of 27°C is used as it is considered to be pessimistic relative to the range of 30°C to 35°C given in the Train Technical Specification[1].
Moving Model Rig Test Conditions
To obtain valid results from the moving model rig, it is necessary to test at a representative Mach number. For a train speed of 100 km/h, an atmospheric pressure of 101325 Pa and a temperature of 27°C, the Mach number would be 0.080.
For each run, measurements were made of the temperature, atmospheric pressure and relative humidity. The effects of relative humidity were taken into account using empirical equations[2].
Unsteady differential pressure transducers were used to measure the pressure at each of the pressure tappings. Measurements were made relative to the pressure at a reference point underneath the rig where the pressure is unaffected by train movement. Long tubes were used between the transducer and the reference point.
The model train speed for each test was determined from measurements of the time difference between signals from pairs of light gates 1 m apart, ahead of the tunnel entrance.
The results from the moving model rig were scaled to the desired full-scale condition using Equation (1).
△pFS = △pMMR * (½.ρFS.VFS2) / (½.ρMMR.VMMR2) (1)
Results
For each configuration, three runs were performed and measurements were made on both sides of the tunnel. The results from the three runs have been adjusted to remove any time offset, so that the rapid pressure rise from the nose entry of all three runs occurs at the same time. For each configuration, an average time history has then been created, based on all six traces.
Repeatability
Figure 5 shows the typical repeatability obtained from the rig. All runs have been adjusted to the full-scale conditions, as described above. The graph includes the measurements from both sides of the tunnel for three runs.
Figure 5 – Repeatability of Test Results (Six Traces) For each trace, some unsteadiness is observed between 1.2 s and 4 s. This is inevitable when measuring the transient effect of the passing of a train, which incorporates features such as bogies, underframe equipment and intercar gaps. The differences between the results from the various traces are smaller than the unsteadiness within each trace.
Results – Effect of Geometric Changes
A number of incremental changes were made to the model, to gain an understanding of the sensitivity of the results to geometric variations. These included: closing the aperture around the coupler at the front of the train; adding driver’s steps; and adding blocks to represent the intercar couplers and drag boxes. As it is common practice in moving model rig experiments to test without a pantograph, as the effects are usually non-representative, a test was also carried out with the pantograph removed.
Small incremental adjustments were made to the results to create a set of data that was most representative of the actual train geometry. The adjustments included removing the peak in the data at 1.5 s that is likely to be caused by the firing mechanism.
Nominal Result from MMR Measurements
Figure 6 shows the results, including relevant increments, for a configuration with the coupler aperture open, driver’s steps present, no pantograph, and with the peak caused by the firing mechanism removed. The graph also includes the linearisations that are necessary to obtain the nose pressure rise and the friction pressure rise.
Figure 6 – Nominal Result, Showing Derivation of Pressure Rise Values The trace after 3.65 s has not been included in the linearisation as the drop in the trace is probably caused by the relative absence of underframe equipment on the fourth car in the train and therefore has no physical relevance in determining a value for the nose pressure rise.
The intersection of the two trend lines gives a nose pressure rise value of 675 Pa. The friction pressure rise is the difference between the maximum pressure measured and the nose pressure rise. A value of 322 Pa is obtained.
Sensitivity of Results
The nominal results given above were determined using only experimental data from the moving model rig. A number of tolerances and further adjustments need to be applied to the results. The tolerances have been determined by calculation and a correlation factor for head pressure pulse has been obtained from published comparisons between rig and full-scale results. In some cases, effects cannot be quantified, but it is clear that their omission will lead to a conservative assessment.
Effects of Practicalities of Modelling
The firing mechanism and the restraints that hook underneath the rails create blockage that is additional to that of the train.
The trolley wheels are larger in diameter and wider than scale, and therefore cause some unrepresentative blockage. To minimise this effect, the model was designed so that the oversized front wheels of the trolley were positioned at the second axle position of the model train. The rotating wheels further back on the trolley are non-representative, but their effects will be conservative as they will increase the blockage and the aerodynamic drag.
The nominal results presented above have already been adjusted for visible effects on the results caused by the trolley and firing mechanism, but further effects are likely to remain, adding some conservatism to the nominal results.
Effects of Tolerances on Model Train and Tunnel
The model and tunnel were constructed to general tolerances of ±1 mm. The accuracy of the cab shape was much better than this, as it was made using a pattern made on a CNC machine. The car body was made to match the cab shape, so the accuracy of this was also much better than the general tolerance. For calculation of the effect of model accuracy on the end results, an accuracy of ±0.2 mm has been assumed. This represents an accuracy of ±0.4% on cross-sectional area. Consideration of the Sockel equations[3] would give effects of approximately ±0.7% and ±0.9% on the nose pressure rise and friction pressure rise results respectively.
For the tunnel, the general tolerance of ±1 mm has been used for the error assessment. This represents ±0.4% on diameter, ±0.8% on cross-sectional area, giving effects of approximately ±1.4% and ±1.8% on the nose pressure rise and friction pressure rise results respectively.
Effects of Tolerances on Speed Measurement
The train speed was measured to an accuracy of 0.1m/s. This represents 0.36% of the nominal train speed. The effect on the final results will be 0.72%.
The nominal speed was measured by the time taken to pass between light gates positioned 1 m and 2 m ahead of the tunnel portal. A second set of light gates was positioned 1 m and 2 m after the exit from the tunnel. The speed determined from these light gates was typically 12% lower than that determined from the first pair.
The variation of train speed between the first and second pairs of light gates can not be determined accurately, as the deceleration depends on mechanical friction and aerodynamic drag. The drag acting on the train will vary as the train enters and passes through the tunnel. The deceleration will clearly be greater when the train is inside the tunnel. A conservative assessment of the effect of train speed can be made by assuming that the train speed decreases linearly between the two pairs of light gates. The speed measured by the first pair can be considered to be the speed 1.5 m ahead of the tunnel, and the speed measured by the second pair the speed 1.5 m after the tunnel. The tunnel is 27 m long, so the deceleration of 12% occurs over a total length of 30 m. The reduction in speed at the time of nose entry could be estimated conservatively to be approximately 0.6%, so the actual dynamic pressure could have been up to 1.2% smaller than if the train did not decelerate. The effect on the final calculated nose pressure rise would therefore be 1.2%.
The effect of deceleration on the friction pressure rise is more difficult to estimate. However, considering the conditions at the time half way through the generation of the friction pressure rise, i.e. when the nose has passed the portal by 1.8 m, the reduction in speed would be up to 1.3% and the effect on the calculated friction pressure rise would be up to 2.6%.
It should be emphasised that the above assessment is conservative as it assumes that the rate of deceleration is independent of whether or not the train is inside the tunnel when in reality the deceleration will be most rapid when the whole train is in the tunnel.
Effects of Roughness
The model was constructed in a mould from GRP, and therefore has a good surface finish. As a result of the unfaired underframe, the intercar gaps, the front coupler geometry and front skirt, most of the flow over the model will inevitably be turbulent. The skin friction of the model on the rig is therefore likely to be representative of the full-scale train. In the event that there is any unrepresentative laminar separation on the front corners, the nose pressure rise would probably be larger than on the real train. The surface finish of the model is therefore considered to be conservative in its effect on the tunnel pressure signature.
Advice from the operators of the moving model rig is that transition fixing (and therefore the extent of laminar and turbulent flow) does not generally make a difference to tunnel pressure signature results.
The model was constructed with smooth sides, without representation of the slight recesses for the windows, as this information was not available at the time. The dimensions of the recesses are small compared to the intercar gaps, the steps at the front and rear of the HVAC units, and the steps and gaps of the underframe, so the effect on the results will be negligible.
Effects of Advancement of Train Design
Small changes have been made to the front of the cab and the front skirt for stylistic reasons. The radii have typically been increased, except at the corner of the front valance, where the radius has been reduced but is still larger than the radii higher up on the cab front. Overall, the changes to the front corner radii are likely to be neutral or slightly beneficial.
The as-tested geometry included ten sets of brake resistors mounted on the roof. The train design now has the brake resistors mounted on the underframe rather than on the roof. Removal of the brake resistors from the roof will result in reduced drag and therefore a lower friction pressure rise contribution to the tunnel pressure signature.
A number of discrete high-voltage electrical components, including circuit breakers and insulators, that were located in the pantograph well, have been replaced by a box on the roof. This is beneficial for the friction pressure rise as the drag of the box will be less than the drag of the individual components.
Since the model was constructed, the traction layout of the train has been changed. The leading car has been changed from DTS to DMS. In connection with the change to the motorisation layout, a converter case has been moved from the second car to the first car. Even when located on the first car, it is sufficiently far back to have no effect on the nose pressure rise. As it is a relatively large item, its presence on the underframe has the effect of partially filling in the gap between the bogies and therefore smoothing the airflow and reducing the friction pressure rise.
On the model, the firing mechanism and restraining hooks are much more significant than the converter case and the bogie details.
Of the above tolerances, the accuracy of construction of the model train and tunnel, the tolerance on the speed measurement, and the effects of the maximum possible train deceleration have been quantified to a reasonable degree. The other uncertainties, such as the residual effects of the firing mechanism and trolley, and the effects of geometric changes to the train design, are generally beneficial to the tunnel pressure signature, or negligible. The only change that is likely to be detrimental is the effect of the roughness of the window surrounds, but this effect is likely to be more than compensated by the effects of removing the brake resistors.
The tolerances can be combined in various ways. Simple addition, which is very conservative, gives maximum increases of 4% and 6% on nose pressure rise and friction pressure rise respectively.
The Root Sum Square method, which is more reasonable, as it is based on the assumption that the tolerances are independent of one another, gives maximum increases of 2.1% and 3.4% on nose pressure rise and friction pressure rise respectively.
Correlation of MMR Results to Full Scale Results
There is little published data available comparing MMR and full-scale data. However, the data that is available suggests that the moving model rig tends to produce results that are conservative. Two sets of results are available in published literature.
Reference 4 contains a comparison of Tunnel Pressure Signatures measured at full-scale and on the moving model rig for the ETR500 train. The relevant time slice of the tunnel pressure signature data from Reference 4, from just before nose entry to just after nose passing the measurement station, has been plotted at an enlarged scale in Figure 7. The nose pressure rise values at the actual measurement speeds are stated on the graph. Scaling the MMR results to a speed of 180 km/h gives a nose pressure rise of 639 Pa, compared to 595 Pa from the full-scale experiment. The MMR result is therefore approximately 7% higher than the full-scale result. The comparison is not entirely conclusive, as full details of both measurements are not available, but it does suggest that MMR results may tend to be pessimistic.
Figure 7 – Comparison of Full-Scale and MMR Data for ETR500 in Tunnels Reference 5 includes a comparison between pressure histories measured at full-scale and on the moving model rig for a 5-car InterCity Express train in an 82 m2 tunnel. The results are plotted at an expanded scale in Figure 8.
Figure 8 – Comparison of MMR and Full-Scale Data for a 5-car ICE Train in an 82 m2 Tunnel Scaling the MMR results to the same speed as the full-scale results gives 505 Pa for the nose pressure rise on the MMR, compared to 452 Pa from the full-scale experiment. As for the ETR500 comparison above, the results of this comparison are not entirely conclusive, but they do provide further weight to the suggestion that the MMR results may tend to be conservative.
The two comparisons above show that, when the results are adjusted to take account of differences in speed between the MMR and full-scale results, the differences in nose pressure rise appear to be 7% and 12%, with the nose pressure rise from the MMR being larger in both comparisons.
Considering the two comparisons, it is not appropriate to derive a correlation factor for the friction pressure rise. Based on the first, linear part of the friction pressure rise, one of the comparisons suggests that the real pressure rise is larger than obtained from the MMR, and the other comparison suggests it is smaller. However, the differences between MMR and full-scale friction pressure rises are probably within the limits of experimental accuracy. It is therefore not appropriate to apply any correlation factor to the friction pressure rise.
Final Results, Including Tolerances
Table 1 summarises the final results, taking into account all the quantifiable tolerances. Adjustments that would ideally be applied, but which are not quantifiable, will have the effect of reducing the values in the table.
The nominal results are those calculated from the test results. These include a significant degree of conservatism as no correction is included for MMR-to-full-scale correlation. The final results include this correction, but are still slightly conservative as there are some effects that are not quantifiable.
In each case, the margin shown in the table is the difference between the value and the limit in the requirement.
Requirement Standard of Assessment Class 345 Train Margin Status Nose pressure rise
△pN
≤ 680 Pa Nominal 675 Pa 1% Compliant Final
(Includes correlation factor of 0.93)
628 Pa 8% Compliant Final plus tolerances up to 653 Pa min 4% Compliant Friction pressure rise
△pfr
≤ 370 Pa Nominal and Final
(Correlation factor = 1.0)
322 Pa 13% Compliant Final plus tolerances up to 341 Pa min 5% Compliant Table 1 – Summary of Results and Comparison with Requirements
For the nose pressure rise, application of the correlation factor of 0.93, together with all relevant tolerances, gives a result which is at least 4% below the requirement. For the friction pressure rise, inclusion of the tolerances gives a margin of at least 5% to the requirement. We can therefore conclude that the train design is compliant with both requirements.
Conclusions
A model of the Class 345 train has been tested on a moving model rig. This paper provides details of the test methodology, and analysis and interpretation of the results, including a discussion of the effects of tolerances on the final results.
Application of the relevant correlation factors and tolerances to the results gives values that are compliant with the requirements.
It is therefore concluded that the train complies fully with the tunnel pressure signature requirements of the Train Technical Specification[1].
References
[1] C160-MMD-R1-RSP-CR001-50002 Issue 5.5, Train Technical Specification. Crossrail Technical Directorate
[2] Kaye & Laby Online, Table of Physical and Chemical Constants, Section 2.1.1, Mass, volume and density. National Physical Laboratory
[3] Sockel, H. (2003) Formulae for the calculation of pressure effects in railway tunnels. Proceedings of the 11th International Symposium on Aerodynamics and Ventilation of Vehicle Tunnels, volume 2, pages 581–595, Luzern, Switzerland, July 2003
[4] Johnson, T. and Dalley, S. 1/25 Scale Moving Model Tests for the TRANSAERO Project, AEA Technology Rail
[5] Pope, C.W. The Simulation of Flows in Railway Tunnels Using a 1/25th-Scale Moving Model Facility, British Rail Research
-
Authors

