Challenges of Integrating Electrical Systems in a Mega Project – Examples from Crossrail
Document
type: Technical Paper
Author:
Jonathan King FIET, Malcolm Anderson BEng(Hons) CEng MIET, David Brooks
Publication
Date: 17/05/2023
-
Read the full document
1 Introduction
This paper presents case studies of events caused by systems integration challenges. They are hard to uncover and difficult to foresee during a complex project. The issues raised in this paper highlight that integration is not a one-off event at each stage of design and that it needs to be undertaken as a continuous process in the life cycle. The paper highlights the importance changes in one system that has already been through assurance and life cycle can have an impact in other systems. During final commissioning and entry into revenue service stages integration issues quickly emerge. These type of issues need resolving quicky before handover of the systems to operators and maintainers. Some of the causes can be the from the following:
- Understanding the environment of the systems in final operation;
- Development of systems after their interfacing systems have been delivered;
- Information exchange from suppliers to manufacturers;
- Effects of late design changes at final stages of a project.
The impact of the issues can manifest themselves in different ways which can include;
- Service affecting failures – equipment failure,
- Equipment damage – replacement,
- Excessive alarms at the control centres – creating heavy workload,
- Operation and maintainability – restrictions.
Integration is “ the action or process of combining two or more things in an effective way.” In a complex project such as Crossrail the programme can be 15 years. In early stages the system was designed by one team, but later subsystems and components were decomposed to suppliers to design, install, test and commission. See figure 1, as an example. This makes it complex to maintain the correct interface and integration at all times through the complete life cycle.
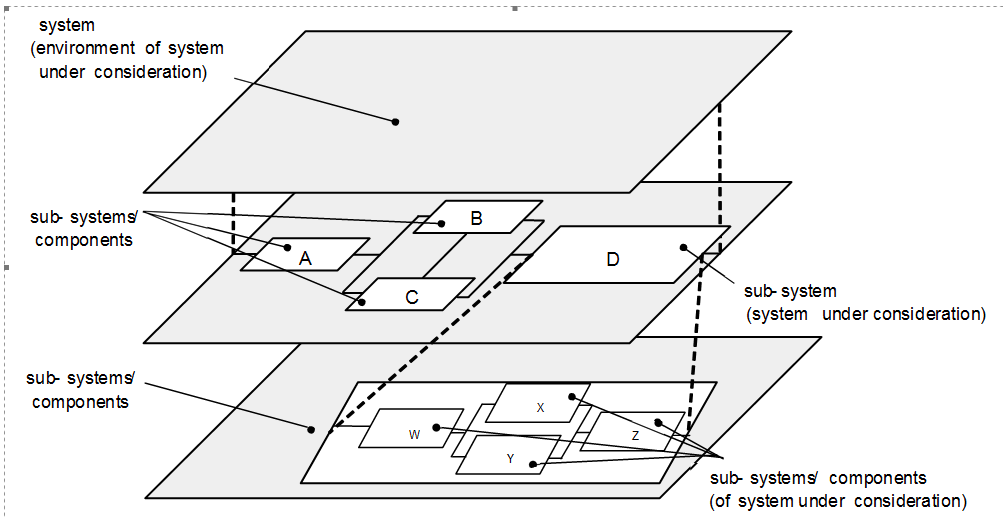
Figure 1 – Systems, sub-systems and components
Integration should be considered in the stages for final operation and maintenance as it leads to increased whole life cost e.g., difficult to operate and or maintain. Various project organisations can view integration as a low priority due to focusing on delivering their scope. Others can see it as a source of extra cost and potential delay. Integration is becoming a separate discipline as it has a much wider viewpoint connecting many layers in organisations and various stages in a complex project. This paper presents findings through various case studies demonstrating some of the challenges at various stages of the project life cycle.
2 Case Study 1 – Alarms via SCADA
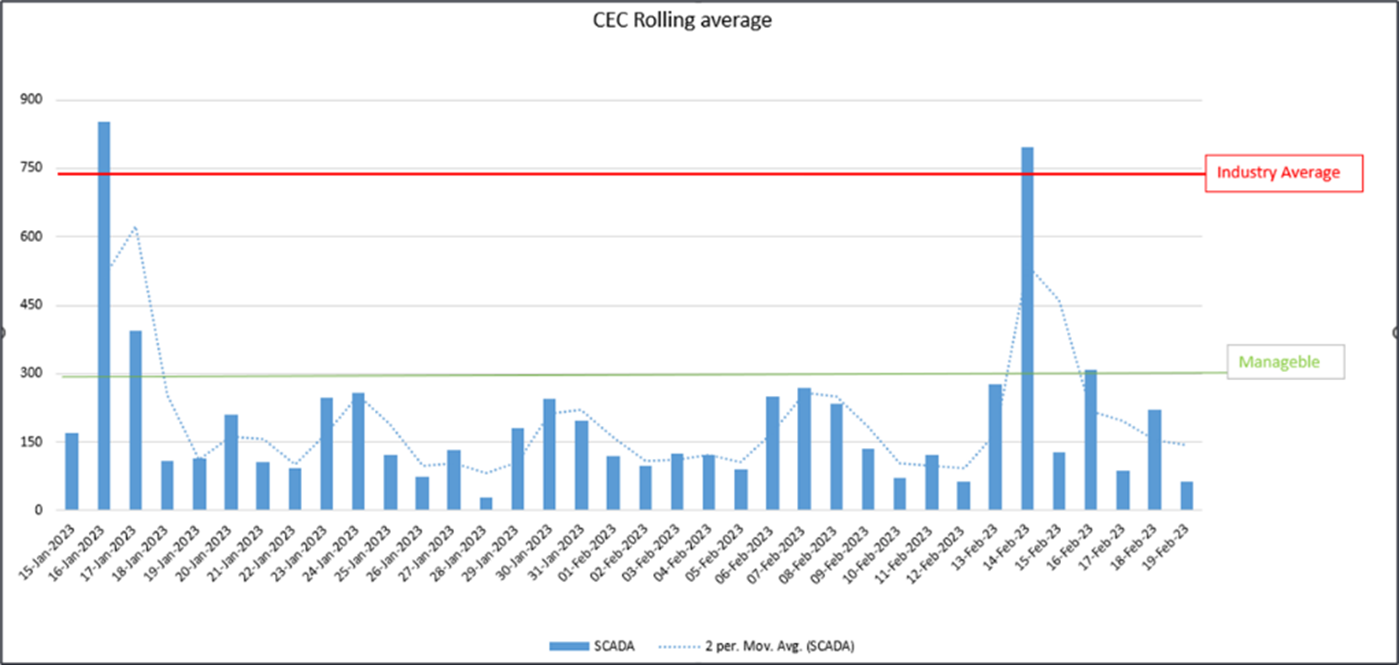
There were an unprecedented number of alarms arriving at the route control centre (RCC). Alarms are also managed by the working alarm forum which indicated various high levels of alarms at different times. Aggregates are shown in figure 2. This puts higher workloads on the control room operators.
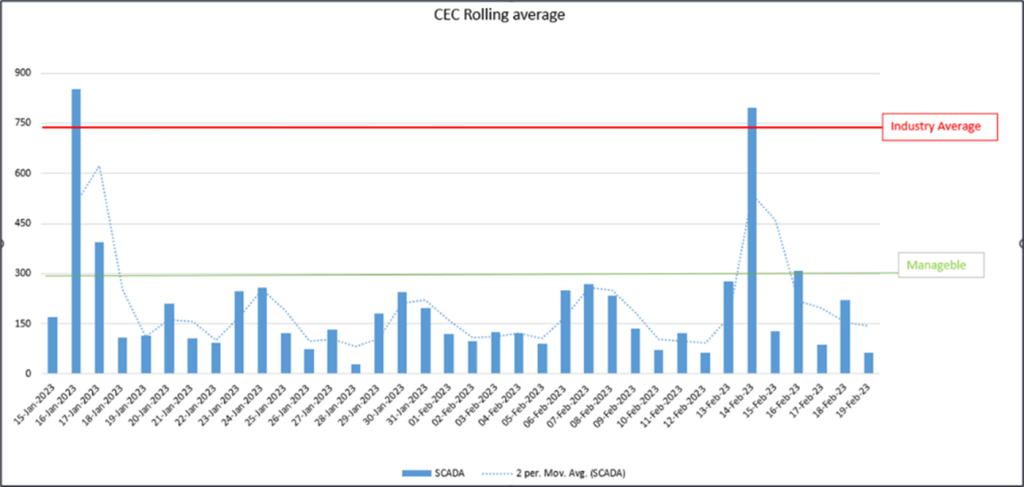
Figure 2 – Alarm Management
We now present two areas of the alarms and their investigations, the low voltage power and switchboard battery chargers, respectively.
2.1. Issue 1 – Low Voltage Alarms
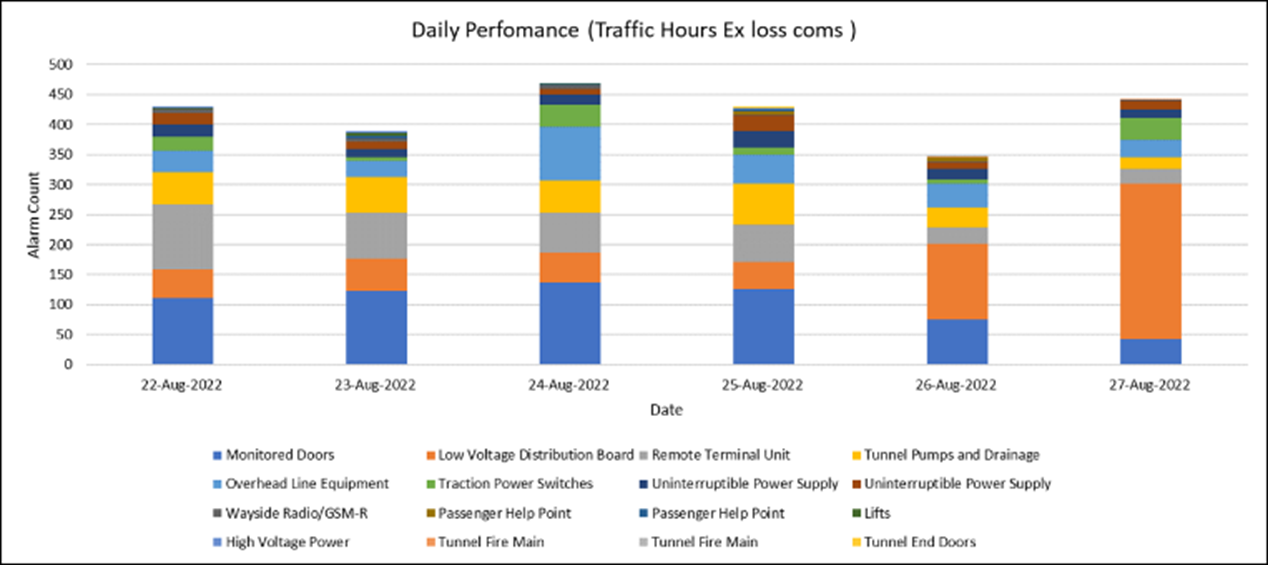
Alarms from SCADA indicated that parameters of the main low voltage (LV) supply had exceeded their limits were seen at the RCC. The LV alarms can be seen in figure 3 highlighted orange. Investigations were undertaken to establish if the alarms were real or spurious events.
On initial investigation it was not clear how these alarms were being raised and which other parameters were being measured. Further investigation discovered that electrical meters on the incoming circuit breakers were monitoring the voltage, current, kVA, kW and kVars.
The alarms occurring in unexpectedly high numbers were for Out of Range (OOR) indicating the measured parameter value had gone beyond the set measuring limit, below 0kW in this case.
The SCADA system and the meters were found to be operating correctly. The issue may have been recognised between designers of the switchboards, shafts and portals, and systemwide assets e.g., SCADA.
The first stage of understanding the issue was to fully comprehend the shaft load trends connected to the switchboards. In their ambient state, under normal conditions they are extremely small. In some cases between 3 and 10 Amps.

Figure 3 – Alarms from various Systems
When the shafts are active the loads can be between 300kW and 600kW. The metering and the instruments that they use have an accuracy of typically 1%. The supply transformers are rated at various sites between 500kVA and 3MVA. Therefore at low loads (within the 1% accuracy range) the meters can read zero kW.
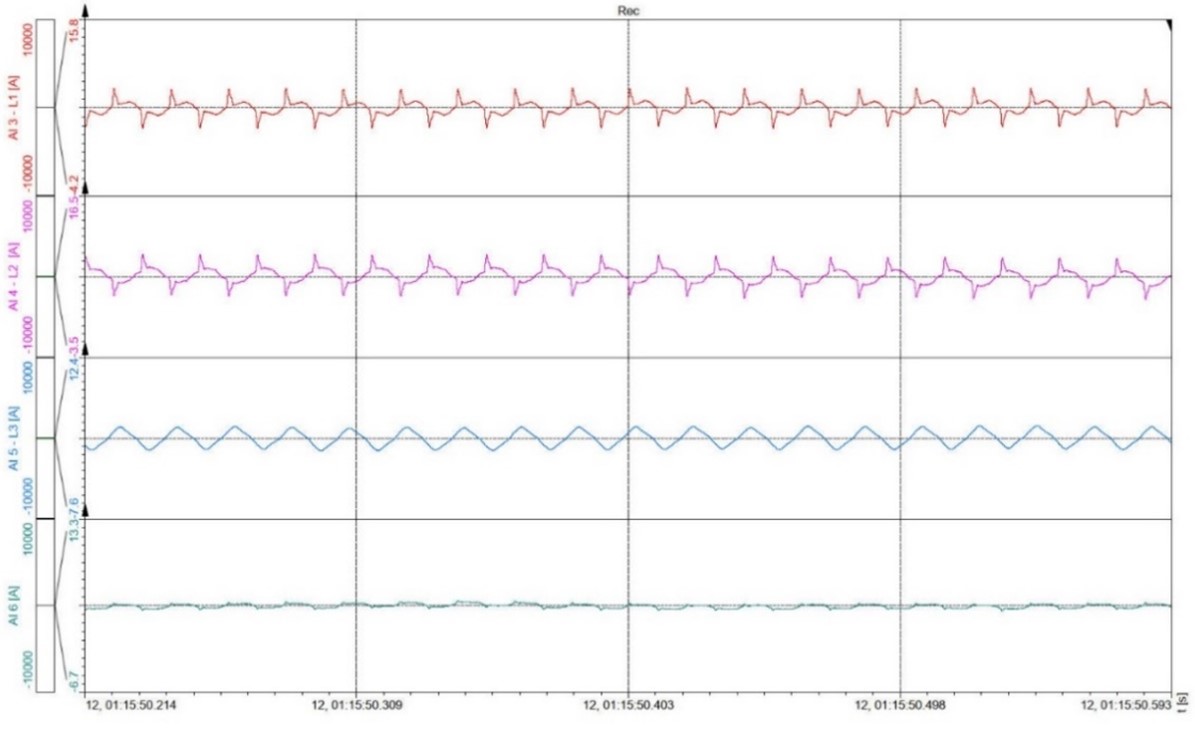
For the majority of the time the shafts operate in low current mode with all equipment in standby mode. The low power loads consist of battery chargers, UPS systems, Communications equipment and LED lighting. These have solid state power modules which take small current pulses at peak voltage resulting in a high cress factor. The nature of the exceptionally low loads were reactive, hence the OOR alarm was raised but not the kVAR OOR alarm. The loads are shown in figure 4.
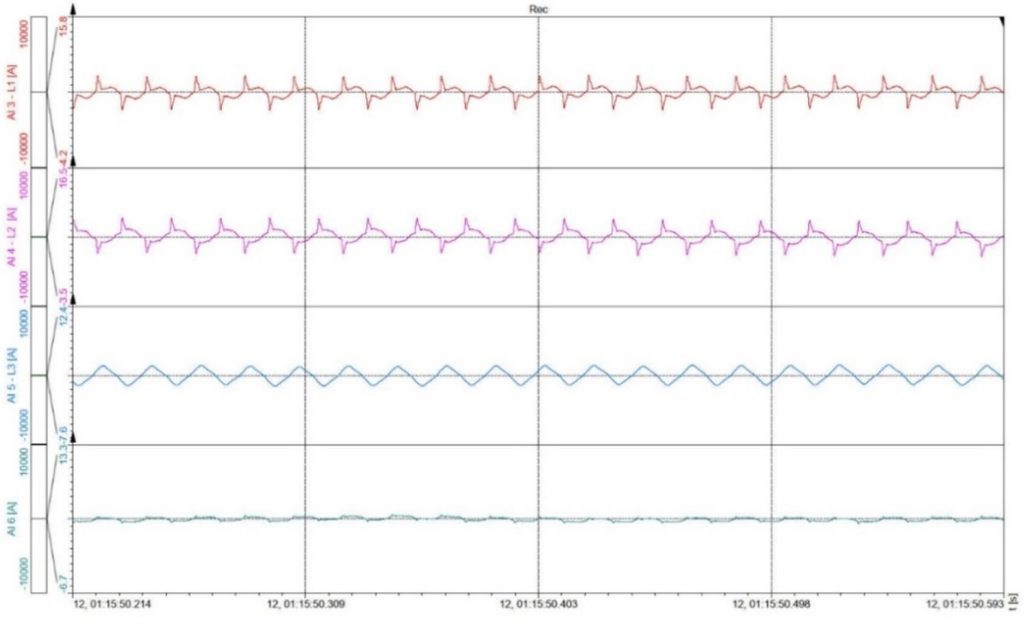
Figure 4 – Very low load from switchboard monitoring
Additionally, the tunnel ventilation system (TVS) uses regenerative braking under emergency conditions. This results in power going back into the shaft LV electrical system. In such circumstances a below zero alarm would be raised even though it is a legitimate event. The TVS was commissioned after the MEP systems at shafts.
The general low load and regenerative braking can trigger OOR alarms. The relevance of the OOR alarm to the control room operator needed to be considered. It was concluded that the operator didn’t need to know this information and didn’t know what to do with it. Alarms of this nature should not have been presented at the control room. Operations and Maintenance functions should be involved in the SCADA design at the earliest stage so that alarms sent to them can be effectively focused.
2.2. Issue 2 – Switchboard Battery Charger Alarms
At each location there are two LV switchboards A and B. Each switchboard is supplied from its own 11kV/400V or 22KV/400V transformer. There is an interconnector cable, busbar circuit breaker and busbar switch between the A and B switchboards such that both switchboards can be supplied from the same transformer.
The remote operation of the main LV switchboards is dependent on having 110V dc supply available. The 110V d.c. supply enables remote opening and closing of LV circuit breakers and the operation of the PLC automatic changeover when one of the two supplies A or B is de-energised. Due to the criticality of the LV switchboards two alternate 110V d.c. sources were required. Different methods for achieving this diversity have been used across the sites, with two shown in figure 5.
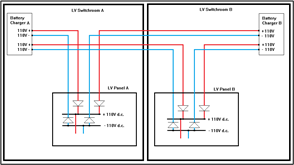
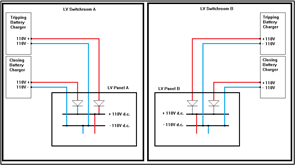
Figure 5 – Configuration 1 (top) and configuration 2 (bottom) of battery charger designs
- Configuration 1 : There is one 110V battery charger in each of the A and B rooms. The 230V supply to the battery charger is derived from the room which it is located in. Each battery charger gives a 110V d.c. feed to both the A&B switchboards. The two battery charger supplies are connected together via diodes in both the positive and negative poles at the input terminal blocks on the LV switchboards. Under normal conditions, the load is shared between both battery chargers. If one battery charger fails, then the other battery charger will take the full load.
- Configuration 2: There are two battery chargers in each of the LV switch rooms (4 in total). Each pair of battery chargers supplies the LV panel which is located within the same room. In each LV switch room the battery chargers are labelled `Tripping Supply` and `Closing supply`. There is one 110V d.c. feed from each battery charger going to the LV switchboard where the two supplies are connected together via diodes in the positive pole. The negative poles from both battery chargers are connected together.
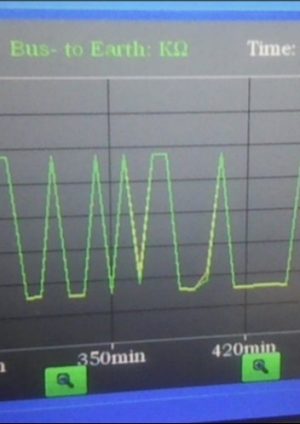
Over a period of time one of the battery chargers in one of the rooms would raise a series of alarms ‘1#Bus Insulation Fault’, and then the nuisance alarms would switch to the other charger. The ‘1#Bus Insulation Fault’ alarm would stay active between 2 seconds and 30 minutes before resetting suggesting that the problem was with an item of plant which was supplied by the battery charger operating. This issue was traced to the battery charger 110V d.c. wiring impedance monitor. The battery charger measures impedance of the 110V d.c. positive wiring and 110V d.c. negative wiring to earth within and external to the battery charger. If the insulation decays to less then the pre-set value of 22kΩ on either the positive or negative wiring then the ‘1#Bus Insulation Fault’ alarm is generated. The impedance monitors on each of the battery chargers operating in parallel was interfering with each others operating resulting in the nuisance alarms.
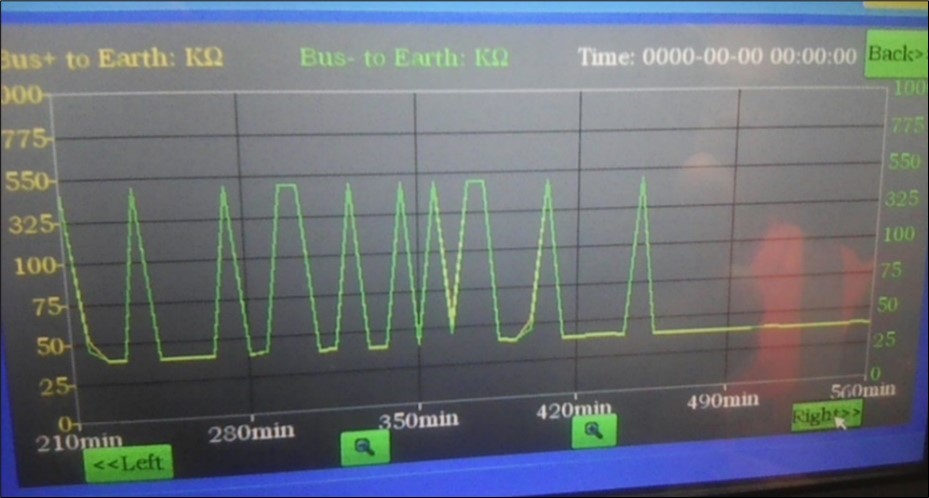
Figure 6 – Battery Charger Impedance
The solution to the problem was to switch off (within the battery charger settings) the impedance monitor on one of the two parallel operated battery chargers. The remaining impedance monitor would monitor the 110V positive to earth and 110V negative to earth impedance for all the 110V d.c. wiring within and without both battery chargers.
The investigation revealed that the battery charger manufacturer did not realise that they would be configured in parallel. This information was needed to configure settings for operation. Where individual items of plant are procured separately the information of the LV configurations should be provided. As the system evolves through the life of the project manufacturers need to be made aware of current configurations. The investigation identified a second minor problem. The 65 configurable alarms within the battery chargers had been set differently at each site. This creates a maintenance burden. Usually the maintainer would expect identical battery chargers across the network and to be configured the same.
3 Case Study 2 – Escalator Lighting
The escalator LED lighting suffered from issues that resulted from integration challenges. These were environmental and complex maintenance conditions.
Subsurface stations feature lighting built into the escalator skirt to provide both normal and emergency lighting. In normal operation the lighting is output at 30% on the escalator steps. In emergency mode lighting is increased to 100%. The skirt lighting is critical to the use of the escalators. If the station is closed this affects the overall performance of the Elizabeth line as they measure on time and PPM measurements. Additionally it is required to comply with statutory legislation. The escalator LED skirt lighting has three key components;
- The LED strips that are located in a channel located on the outside of the escalator machine
- The LED driver and DALI dimmer unit located within the side panels of the escalator
- The DALI control system consisting of a number of DALI gateways located in easy to access rooms connected to the BMS.
3.1 Lighting Failures in service
Escalator LED skirt lighting experienced failures of individual lighting units. Fishbone analysis was used to help determine the route cause in figure 6. There were several potential causes. The lighting components within the escalator machine were all found to be of good quality when used in the free air and individually. However when placed in groups and within housing the components became prone to failure. There were 4 main failure topics, LED driver Box, DALI addressing, design and planned maintenance, respectively, which are now described below;
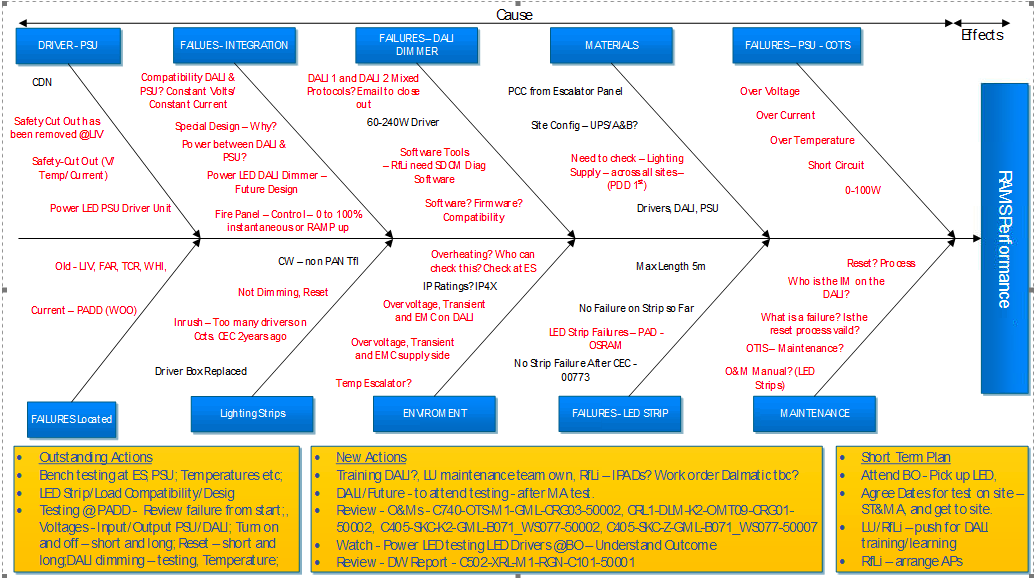
Figure 7 – Fishbone Analysis on LED lighting failures
3.2 Issue 1 – LED Driver Sealed Box
The LED driver units are located within sides of escalators where there is a significant number of moving mechanical components. As a result the requirement was that all componentry should be placed in a secure enclosure. This was to ensure that they did not entangle with the moving escalator mechanical equipment. Accordingly the LED driver and dimmer units were installed in a heavy gauge IP65 rated steel box. However, it was found that the LED drivers had a poor heat transfer which raised the temperature in the box to a point where the thermal operating specification for the LED driver unit was generally exceeded. Operating LED drivers at a higher ambient temperature has possibly resulted in components within the LED drivers de-grading over time. The fault showed itself by individual LED light strips switching off. The driver for that light strip was switched off for 3 seconds and then switched back on with the effect of the LED light returning to service. Additionally the LED driver is fitted with Short circuit, Overload, Thermal overload for the 24V output protection which shuts down the LED driver and is re-set by switching off power to the LED driver for a minimum of 3 seconds. The assumption is that one or more of the protection characteristics has been lowered due to operating the LED driver in high temperatures. The LED drivers and dimmers were tested in an environmental chamber seen in figure 8.
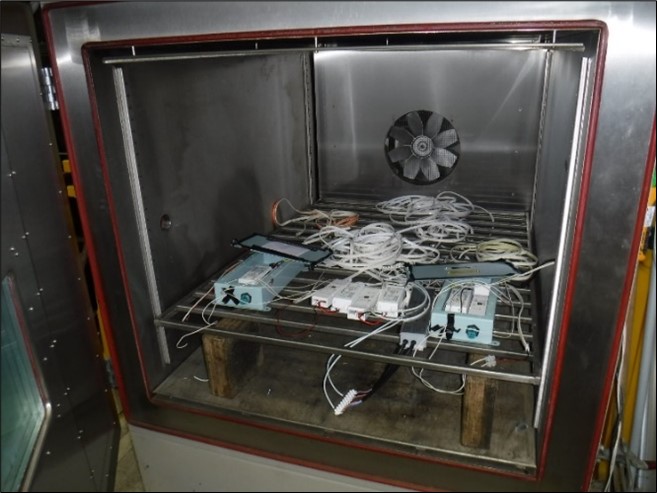
Figure 8 – Environmental test chamber
Controlled tests indicated that the LED drivers which had been recovered from site shut down at 25°C as the temperature was raised from room temperature 11°C to 50°C. At temperatures on either side of 25°C, the recovered from site LED drivers behaved normally. DALI dimmer units performed as expected. There have not been any reports of failed DALI dimmer units. Better consideration should have been given to the effect of installing the LED driver within a IP65 metal box. Type tests of the completed assembly should have been undertaken which would have identified that the LED driver and LED dimmer were being operated in temperatures that can be argued were outside of specified limits.
3.3 Issue 2 – DALI Addressing
The architecture of the DALI lighting system is shown in figure 9. Each of the dimmer units has its own short and long (group) address. When a LED driver failed, the IP65 box containing the LED driver and dimmer was replaced with a new unit. The importance of setting the short and long address in the LED dimmer was not understood with the effect that the replacement units were left with the factory pre-set addresses. This had the effect that the DALI control system could not talk to the replacement unit which in turn went into default mode running the LED light strip at 100%. Over time it became noticeable that numbers of light strips were at 100% among the LED light strips which were operating correctly at 30%. This issue was sorted out once the importance of using the correct short and long address for the replacement LED dimmer units was understood. It was noted that the DALI dimmer addresses on the drawings did not line up with the address of the units installed on site. The works required when replacing one of the combined LED driver and dimmer boxes needed to have been well documented including the requirements to obtain, and then install the correct addresses within the DALI dimmer units.
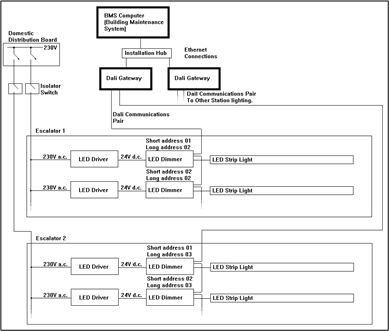
Figure 9 – Typical Dali Architecture
3.4 Issue 3 – Design
The design and provision of the escalator skirt lighting was split between client, manufacturer and tier 1 and 2 contractors. There was no overall designer to ensure that an integrated design was provided for the different aspects of the system. The LV power miniature circuit breaker (MCB) and cable size was specified the same for all escalators. It did not take into account the length of the escalators (number of LED drivers) or the distance between the supply point and the escalators. This resulted in inrush currents to the LED drivers causing an excessive voltage drop over the length of the supply cable which in turn resulted in the LED drivers shutting down from low input voltage and then restarting once the voltage had recovered. This resulted in the LED strip lights flashing on and off as LED drivers started up, and then shut down due to low voltage. The designers of each insulation used their own designs for the DALI system. This resulted in the DALI architecture being different at each installation. At some installations, one bank of escalators would have its own DALI Gateway with each escalator having its own long (Group) address. At other installations each escalator had its own DALI Gateway with each escalator having the same long (Group) address. Consideration of LED lighting (and its LV design characteristics, DALI architecture, components) could have been provided with common design, which need to consider the number of LED drivers needed for the different length of escalators.
3.5 Issue 4 – Maintenance
Maintenance boundaries were challenging with respect to the escalator skirt lighting. The installation has resulted in 3 different parties being required to attend an escalator skirt lighting fault. Escalator maintainer to stop and isolate the mechanical parts of the escalator and to remove the escalator side panels. The MEP maintainer to identify the fault, isolate the skirt lighting and to change the LED driver dimmer box. DALI maintainer to program the addresses into the DALI dimmer and to test operation from the BMS system. These requirements may have been avoided if the LED driver and dimmer units were located outside of the escalator mechanical sections. This would allow the MEP engineer access without requiring support of the escalator maintainer, and the MEP engineer would be able to reprogramme the dimmer with the Escalator maintainer or DALI maintainers involvement. This would also have avoided the heating problem as being outside of the escalator machinery, the LED driver and dimmer units would not have needed to be within a IP65 box.
4 Case Study 3 – Power Supply at Plumstead Stabling Facility
At the early stages of the project the Elizabeth line trains were to be stabled and maintained in the new depot at Old Oak Common (OOC), Ilford depot and existing sidings along the Great Eastern and Great Western routes. There was no facility for stabling trains overnight on the southeast spur. Traction power supply arrangements were configured to support this arrangement. Two new 25kVA Auto Feeder Transformer Stations (AFTS) were constructed, on at Pudding Mill Lane on the North East Spur and the other at Kensal Green to supply Westbourne Park Auto Transformer ATS. A sectioning ATS was built at Stepney Green Junction so that any one of the three branches could be isolated. This allowed the traction power to be turned off overnight for maintenance access to the central operating section of the railway (COS). It was then identified that a minimum 30 minutes in the morning and evening would be required to position the first and last trains to and from Abbey Wood station to support the timetabled service, e.g. OOC to Abbey Wood. This would severely impact into the availability of maintenance access to the Central section of the railway, i.e. a minimum of 60 minutes engineering time could be lost.
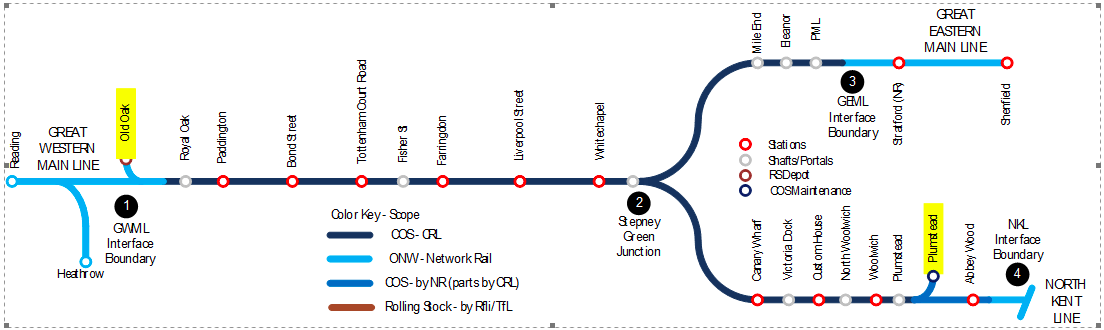
Figure 10 Route – (locations highlighted in yellow)
It was decided to construct a stabling facility at Plumstead to accommodate and stable eight trains. The stabling facility allows the railway to be energised five minutes prior to the start of service at Abbey Wood station. It was understood that this would recover a minimum of 60 minutes of maintenance time in the routeway. However, the Class 345 trains systems and CBTC on board signalling systems operational considerations were not fully known at the design and construction of the sidings. Equipment on the Class 345 train could not operate overnight without traction power, otherwise reboot is required which takes approximately two hours. It was realised that if trains could not be isolated from traction power, then a means to keep Plumstead sidings live was the most feasible solution. The initial idea was to provide a traction power supply on either the eastbound or westbound from Pudding Mill Lane ATS via the Northeast spur to Stepney Green SATS and then via one bound of the Southeast spur. This was found to still severely restrict maintenance access to the COS. It was then decided that a set of positive and negative 25kV feeders be installed between Stepney Green SATS and Plumstead ATS such that transition power could be projected via the overhead line on one bound of the routeway from one of the ATFS and then via insulated cable from Stepney Green to Plumstead ATS and the stabling facility. Following entry into revenue service it has been found that still having to have either one bound in city section or the northeast spur with traction power live over night is still too restrictive for maintenance of the routeway in the COS. This has led to the a new small feeder station to support stabling of the 8 trains at Plumstead Stabling facility only, see figure 11.
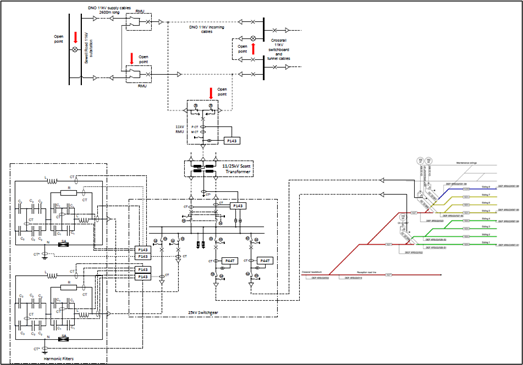
Figure 11 – Additional power at Plumstead sidings
Change to an integrated design can have wide effects into other systems as well as operations and maintenance. The situation described in this case may shows that better integration is needed between the power and its operational power requirements of the Class 345 train and CBTC on board signalling systems and the maintenance access. Integration may have influenced the ATFS location.
5 Case Study 4 – Signalling Access Points (AP)
Signalling access points (APs) are located along the routeway to communicate information between the wayside and the train CTBC systems. The APs communicate with the train over Wi-Fi frequencies. The Wi-Fi aerials in the open areas of the railway have been fixed to the 25kV Overhead Line masts. Whilst in principle this should be fine, it leaves the system open to potential integration issues. Through trial running and entry into revenue service a number of reliability issues have come to light which have become apparent to the operators and maintainers. The APs have a high level of resilience built into the CBTC system. There are 3 areas of interest surrounding the APs, which are the earthing and bonding, resetting and Wi-Fi configuration, respectively. These are now presented below;
5.1 Issue 1 – Bonding
The design of the APs include a surge arrester at the point where the aerial signal enters the AP cabinet. The surge arrester prevents high voltage induced signals on the aerial cable getting into the AP and to mitigate the risk from lightning strike. On sections outside of the tunnel the aerials were located onto the 25kV masts. The aerial cables are held in place on the mast using metal conduit saddles which resulted in the aerial `T` splitter being connected to the OLE mast. This set up a parallel path resulting in a small amount of 25kV return current traveling through the aerial common flowing through the aerial, down the signal conductor and into the Wi-Fi printed circuit board causing parts of the card to be exposed to the excess current which would cause damage and thus malfunction.
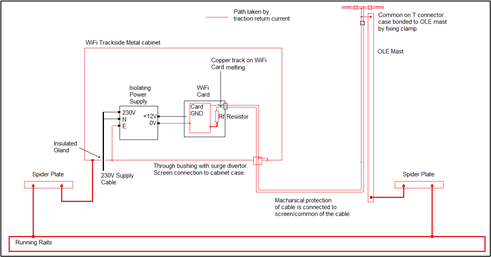
Figure 12 – Signalling AP Bonding Configuration
This configuration usually suits 750V DC and non-electrical railways. In a 750V DC railway the mast is not normally directly bonded back to the return to prevent the flow of DC stray current and the corrosion that it causes. In an A.C. system the mast have to be earthed for safety reasons. This is an oversight in integration design which could have been identified that connecting the aerials to the OLE masts was against the normal overhead line guidelines. Having fully detailed earthing and bonding drawings should all equipment may have mitigated for this with the right assurance measures. This a demonstration that a minor configuration of a very small sub component can have a big impact.
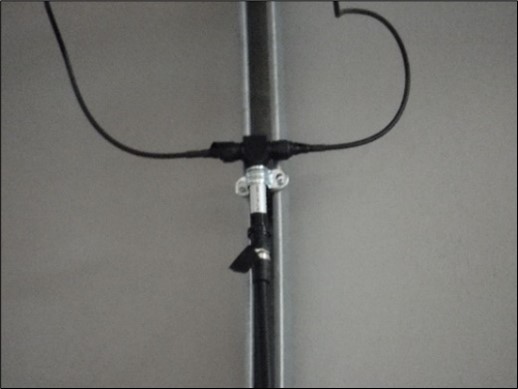
Figure 13 – Earthing and Bonding Configuration of AP
5.2 Issue 2 – AP Units Auto-Reset
During trial operations it was noted that the APs were undertaking regular resets. This was seen more of an irritation as there is sufficient redundancy in the network not cause service affecting failures. Most of the APs automatically reset themselves however a proportion do require manual intervention. Some manual resets could be done remotely but some APs required attendance in the routeway thus was causing a maintenance burden. As the railway went into revenue service it was noted that the resets were becoming more frequent. A considerable amount of testing was undertaken to try to identify the precise cause and it was only once the train service frequencies increased that a trend began to emerge. All of the systems are intelligent and produce vast amounts of data. On initial investigation the failure patterns were being masked as various events did not seem to form any pattern. As engineering delved deeper data patterns did begin to emerge and it was realised that the data returned was not necessary the exact time of events, it was the time a device was polled. It was found that some of the signalling AP units have been carrying out an auto-reset during morning and evening peeks but only on weekdays. This strongly suggested that the issue was with the mass of the train as the service headway was the same all day.
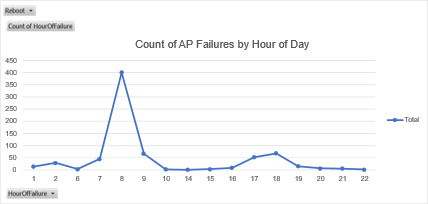
Figure 14 – AP resets over a 6 month period against time of day
Further correlation was identified where trains would take maximum power. The data was extracted from trains during three incidents where the AP shut down. The trains data was compared to the AP data. It was then possible to see the precise time of the AP’s failure and exactly what the train was doing. It appeared that the initiating event was the train finishing the acceleration cycle of traction curve. This was repeated across all of the resets analysed.
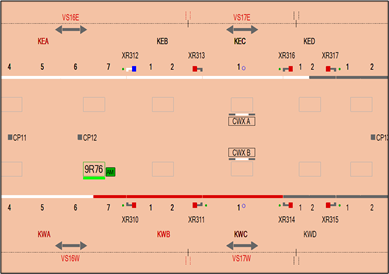
Figure 15 – Position of the train at the time of an AP Reset
The train then presented a voltage spike through the traction return on to running rails. The AP and the running rails are locally bonded together in the routeway for safety reasons. The spike was able to leave the running rails and enter the AP via the bonding. Once the spike entered the AP case it caused problems with the CPU card causing it to reset. The original design for the AP was for it to be completely earth free. Installing the unit on the 25kV railway resulted in the requirement for the AP metal box to be bonded to the traction return system, which allows spikes to bypass the front end filtering and protection.
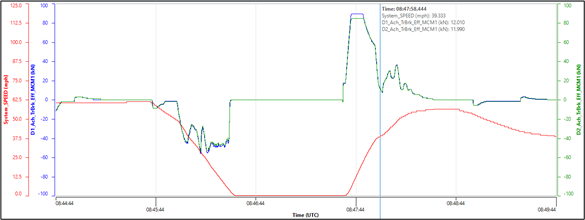
Figure 16 – Traction Current and Speed curves at the of the AP failure. AP failure time as 08.47:58
6 Summary
The lessons learned for integration on electrical systems from these examples are summarised below.
Case Study 1
- Analyse low kW loads and high kW loads in electrical design.
- Involve Operator in alarm design and management from the start of the project.
- For small systems e.g., battery chargers provide a common design at all locations e.g., stations
Case Study 2
- Lighting should be a common design and involve a leading specialist LED manufacturer to integrate the design.
- Architecture and configuration of DALI lighting should be the same at all locations.
Case Study 3
- Review Operational Concept with all systems and at all stages of design.
- Review power isolations needed at all the design stages
- Review the isolations needed on the power systems at all stages in the design with train operations and timetable.
Case Study 4
- Review Earthing & Bonding at all levels of equipment e.g., especially for 25kV railway electrification systems.
- Ensure equipment is suitable for the operating environment.
-
Authors

Jonathan King FIET - Crossrail Ltd
Jonathan has been working on the Crossrail project from 2006, firstly as a Crossrail supplier MDC, and FDC and more recently for Crossrail as an Engineering Manager and Engineering Safety Manager. Jonathan’s responsibility has mainly covered systems design, delivery, construction, and safety engineering aspects.
Jonathan has been in the Railway Industry for nearly two decades, working on projects such as CTRL section 2, Thames Link and SSL 4LM. Jonathan is also undertaking research on the Crossrail project under a programme affiliated with the University of Birmingham (UOB) for Reliability, Availability, and Safety (RAMS) and Integration.

Malcolm Anderson BEng(Hons) CEng MIET
Malcolm is the head of discipline for earthing and bonding in the Crossrail Chief Engineers Group since 2014. He is responsible for the earthing and lightning protection of all of the stations, shafts and portals as well as the running tunnels. He has under taken similar roles on the Heathrow Express, Terminal 5 Stations, Western Dedicated Freight Corridor in India, East London Line and Manchester Metrolink.
He entered the programme in 2009 as part of the design team for Liverpool St Station enabling works, and supervised the construction of the enabling works including relocation of a traction substation, and station electrical switch rooms. He then moved to a role as Head of Electrification for Rail for London for the Crossrail routes in 2013 and oversaw the review of electrification and EMC for the Crossrail Central Section.