Building a Spatial Data Infrastructure for Crossrail
Document
type: Case Study
Author:
Daniel Irwin, Nart Tamash MSc
Publication
Date: 26/02/2016
-
Read the full document
Introduction and Industry Context
The time taken from the conceptualisation of Crossrail in 1974 through to the passing of the Crossrail Bill in 2008 has seen numerous technological advancements that have helped shape the way in which information is perceived. From a geospatial viewpoint, in 1974 most mapping information was recorded in the form of paper maps, whilst by 2008 the vast majority of this information was accessed through digital means known as Geographic Information Systems (GIS). However, the design, construction and operating of this new link through the heart of Central London was expected to continue until 2018, during which time further changes would continue to shape the way in which spatial data would be distributed and accessed.
In particular, the rise of Building Information Modelling (BIM), both globally and in the UK, has changed significantly the way in which data and information is utilised since the passing of the Crossrail Bill, including the advent of the Government Construction Strategy [1] in 2011 which outlines the intention to use collaborative 3D BIM on all government funded projects by 2016. This specifically requires the adoption of electronic storage for all project information, including mapping data which forms part of the graphical and non-graphical source. In order for Crossrail to fully leverage the intelligence of the data and information that would be stored, a robust and scalable method of accessing it would need to be delivered, that not only allowed access to mapping information, but would also allow it to be used as a portal into a number of other systems used by Crossrail, its partners and contractors.
The Need for a Spatial Data Infrastructure
Throughout the lifecycle of the Crossrail programme, from planning and design through to construction and eventual operation, Crossrail has required knowledge of the geography of the route and its surrounds to enable decision making. The delivery of geographical information for this purpose has been driven through the use of GIS, blending cartography, information science and in particular the use of relational database models to provide a centrally managed portfolio of geospatial data.
This data has come from a variety of sources, both internally driven content from Crossrail and its delivery partners, and externally from a variety of third party sources, covering aspects of engineering, asset management, land ownership and logistics to ensure as wide a coverage of information as possible is available.
This wide ranging set of data sources has meant that a GIS on its own was not sufficient for the programme, and that surrounding this a Spatial Data Infastructure (SDI) was required. (An SDI extends a GIS by ensuring geospatial data is used to create authoritative datasets and policies that support it.) The Crossrail SDI provided a framework of standards, policies, data, procedures, and technology that together facilitated the creation, exchange, and use of geospatial data and related information resources across an information-sharing community. In addition, the vision was to provide a gateway to many other information systems within the business, as long as the information within these systems could be spatially identified.
Challenges
During the lifetime of the programme, change was a natural challenge to the use of data, particularly as the programme moved from one phase to the next (fig.1.). Historically data captured during preceding phases of a project or programme was not migrated without significant loss of knowledge, and geospatial data was no exception. Crossrail needed to ensure that data was available, current and useful.
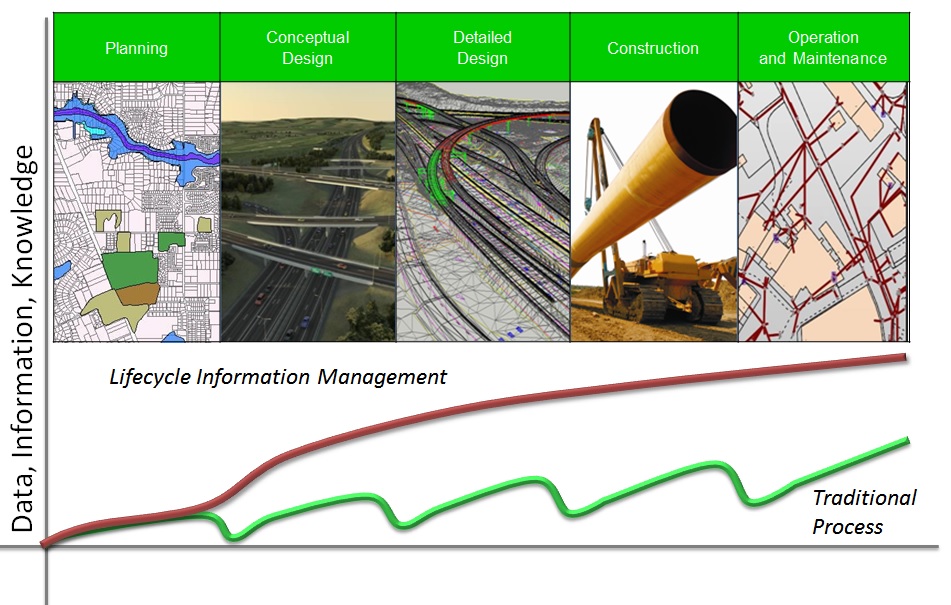
Figure 1 – Visualisation of how as a project moves from phase to phase, knowledge and information can be lost
Scope and Complexity of Spatial Information
The variation of data sources required by Crossrail to assist in decision making processes, particularly when making this data available in a logical manner, made for an exceptional challenge. Cross-discipline data, not only engineering but all geospatial data relating to Crossrail needed to be centrally stored, managed and distributed. This included the presentation of engineering, assets, utilities, legal boundaries, land and property ownership, socio-economic and logistical information in one place so that natural collaboration between groups could occur with only minimal time required to access information.
Engineering Accuracy
One the greatest challenges of the programme was to deliver data that was as geographically accurate as possible. Due to the nature and location of the programme, constructing a completely new set of infrastructure assets beneath London, knowledge of the precise location of a variety of nearby building and other infrastructure required a level of engineering accuracy previously unseen. In addition, interfaces between both the Crossrail design and existing infrastructure as owned by Network Rail and London Underground would need to fit within acceptable engineering tolerances.
Accessibility
In addition to providing a wide-ranging portfolio of geospatially accurate data, it was also required that the data be made available to all of those working on the programme. It was available to Crossrail staff, Framework Design Consultants (FDCs) and primary contractors, through to the infrastructure managers of Network Rail, London Underground (LU), Transport for London (TfL) and Rail for London (RfL). This information needed to be presented through a standard interface which users could access from both central and site offices.
Integration with CAD / BIM
Content delivered to and from the Electronic CAD Management System (ECMS) was undoubtedly the biggest and most complex integration element of the programme. Historically across the industry, the ability to share information between CAD and GIS has been laden with difficulties, both in terms of the way in which information is stored, and the taxonomical classification of that information. Nevertheless it was required that data be shared between these systems as seamlessly as possible.
Approach
In order to create an infrastructure which would allow for the variety and complexity of data that was required by the programme, the variety of challenges outlined above needed to be addressed. A number of different data sources needed to be able to communicate with one another, including a geospatial hub that could allow mapping of data that resided in other systems which did not natively contain a location but contained information such as postcode or address that allowed location to be determined.
Addressing Engineering Accuracy
The UK National Coordinate System, Ordnance Survey National Grid (colloquially called BNG, based on the OSGB36 datum) [2], was determined when the original Crossrail scheme was developed in the early 1990s to be too coarse for the engineering accuracy required by Crossrail, as it could result in distortions of up to 200mm per kilometre travelled due to the curvature of the Earth’s surface. Therefore a new projected coordinate system was required, to minimise the grid distortion within the Crossrail area. This became London Survey Grid (LSG)[3] and combined existing OS survey stations with new ones, reducing the overall distortion to 1mm per kilometre travelled.
A number of zones were designed, each with corrective parameters to help adjust for minute curvature of the ground, to help with this minimisation, resulting in a 7 parameter shift zonal transformation methodology (fig. 2) which could be used to translate data between LSG and BNG. Adoption of this within the Crossrail CAD Standard[4] ensured that all design and construction data was created within a real-world context and allowed for a greater ease of interoperability between CAD and GIS.
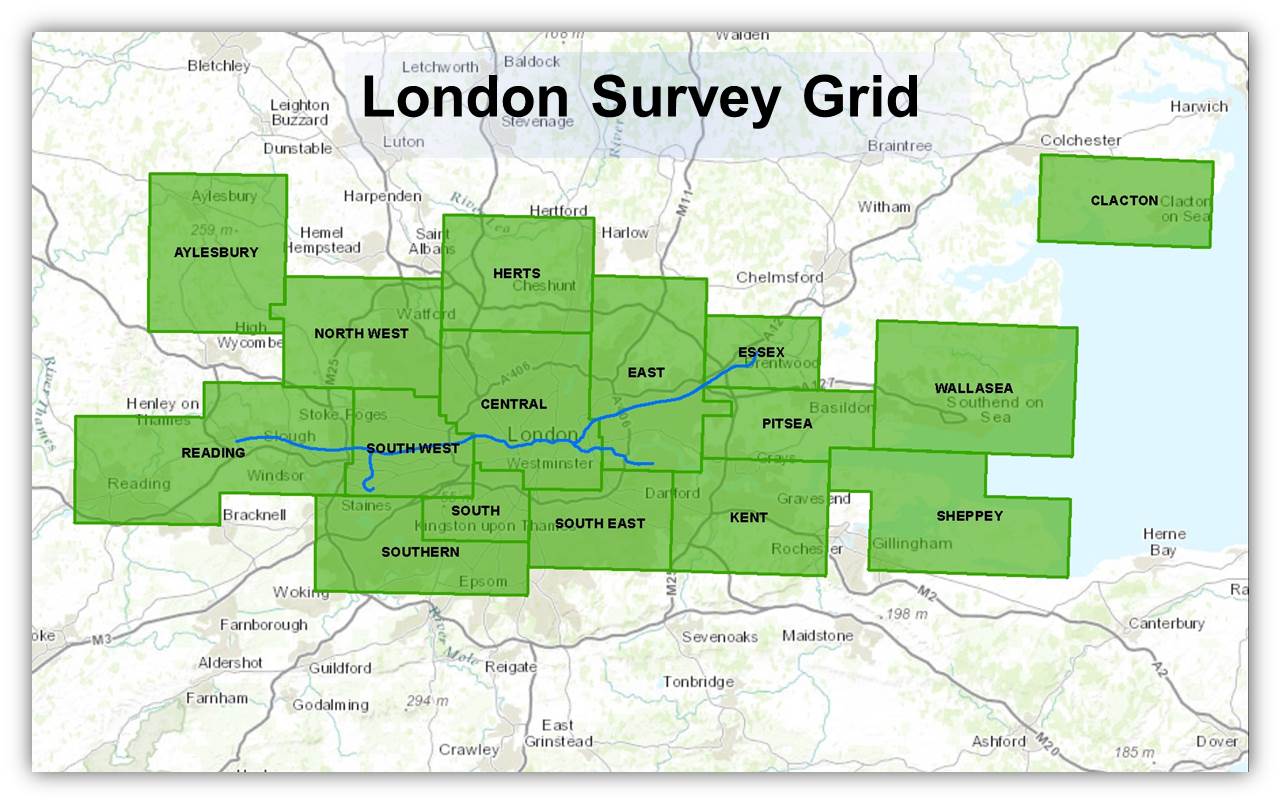
Figure 2 – The London Survey Grid transformation zones
Federated and Master Data Models
Crossrail has not attempted to hold all programme and project information in a single repository. Much of the data resides in business specific systems for purposes other than that which a GIS should or could provide. This includes information derived from ECMS along with the Electronic Document Management System (EDMS), Land Registry System, Estates Management System and others.
Despite the fact that data is held in a number of distributed systems within Crossrail, it is still essential that the contents of such systems contain a clear relationship between each of the others. Although this could be achieved using a geographical similitude between data from different systems where such elements were present, a common method of data classification between systems is also required.
In order to achieve this, a Master Data Model (MDM) was designed and constructed which links all data created by the programme to one of a number of key identifiers. A number of lookups between different key values allows relationships to be created between information such as contract, contractor, location and other entities. These in turn were linked to other data sources using relationships between those key identifiers (fig.3). This was then centrally managed through a process that informs and requires approval from key stakeholders for changes to this content, ensuring consistency across all processes and applications that utilise this methodology.
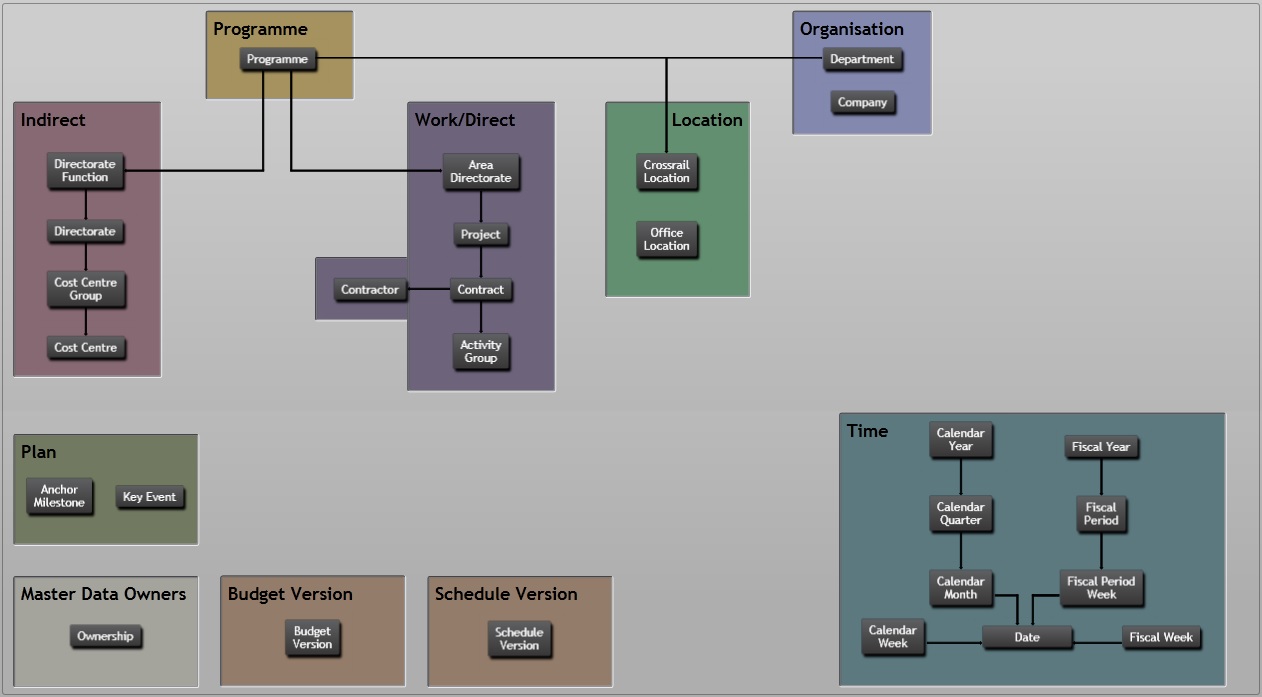
Figure 3 – Master Data Model showing relationships between key identifiers
Spatial data Storage and Interoperability
In order for geospatial information to be able to be used interoperably between different systems within Crossrail, adherence to a common data architecture was required. As the Open Geospatial Consortium (OGC) had already built a common geographic information architecture in the form of the Simple Feature Access Standard[5], it was determined that this standard be adopted by Crossrail.
In addition to a geometric standard, standardised metadata about each data layer captured was also required, to ensure that correct information about the information could be stored, shared and distributed as required. For this, the UK Gemini metadata standard[6] was selected.
In order to house all of this interoperable data an enterprise Relational Database Management System (RDBMS) was required. A number of different enterprise RDBMS solutions were available, but Crossrail selected Oracle Spatial as it was considered to be the most robust and scalable platform, allowing storage of both 2D and 3D geometries to an OGC compliant standard, as well as Linear Referencing, Graph Network and Geocoding capabilities.
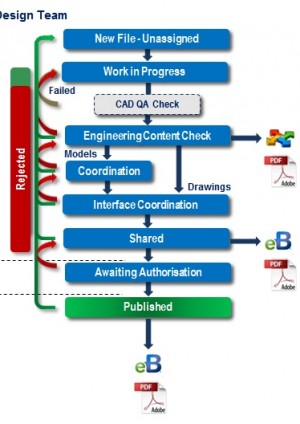
Finally, in order to support the interoperability of CAD, BIM and GIS information, methodologies were adopted to ensure that the right information was made available at the right time. As well as ensuring that the information was available, strict adherence to the publication of data and information from the workflow enshrined in BS1192:2007[7] (fig 4) was required to prevent inappropriate information being shared at the wrong time or with the wrong people.
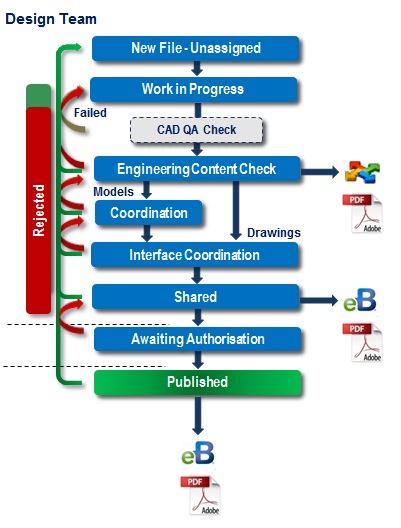
Figure 4 – BS1192 compliant workflow showing how information being shared at the right time to the right people
Realisation
Some of the benefits of Crossrail’s approach to managing spatial data were felt early on in the programme during the planning and design phases. This resulted in the saving of time and money to the programme, primarily from the identification of information without the requirement to search numerous data sources.
Crossrail SDI
The development of an SDI needed to incorporate all of the key requirements already mentioned, in addition the SDI needed to be robust enough to accept many concurrent user requests. The backbone of such an infrastructure would be a reliable core data repository built around the chosen RDBMS. Figure below illustrates a high level system architecture that shows the main flows of information and how it is accessed by the various clients.
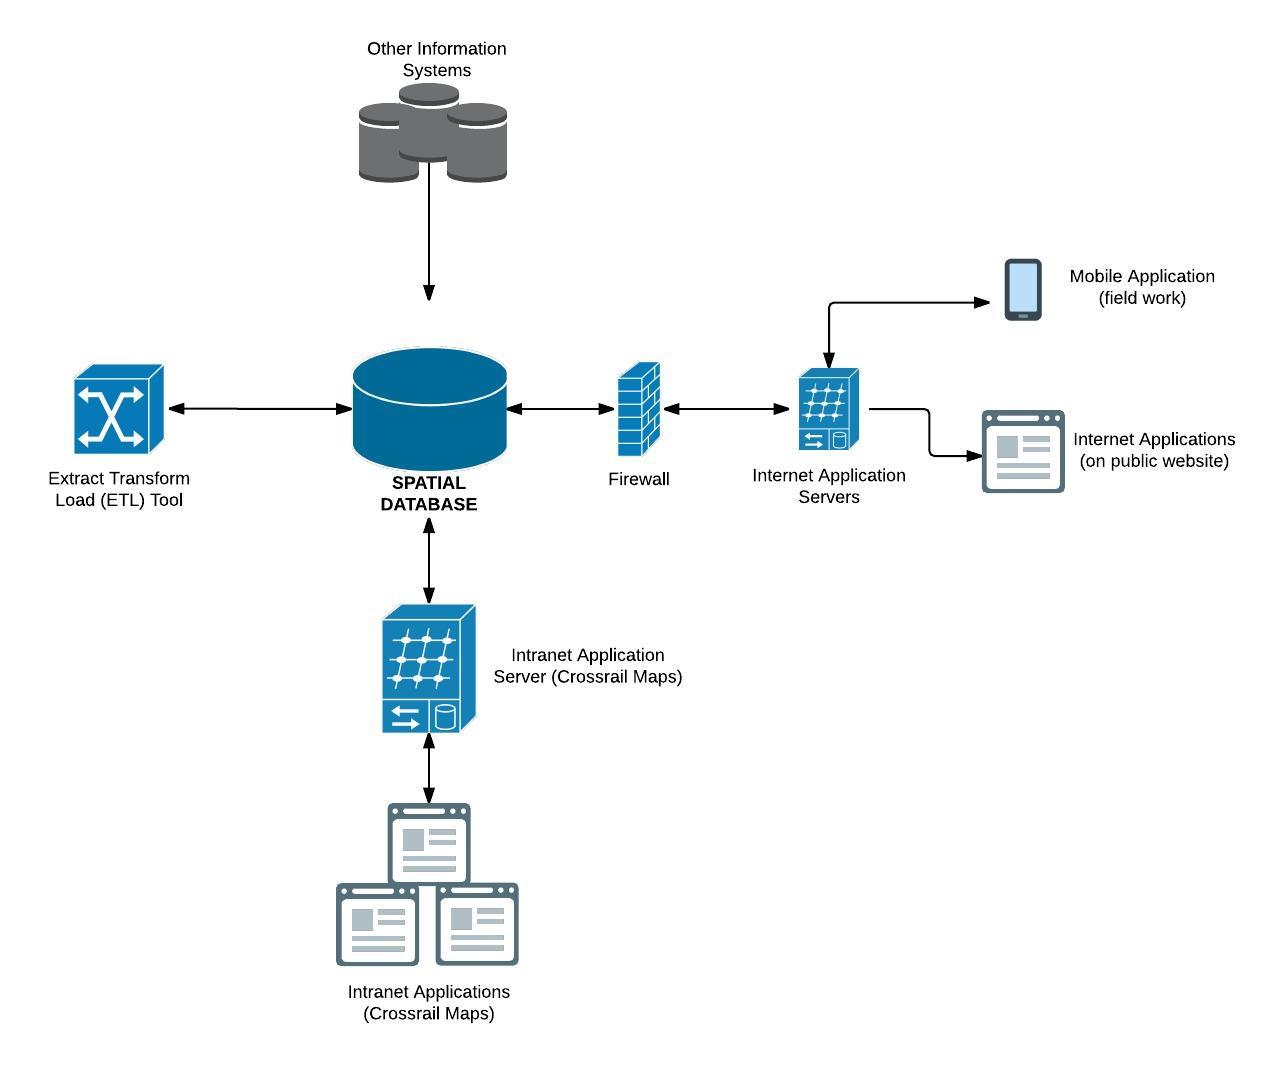
Figure 5 – High level system architecture showing the information flows by various end-users
The primary point of contact with the repository for most users was a web-based intranet portal entitled Crossrail Maps. This contains in excess of 700 mapping layers, classified by organisational discipline, including access to UK Gemini metadata for each layer and, in many cases, links to external resources such as models, drawings, photos and documents. Some of the datasets pulled additional information from other business systems that are based on their own dedicated databases. Due to the internal network restrictions, separate application servers had to be used for certain clients, such as field workers and the general public. Although this setup was configured outside the Crossrail intranet, the data source is still the main spatial database, albeit not as a live feed.
Collecting / Storing / Managing Information
Due to the scope and complexity of the Crossrail programme, data sources were numerous and ranged across many different themes, from the 2008 Crossrail Act derived datasets to traffic, utilities, assets, engineering, environment and more. All this information came in from a variety of systems, both as spatial and non-spatial formats, in addition to which the vast majority required significant resource to keep up to date due to regular update regimes.
As data and information would come from a number of sources, where possible, data was sourced directly from the system in question using database links so that replication or duplication of such information was minimised. In addition this allowed near real-time updates, depending on workflow authorisations in the source systems, to be immediately available within the GIS portal. Where data and information came from external sources, each had its own schema, refresh rates and transformation parameters, so a number of work instructions were developed to manage these update processes. Approximately 60 such documents were authored and maintained by the GIS team, allowing anyone with sufficient technical knowledge to be able to continue to manage these sources.
All incoming data from external parties was transferred from its source format into the RDBMS through FME workflows so that the process was:
- Easy to understand, with a process flow user interface
- Reproducible, with the same workflow being able to be recalled as required
- Re-usable through the use of custom transformers such as a reprojection transformer to convert content into London Survey Grid.
Part of the workflow also embedded metadata about the relevant data source within the RDBMS, automating the update of metadata on subsequent updates so that this metadata requires little management.
Example: Re-use of Data from Contract C122 – Bored Tunnels-Alignment & Track
At Crossrail an information and data management strategy was adopted to ensure best practice through ‘Whole Lifecycle Information Management’; a combination of standards, methods, and procedures, but also software tools and hardware. Lifecycle information management on the project had two main purposes:
- To reduce risk resulting from unmanaged or badly managed data
- To improve efficiency in workflows and data access through the implementation of technology
These principles were applied for geospatial information as well. There were several examples of this but the most representative is Contract C122 – Bored Tunnels – Alignment & Track.
C122 was responsible for the detailed design of the Crossrail running tunnels. The scope of the contract included work in the following areas:
- Ground behaviour, settlement and damage assessment
- Geotechnical services
- Instrumentation and monitoring
- Noise & vibration analysis
- Flood protection and drainage
- Interface management
- Alignment design
- Planning and environment
A wide array of disciplines were involved, including a large number of users, data and information held in a variety of formats and systems. This, along with the ongoing changes to the design (e.g. revisions to the running tunnel alignment and other related components), meant that a number of challenges had to be addressed during the initial phases, and the time and cost to address them was considerable.
The main approach was to re-use as much of the information produced as possible, instead of re-generating it at later stages. To achieve this, a framework of data management structures and procedures, as well as readily available or customised software tools, were implemented. This approach was in line with the lifecycle information management strategy adopted at Crossrail to reduce the loss of information between the various phases of the project (see fig. 6). Given the amount and variety of data produced by the C122 contract, the benefits and cost-savings were considerable, culminating in over 5,000 man hours saved within a 12 month period.
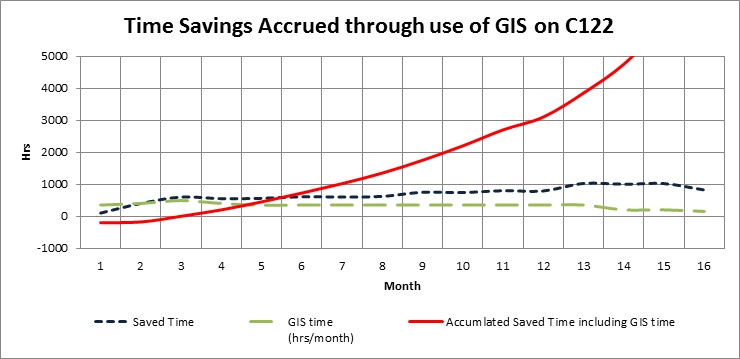
Figure 6 – Example of savings made by Contracts using the lifecycle information management strategy adopted at Crossrail
Lessons Learned
A Geographically Aware CAD System
The decision at the outset of the programme to use a common projected coordinate system in both the CAD and GI systems significantly improved the interoperability and transparency between these systems. Data from one system did not need to be geographically transformed or manipulated in order to be made available in the other, leading to a significant saving in the time required to make it accessible to users.
Master Data Model Interoperability
The presence of a master data model made it far easier to share and interpret information between different systems. It also allowed the existence of a federated data model to be acceptable, ensuring that relevant business systems could host their own data whilst permitting that the same data can be related to other systems across the programme.
Re-use of Data
Storing and making geospatial data accessible to all those on the programme through a central intranet map portal enabled users to discover and use data from a variety of sources that would otherwise have taken significant amounts of time to source. The time taken by Asset Protection Engineers to construct reports is 80% less than it would otherwise be because of the centralisation and accessibility of the correct information, using the data and tools provided by the SDI.
Disadvantages of Federated Systems
Federated systems, whilst allowing for the flexibility across multiple data sources with each attuned to the specific business requirements of that data, and still allowing relationships to be defined across multiple systems, only bestow a weak relationship between them. Because of this there is no strict enforcement of referential integrity possible between any two such systems directly, specifically due to the nature of this configuration.
This resulted in issues when data was changed in one system and the changes were not reflected in another, leading to conflicting data. Custom built workflows were needed to ensure the integrity of the data and this in turn led to additional overhead in the management of the individual and collective data sources. However these overheads were significantly outweighed by the benefits that the approach brought.
Interoperability Issues
It was well known by the programme team that GIS did not offer a significant level of support for 3D geospatial data and yet one of the core outputs from CAD and BIM sources would be 3D models representing all of the assets that would form the operational railway. Methodologies to extract 2D counterparts of their 3D source were possible, but would reduce the complexity and accuracy of the information, particularly in stations where assets may span multiple levels. Additional workflows were therefore required to enable support for reading 3D geometries, making use of interchange formats such as Industry Foundation Class (IFC) and Drawing eXchange Format (DXF).
Recommendations for Future Projects
A number of lessons learned from the approach pursued by Crossrail could be applied to future projects:
- Closer integration of location to the programme delivery. The lack of geographic representation for some information has impacted on the decision making process and has led to some replication within data sources. Defining location from the beginning of the project would eliminate this duplication and avoid unnecessary re-working later in the project.
- Earlier adoption and stronger enforcement of a Master Data Model. Incorporating location as one of the key elements from the planning phase of the project onwards would provide spatial relationships to act as an additional set of intrinsic relationships within the project.
- Stronger adoption of Enterprise GIS encompassing mobile, 3D and service oriented architecture. At the outset of the project, technology such as mobile apps and 3D GIS were not readily available, but their emergence allowed for easier access by all users to a centralised data source. Adoption of these tools and architectures would allow data to be shared, whilst retaining overall governance of the data at source.
Conclusion
The scope and variety of geospatial content required for an infrastructure construction project or programme such as Crossrail is immense. Management of that content is critical to the smooth and safe delivery of the project or programme. Without the implementation of an SDI, geospatial information could easily have become lost, out of date and unusable. The adoption of common standards and procedures, both from within industry and amongst information owners within the programme, has been vital to the consistency of information both in terms of content and application.
On Crossrail the ability to re-use data, processes and workflows led to a substantial saving in cost and time for the programme, and some of these outputs were supplied to the Infrastructure Managers to further provide savings.
References
[1] Cabinet Office (2011). Government Construction Strategy. Cabinet Office
[2] Ordnance Survey (2015). A guide to coordinate systems in Great Britain. Ordnance Survey.
[3] Harris, Ian (2009). CRL1-XRL-O6-STD-CR001-00019: London Survey Grid Standard. Unpublished
[4] Taylor, Malcolm (2013). CRL1-XRL-O6-STD-CR001-00014: CAD Standard. Unpublished.
[5] Herring, John R. (2011). OpenGIS® Implementation Standard for Geographic information – Simple feature access – Part 1: Common architecture. Open Geospatial Consortium, Inc.
[6] Walker, R. S. (2010). UK GEMINI: Specification for discovery metadata for geospatial data resources. Association for Geographic Information.
[7] BS 1192-2007 (2007). BS1192: Collaborative Production or architectural, engineering and construction information – Code of Practice. British Standards Institute.
-
Authors

Daniel Irwin - Crossrail Ltd
Daniel Irwin is the Geospatial Lead for Crossrail. With over 15 years of geospatial experience he has worked in sectors ranging from environmental, utilities, transport modelling and construction through to asset and facilities management. At Crossrail Daniel is leading the development of geospatial solutions to integrate and support the BIM principles that underpin the project for the entire lifecycle of a world class railway.

Nart Tamash MSc - Crossrail Ltd
Nart Tamash is Assistant Geographic Information System Manager at Crossrail. He is primarily responsible for the administration of the GIS software platform, development and maintenance of various web mapping applications, as well as engagement with a number of internal and external stakeholders. Nart joined Crossrail in 2012, shortly after he achieved his master’s degree, part of which he spent working as a GIS intern at University College London on a research project.