The Use of Shape Accel Array for Monitoring Utilities during Urban Tunnel Drives
Document
type: Technical Paper
Author:
Brendan Bradley MEng (Hons), Roberto Prado Garcia, ICE Publishing
Publication
Date: 03/11/2014
-
Abstract
The protection of third party assets with reliable monitoring instruments is essential for the running of a successful urban tunnelling project. With a twin bore tunnel being excavated below the Ranelagh Sewer, in Paddington for the Western Tunnel drive of Crossrail, a reliable method was required to measure displacements (convergence) in near real time. The design of the system required careful planning and an installation method that would be safe and comply with the stringent requirements of the asset owner.
The introduction of Shape Accel Arrays (SAA) for the measurement of convergence within large sewers is a new concept in the UK construction industry. The instrument is successfully being used for the monitoring of slopes, embankments and diaphragm walls. SAA are very quick to install and base read, with the data output configurable for various types of monitoring software.
This paper documents the use of Shape Accel Arrays within the Ranelagh Sewer. It will describe the method of installation, the results obtained and lessons learnt during the first large tunnel drive directly below the shape accel arrays.
-
Read the full document
INTRODUCTION
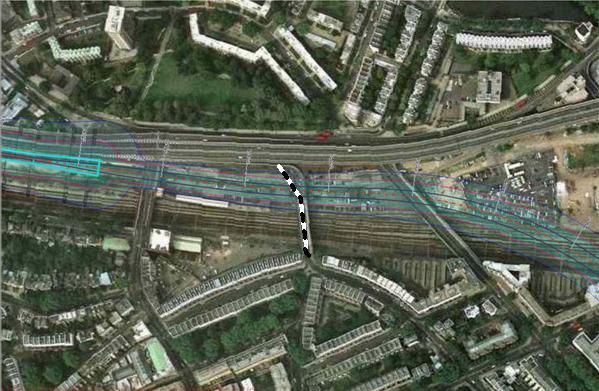
Third party asset protection is an area of critical importance to the success of Crossrail as a project. For this reason, a vast amount of monitoring systems are being employed across London to ensure that potential ground movements caused by Crossrail works are understood and monitored so that appropriate actions can be taken should unexpected movements occur. This paper will focus on the monitoring of the Ranelagh Sewer, a Victorian brick sewer located approximately 230 m east of the Royal Oak Portal – the launch site for the C300 Western Running Tunnels.
Figure 1 – Location plan of the Ranelagh Sewer with respect to the Royal Oak Portal
The Drive X Western Running Tunnels have been launched in sequence from the Royal Oak Portal (west of Paddington Station) and are boring eastward toward Farringdon Station, passing by Paddington, Bond Street and Tottenham Court Road Stations on the way. The tunnels are being excavated by a Tunnel Boring Machine (TBM) using Earth Pressure Balance Mode (EPB) as a control mechanism to reduce potential ground surface movements. Each tunnel has an excavated diameter of 7.1 m, although the concrete lining of the tunnel will only have an external diameter of 6.8 m. Although EPB method of tunnelling is designed to reduce ground movements as much as possible, movement is still expected and hence provisions must be made for third party assets that may be affected by this movement.
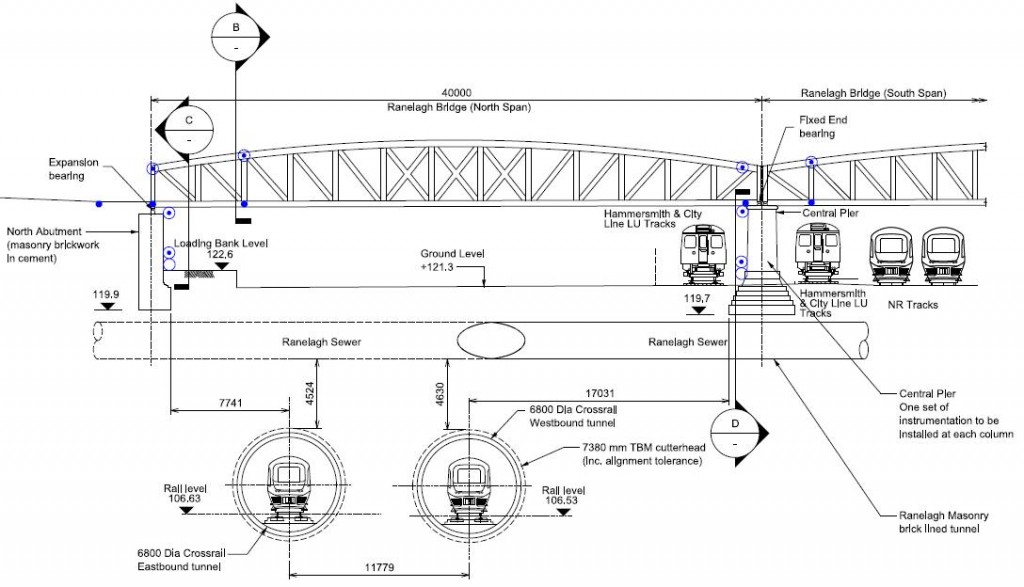
One of the first major obstacles identified by Crossrail’s designers for the Drive X tunnel construction was Ranelagh Sewer. Ranelagh sewer is situated over the centre line of the proposed tunnel drive with a clearance of 4.6m from the invert of the sewer and the top of the TBM. The condition of the sewer was also a larger risk, which led to initial proposals to install a protective liner within the sewer to prevent collapse. However, as the expected damage was considered minimal by the designers, it was agreed that near real-time monitoring instrumentation should be installed to allow precise monitoring of the sewer during TBM passage.
Detailed discussions with Thames Water highlighted restrictions and long term safety concerns that would have led to the standard method of monitoring convergence and settlement using 3D geodetic methods being an unacceptable risk, Thames water also required any system that would be installed semi-permanently would have to cause minimal ragging and provide no restriction to flow.
The Shape Accel Array (SAA) was eventually proposed as it would satisfy all needs and restrictions but providing near real-time precise convergence and settlement monitoring of the sewer as well as minimise sewer man entry and obstruction to flow. This was the first time such an instrument was to be installed in a Sewer in the UK.
ASSET DESCRIPTION
The Ranelagh sewer is a Victorian brick tunnel. The sewer runs from the north-west to south-east and approaches the proposed Crossrail works from the North West. Above the east bound tunnel, it turns approximately 300 before exiting the interface area in a southerly direction. It is an egg shaped sewer with an approximate height of 2450mm and width of 2300mm. Local sewers serving the area are predominately large egg shaped sewers of varying sizes, with some smaller local sewers connecting into the main system. Although the existing ground levels slightly vary, the invert of the sewer is approximately 5m below the existing ground surface.
Figure 2 – Section of Crossrail Running Tunnels showing the Ranalagh Sewer and Bridge in close proximity to the alignment
SHAPE ACCEL ARRAY
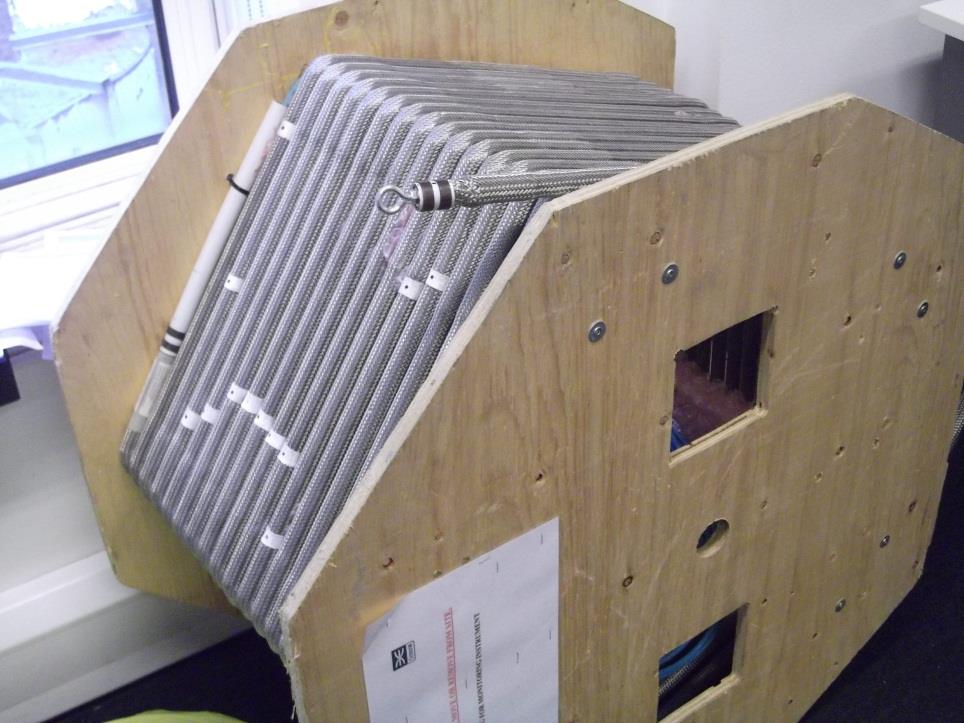
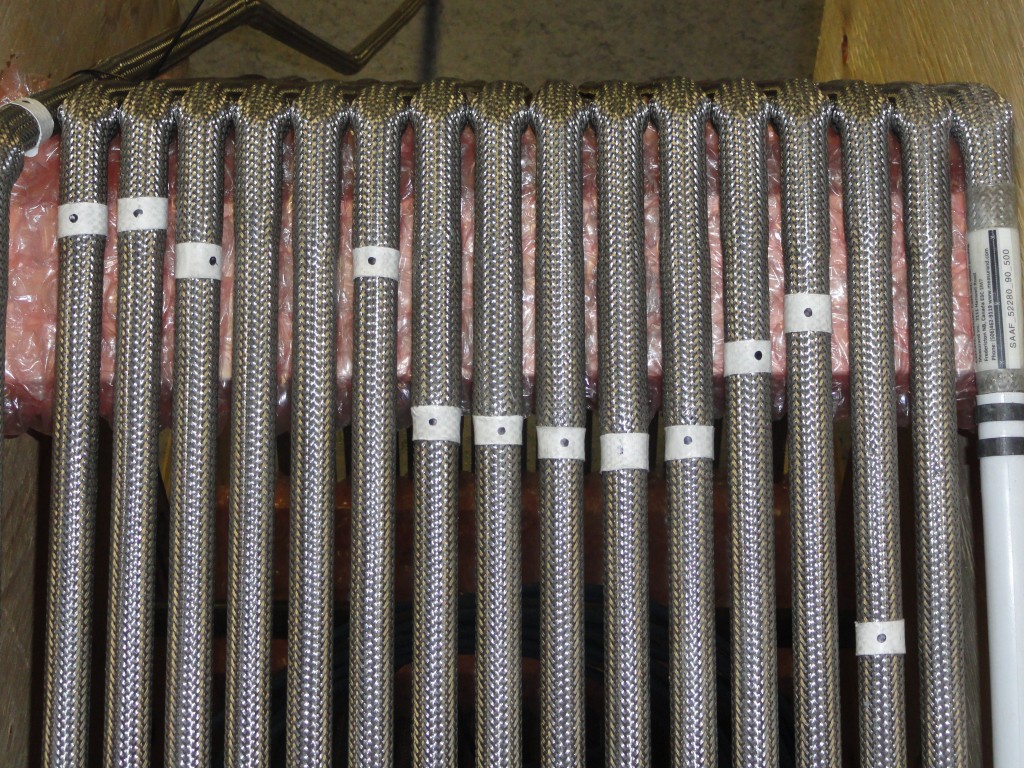
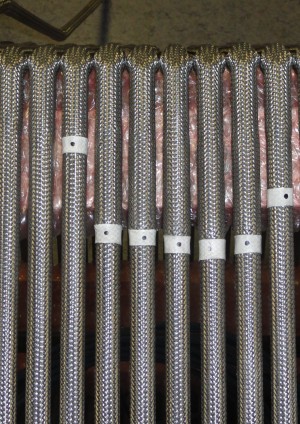
Shape Accel Arrays (SAAs) are manufactured in Canada by Measurand Inc. It is a rope-like array of sensors and microprocessors used to measure deformation or vibration. It is made up of a number of rigid segments either 500mm or 200mm in length (depending on the location to be monitored) and has a diameter of 25mm. Each segment has three MEMS (Micro Electro Mechanical System) accelerometers and the segments are connected by flexible joints that can move in any direction but cannot twist. There is one processor and temperature sensor for every eight segments. The in-array microprocessors collect and send signal data through a single wire output. Typically, the instruments arrive on a reel and can be up to 100m in length.
Figure 3 – Shape Accel Array on a reel delivered to site
The SAAs are installed in 27mm diameter PVC casing and can be installed either vertically or horizontally, or in the case of the Ranelagh Sewer, both. Any deformation that moves the casing is accurately measured as a change in shape of the SAA. They are also re-usable and are able to withstand huge deformations.
The specifications of the instrument are:
• Resolution: 2 arc seconds
• Accuracy: ±0.5mm/32m when the casing is grouted in place
±1.5mm/32m when the casing is not grouted
• Pressure: tested to 100m depth water
• Vibration: can measure ±2GData
Data can be collected from the SAAs either manually by use of a laptop or tablet computer and a SAA-PC Interface Box or in real time wirelessly via a data logger. The data logger can be powered wither by a 12v DC battery or by 110v AC.
Calibration
After production, every sensor in every SAA is calibrated through a range of multiple temperatures and multiple orientations. Calibration constants of offsets, gain g/count, tcoeff cc/degc and temp gain factor are calculated and are programmed into the data logger specific to the SAA. The calibration constants are downloaded with the SAARecorder software for manual readings and programmed into the individual data logger boxes for each SAA. The only calibration procedure required after installation is to zero the SAA’s when installed to produce a zero value for the SAA which will be used to compare all future readings to. As the SAAs are factory calibrated and sealed, they require no field assembly or calibration.
REQUIREMENT FOR MONITORING
In order to determine the expect ground movements on the asset due to tunnelling works, an assessment of ground movement effects on the Ranelagh Sewer was carried out by the Crossrail C122 contract. The purpose of this assessment was to define the predicted ground movements associated with the tunnelling and calculate the expected induced bending and axial strains on the sewer concluding with defining the required mitigation.
The ground movements were assessed based on empirical methods using Mair et al. (1993). The modelling parameters used in the assessment are considered to be moderately conservative and are shown in the table below:
Modelling Parameter Value Volume Loss 1.0% Trough width parameter,k 0.5 The assessment considers ‘greenfield’ conditions, which do not take into account the stiffness of the sewer or adjacent assets, which includes the Ranelagh Bridge and its foundations.
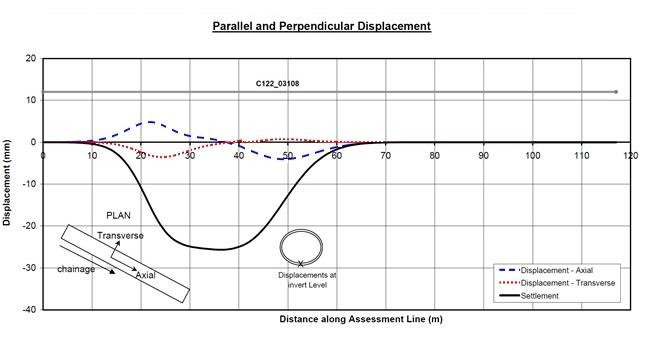
Based on this assessment, the maximum calculated settlement was found to be 26mm along the Sewer and the lateral displacement was predicted to be 4 mm maximum. The maximum longitudinal displacement (along the axis of the sewer) was calculated to be 5 mm. Figure 4 below shows the results of this assessment.
The assessment recommended that a monitoring system should be installed in order to observe the response of the sewer due to ground movements and also to repair resulting damage if it occurred. The report also suggested that a Volume Loss Control Zone be defined in the Contractor’s specifications.
Figure 4 – Results of the C122 (Arup/Atkins) ground movement assessment on the Ranelagh Sewer
As a result of this assessment, the Specification for the Control of Ground Movements for the C300 tunnel drives sets a Volume Loss control Zone of 0.5% in the area of the Ranelagh Sewer. This control zone requires that the contractor increase TBM control in order to further reduce surface ground movements (by increasing face pressures and tail-grout pressures, for example).
BFK ASSESSMENT FOR 0.5% VOLUME LOSS
A further assessment of ground movement was undertaken by the contractor Bam Ferrovial Kier JV in order to determine the expected movements of the Sewer due to the passage of the Westbound TBM only beneath the asset assuming the contractual requirements – a maximum of 0.5% volume loss. The results of this analysis would help understand the contractual limits to which the contractor was to control the works.
With the exception Volume Loss and the trough width parameter (k), the model used assumed the same greenfield parameters as those for the above mentioned assessment by the Client’s designers. An xDisp model was run based on the above parameters and the following plots were produced:
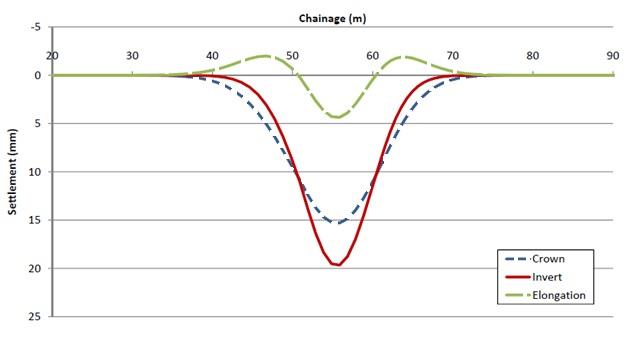
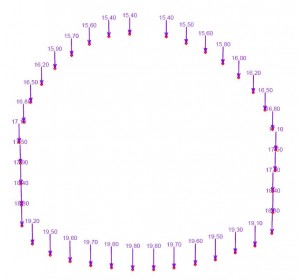
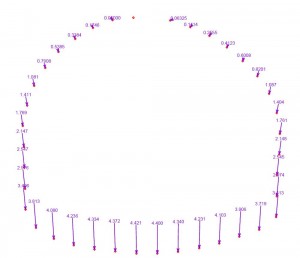
Figure 5 below shows the calculated settlement for both the crown and invert of the Sewer, based on VL = 0.5%. Also given is the calculated longitudinal elongation of the asset. Figures 6 and 7 below show the calculated vectoral movement of the Sewer itself, at a transect directly over the Crossrail Westbound TBM alignment. Figure 6 shows the absolute movement whereas Figure 7 gives the differential movements.
Figure 5 – xDisp results from BFK assessment of ground movements with VL = 0.5%
Figure 6 – Absolute movement of Ranelagh Sewer at section over WB TBM centreline, VL = 0.5%
Figure 7 – Differential movement of Ranelagh Sewer at sectionover WB TBM centreline, VL = 0.5%
The results show maximum settlements of approx. 20 mm and differential settlements between sewer crown and invert of less than 4mm.
Although the assessment shows a reduction in calculated movement, and minimal differential movement, the requirement for monitoring was based on an assessment of 1% volume loss. A real-time automated system was therefore still required to help determine whether or not damage was being caused to the sewer. Furthermore, the accuracy of the SAA, as well as its ability to be installed circumferentially within the sewer would allow a comparison of actual movement and calculated movements (as per Figure 7) to be carried out.
TRIGGER VALUES
No specific trigger values were defined for this asset by either the Designer or Thames Water. However, some Alert values were defined for construction control purposes. A values of 25 mm displacement was defined by the Designers as being an Alert, as was a slope of 1:2000 to be measured in the crown of the Sewer. Furthermore, a slope of 1:5000 was given as an Alert value for the surface movement directly above the Sewer, which was being measured by Precise Levelling Points (PLP).
INSTALLATION
A total of three SAA were installed in the Ranelagh Sewer; 2No 7.4 m long installed in the intrados of the sewer and 1No 43 m length installed horizontally in the crown of the sewer, directly above the two Crossrail Running Tunnel centrelines. Each SAA consists of rigid segments, of lengths that depend on the location in which they are installed.
Due to the internal profile of the sewer, a SAA with shorter segments was used, (200 mm segments). This was to enable the SAA to form the internal profile of the sewer as closely as possible, to obtain the most accurate data in relation to any possible movement within the structure of the sewer. The 200mm segment lengths were manufactured especially for this application.
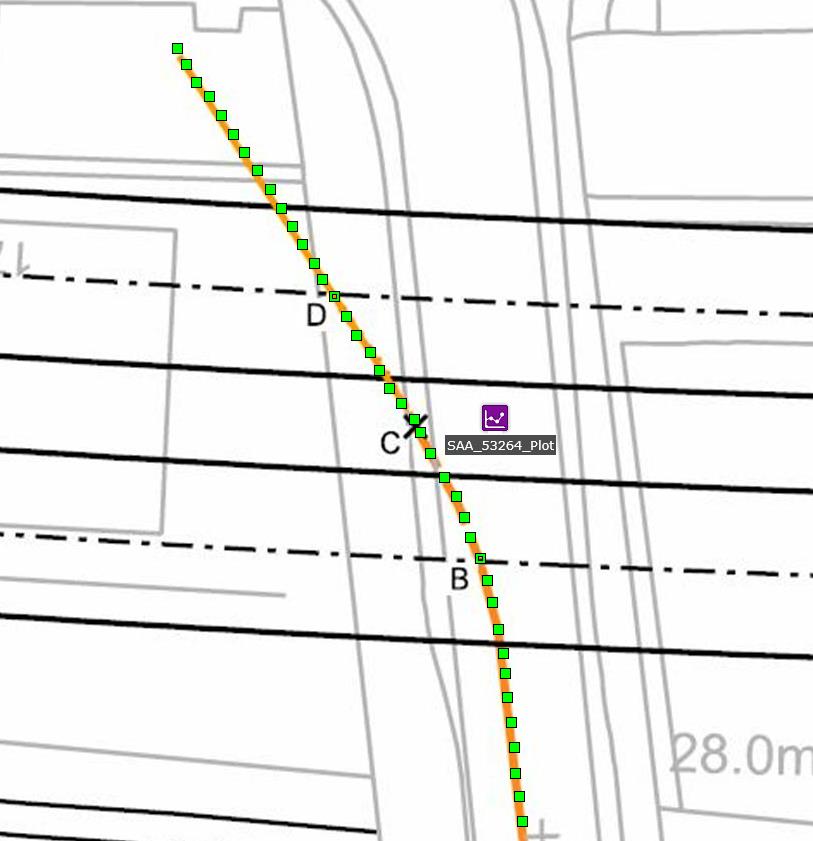
A third SAA of 500mm segments length was installed along the crown of the sewer, again by setting out an equal distance on each side of point C. This is also illustrated in Figure 8, whereby each green square represents a sensor location in the 43 m long horizontal. A data logger was also installed, to allow the data from the SAAs to transmit to an on line monitoring system.
The SAAs in locations B and D (see Figure 8) were installed directly over the centrelines of the Westbound and Eastbound Crossrail tunnels respectively. The installation team was advised on the required locations prior to the installations and these were subsequently set out measuring from point C which is the centre point between the two tunnel drives.
Figure 8 – SAA Locations
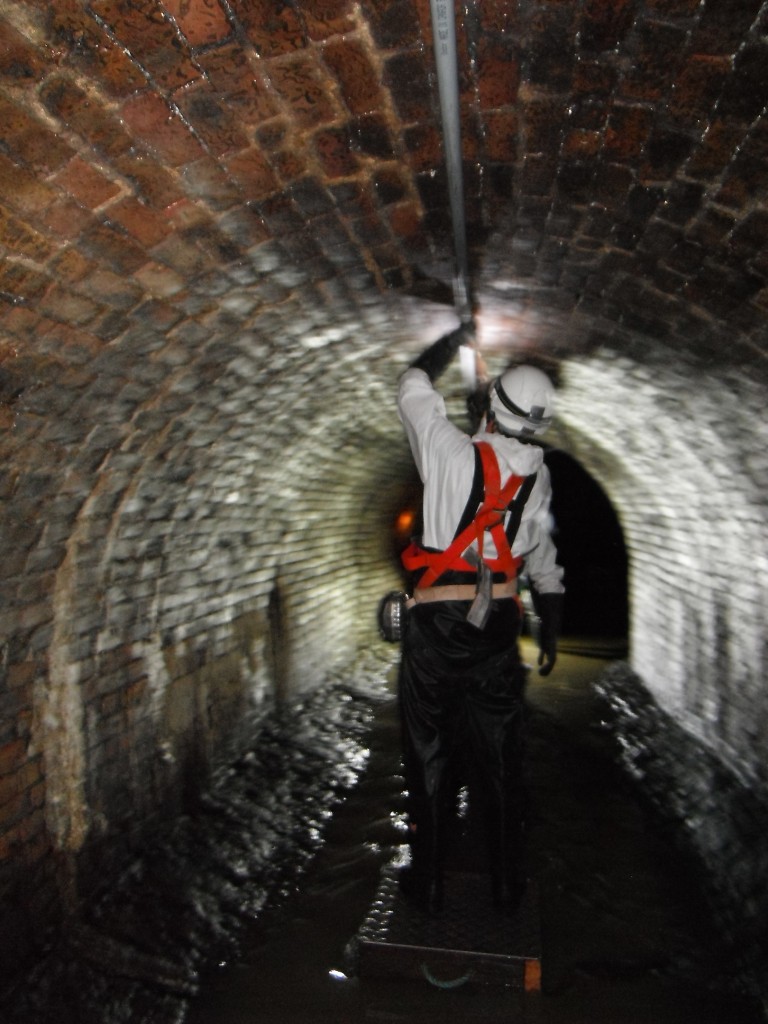
Figure 9 – SAA fixed to crown of Sewer. Image Credit: Gary Evans
The installation of the SAA on the crown of the sewer was carried out in the following manner.
Once the location of the SAA was set out and marked, holes were drilled in the sewer lining. This was achieved by using a PAT tested battery powered drill. The next stage was to install the 27mm (internal diameter), (1” trade size), electrical conduit, to the crown of the sewer, which will be referred to as casing, in this document. This casing was supplied in 3m lengths and was joined in the sewer using the flared couplers at each end, which were glued together. The casing was fixed along the crown of the sewer at intervals between 0.5m and 1m, using marine grade stainless steel P – clips.
The SAA was then pulled through the casing, while ensuring that the X axis on the instrument was always facing in the direction in which the expected movement was likely to occur.
Figure 10 – Black dots indicating x-axis of the instrument
The installation of the SAAs around the inner lining of the sewer was carried out as follows:
Upon establishing the locations where the SAAs were to be installed within the sewer – these being locations B and D in Figure 8 – holes were drilled in the same manner as in the previous SAA installation.
The principal difference for the installation of the circumferential SAA was that the instruments were supplied in a special reinforced clear plastic tubing, from the manufacturer. This was to ensure that the SAA was protected once installed, as it was not possible to use the rigid casing in this situation due to the circular shape of the sewer. The SAA was put in place and fixed directly to the sewer lining as previous.
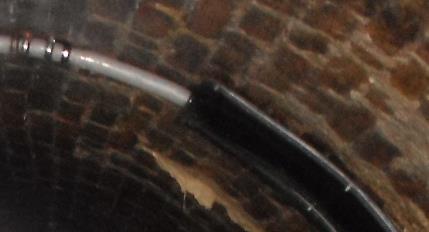
Upon completing the fixing of the instruments around the inner lining of the sewer, a further layer of 3mm thick butyl rubber sheeting was placed over the flexible casing of the instrument as shown in Figure 11.
Figure 11 – 3 mm thick butyl rubber sheeting fixed over SAA Image Credit: Gary Evans
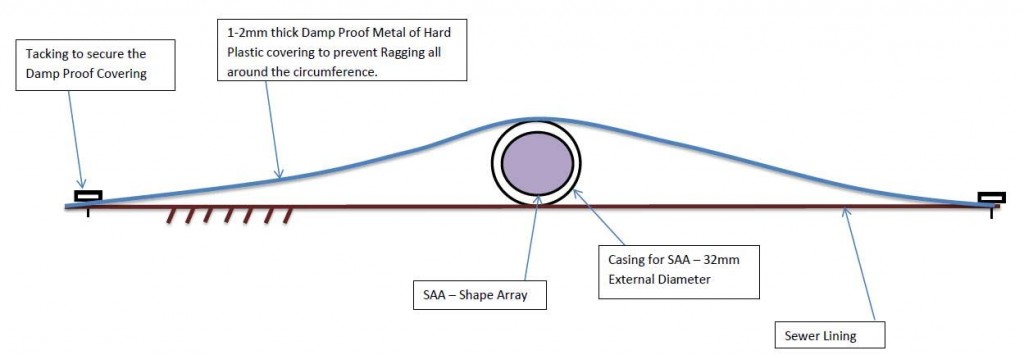
The purpose of the rubber sheeting was primarily to mitigate against the possibility of build-up of debris behind the instrument time, as well as ensure Thames Water requirements to avoid any restriction to flow would be met (see Figure 12).
Figure 12 – Cross section view of butyl rubber sheeting fixed over SAA
Upon completion of the installation of the three SAAs in the sewer, the data cable was extended from each SAA and fixed along the inside of the sewer as far as the entrance to the sewer. The data cables were brought up vertically inside the manhole chamber and exited the chamber beside the manhole cover onto a secure area. The baseline values for the SAA where taken a few weeks after installation, to allow for the instrument to adjust and to observe any background interference that may have occurred due to the location.
MONITORING RESULTS
TBM Control
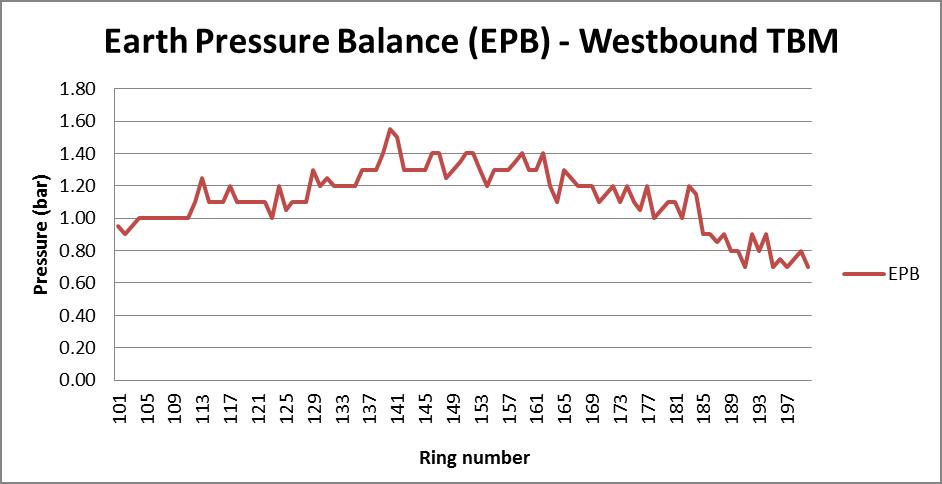
In order to ensure the specified volume loss of 0.5% was achieved in the vicinity of the Ranelagh Sewer, the contractor took the decision to gradually increase its control parameters to help reduce surface settlements. The face pressure (EPB) and the volume of tail grouting injected at ring build were increased slightly and maintained at higher rates while the TBM passed beneath the Sewer.
The zone of influence of the sewer was defined from ring number 144 and the pressure was maintained until ring 162 (a distance of approx. 30 m) when a gradual decrease was implemented once the sewer was no longer within the TBM Zone of Influence. This increase and decrease of the EPB can be seen in Figure 13.
Figure 13 – Earth Pressure Balance (EPB) – Westbound TBM
SAA Monitoring
Monitoring of the Sewer was carried out continuously during passage of the TBM, with two-hourly updates being sent to the TBM control team as well as the contractor’s engineering team. In addition, the monitoring results would be reviewed twice daily (once a shift) by the Shift Review Group – a committee comprising of representatives from the contractor, designer and client.
SAA in the Crown
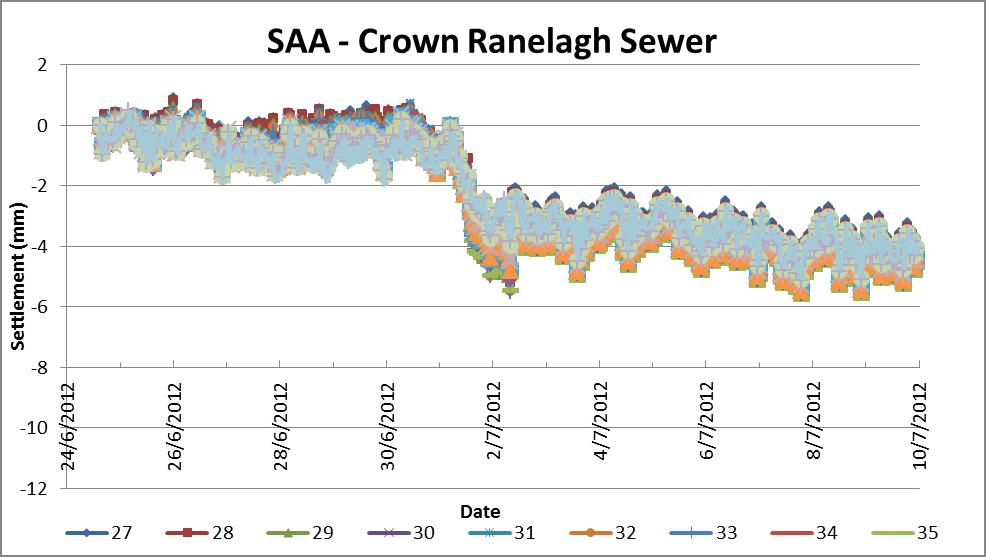
The data from the SAA located in the crown of the Sewer provided particularly useful data with respect to the rate of settlement during the TBM drive. Figure 14 below shows the vertical movement of selected sensor points over a period of two weeks including the time of TBM passage. The accuracy and consistency of the readings is such that the movements can be related back to precise tunnelling activities, giving a clearer understanding of how TBM operations cause ground movement. The data shown in Figure 14 shows three main ‘movement’s’: a first initial settlement (30/06/2012) followed by a more sustained and steeper settlement (01/07/2012) before a final slight heave (02/07/2012). These movements correspond to settlement caused by the cutter head, followed by settlement over the shield and at ring build location and finally the heave caused by pressurised grouting behind the finished ring.
Figure 14 – Time plot of settlement recorded on the SAA installed on the sewer’s crown.
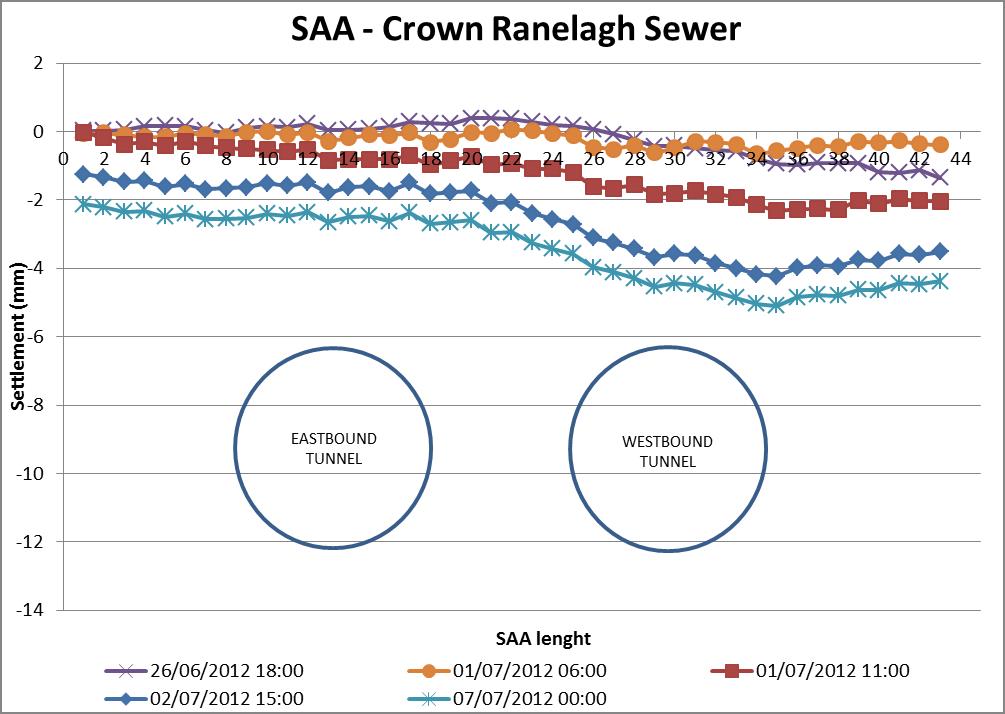
Figure 15 shows a profile of the whole SAA giving the settlement at different times, allowing the progression of settlement of the length of the sewer to be studied
Figure 15 – Profile of settlement recorded on the SAA installed on the sewer’s crown.
SAA in the Sewer Intrados
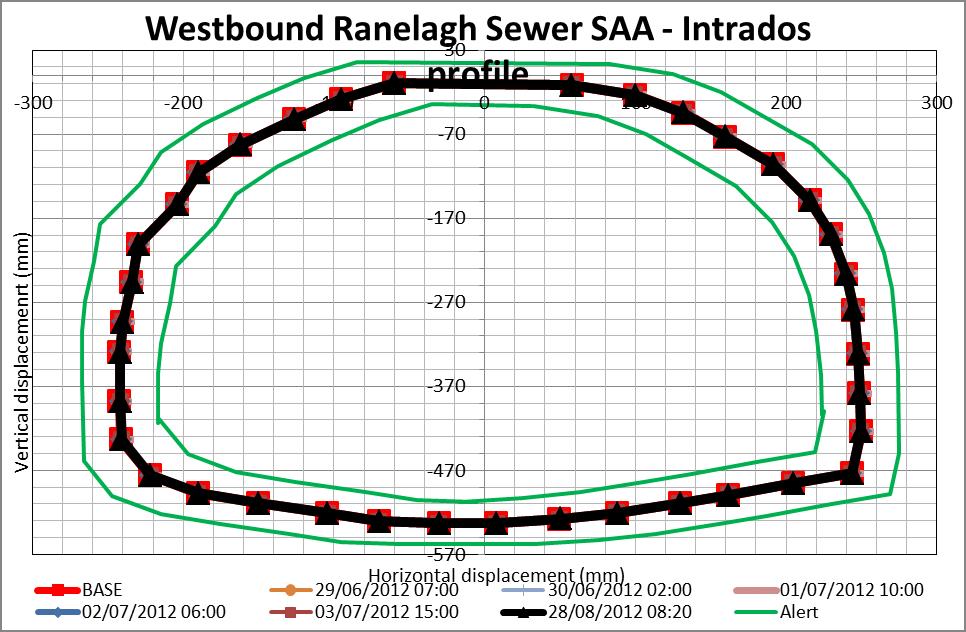
The expected relative (or differential) movements of the intrados of the Sewer were calculated to be minimal. The data presented below in Figure 16 shows clearly that little or no relative movement was observed in the circumferential SAA. The scale of the graph, which was chosen to help show graphically not only the whole Sewer shape, but also to 25mm Alert value (represented as the green line). This method of reporting was used during construction as a means of determining any potential trends of movement towards the Alert value.
Figure 16 – Intrados profile – Westbound SAA at Ranelagh sewer
One important aspect of the monitoring of the intrados is that only relative movement could be observed. As the reference cell of the SAA shown in Figure 16 was in fact in the crown and not located externally, it too was subject to movement. Absolute movement can therefore be obtained by adding the observed movement in the crown of the Sewer (given by the crown SAA) to the relative movement of the intrados SAA.
CONCLUSION
The use of SAA as a method of providing near real-time internal monitoring of large diameter sewers has proved extremely successful. This form of automated monitoring provided a suitable solution to overcome the limitations of monitoring inside a hazardous confined space.
The information received from the SAA not only provided and insights into utility movement, but also the effect of TBM parameter adjustments in lower cover situations. The use of the SAA data and the ease and success of the installation has led to further assessment of services along the route of the TBM drive. It is hoped that the data will be back analysed by asset protection designers and the utility companies to allow more informed decisions on future installations and alarm limit parameters. Moreover, detailed and precise monitoring of utility movement will enhance considerably the understanding of how similar assets react to tunnel induced movement. Such monitoring data can therefore help design engineers produce more efficient designs based on realistic empirical data,
Acknowledgements
The authors would like to acknowledge the support of the following companies and persons while conducting the fieldwork and preparing the manuscript: Crossrail, Thames Water, Bam Ferrovial Keir JV, Keller Getec ITMsoil JV and Geo Observations. Particular acknowledgment should be made to Gary Evans, who prepared documentation and methods to ensure compliance, and David Harris, John Roseler and Paul Thurlow for their technical help and guidance.
REFERENCES
Mair R J, Taylor R N and Bracegirdle A (1993) Subsurface settlement profiles above tunnels in clays, Geotechnique, Vol. 43 No. 2, pp 315-320
Ridley A., Kavanagh J., Lardi M., Saffari N., ‘Results from a Trail of a New Displacement Monitoring Tool (Shape Accel Array)’C122 Assessment of ground movement effects on the Ranelagh Sewer, C122-OVE-C2-RAN-CRG01-00061 Rev 1.0
C300 Installation Report for the Installation of Shape Accel Array (SAA) in Ranelagh Sewer C300-BFK-C2-RGN-CRT00_ST005-50001 Rev 1.0 -
Authors
-
Acknowledgements
Gary Evans, Document preparation and compliance methods
David Harris, Technical Assistance
John Roseler, Technical Assistance
Paul Thurlow, Technical Assistance
Thames Water
Bam Ferrovial Kier
Keller Getec ITMsoil
Geo Observations
