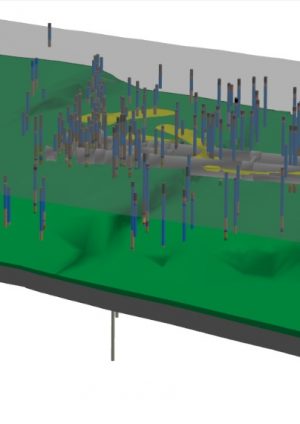
3D geological model of the completed Farringdon underground railway station
Document
type: Technical Paper
Author:
Angelos Gakis Dr. Dipl-Ing, MSc DIC, CEng MICE, Paula Cabrero BSc, MSc, David Entwisle BSc Hons, CGeol, FGS, Holger Kessler MSc, FGS, ICE Publishing
Publication
Date: 31/08/2016
-
Read the full document
Notation
BFK BAM Ferrovial Kier Joint Venture, the main contractor
BGS British Geological Survey
CAD Computer Aided Design
DSP Dr. Sauer & Partners, BFK’s specialist SCL designer
DTM Digital Terrain Model
GIS Geographical Information System
GVS Generalised Vertical Section
NGM National Geological Model
NERC Natural Environment Research Council (UK)
SCL sprayed concrete lining
TBM tunnel boring machineIntroduction
After the reception of four tunnel boring machines (TBMs), the enlargement of two 300m long platform tunnels from the existing segmental tunnels and the construction of 8 cross passages, 2 ventilation adits, 4 stub tunnels and 2 escalator tunnels with their lower chambers, the tunnel excavation works in Farringdon station were completed in Autumn 2015 (see Figure 1).
These tunnels were constructed using sprayed concrete lining (SCL) techniques. This open excavation method, uniquely, allows large scale observations of the exposed tunnel face, subsequently enabling the identification of geological features that cannot be identified in borehole records.
As the station was expected to encounter some of the most challenging ground conditions in the whole of Crossrail, a 3D geological model [1], [3] was developed by the British Geological Survey (BGS) during the pre-construction phase. This model was handed over to the contractor, a BAM, Ferrovial and Kier Joint Venture (BFK), in order for their specialised tunnelling consultant, Dr. Sauer & Partners (DSP), to utilise it as appropriate and to continue updating it with tunnel excavation data.
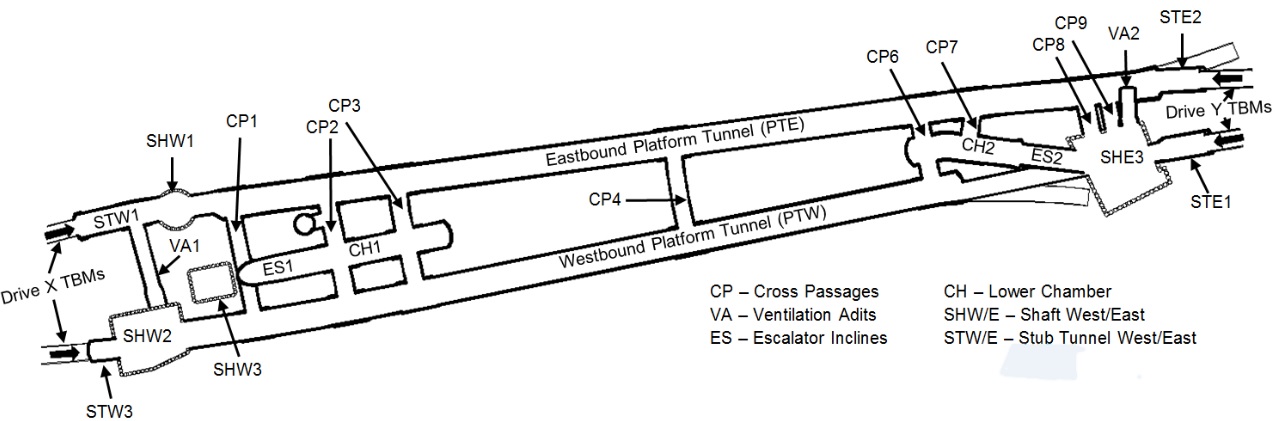
Figure 1 – Plan view of the main structures of the completed Farringdon station. Original 3D geological model
The depth of the planned Crossrail Farringdon Station tunnels was constrained in part by existing underground infrastructure. The design placed the tunnels mostly within the Lambeth Group, which underlies the London Clay Formation, the preferred tunnelling medium in London. The Lambeth Group is known to be a challenging tunnelling medium because of its lateral and vertical lithological variation, including ‘hard grounds’, water-bearing channel sands at a number of levels and local gravel beds [1], [6], [7], [16] . A number of tunnelling projects in the Lambeth Group within London have experienced difficulties and delays because of its variable character [10], [15].
Geological correlation of borehole logs at an early stage of the intrusive investigation indicated not only the expected complex lithological succession in the Lambeth Group but that this was further complicated by faulting [3]. The interpretation of 30 high quality boreholes and third party boreholes in the area did not establish a sufficiently detailed, coherent ground model as the number, type and orientation of the faults still remained uncertain.
The concerns about the ground conditions included the presence of water-bearing sand layers, which varied in distribution and thickness apparently ‘randomly’, and the inferred fault zones, then identified as zones of ‘disturbed ground’ of unknown width and character. The lack of confidence in the ground model had the potential to lead to very conservative designs and construction methods, increasing cost and possible delays in the expected completion date. Moreover, it was recognised that the project ground model needed more development including additional intrusive investigation. However, efficient design of further investigation, within the site constraints, would have to be based on a ground model in which there was little confidence.
This recognition led to the decision that a 3D geological model of the station was required and Crossrail commissioned the BGS to produce it [2], [3]. This would then be used to inform the design of further intrusive investigation.
3D modelling
The model was built with an explicit, cross-section based modelling methodology using the GSI3D software. The general workflow and methodology is described in [11] and the project-specific data and modelling assumptions in [2], [3]. Borehole records, geological maps and a Digital Terrain Model (DTM) were used to delineate the subsurface extent of geological units using a series of intersecting cross-sections. Crucially, this is a manual construction process by the geologist, who interprets the borehole records in their 3D context, linking them in their correct relative positions while choosing whether to honour each data point, considering all other available data and most importantly the geologist’s own conceptual understanding of the geological processes and resulting geometries. This method emulates the geologist sketching cross-sections and performing interpretations. As knowledge of the geological structure improves, faults can be added during any stage of the modelling.
After the cross sections are completed the unit distribution of all geological units is defined in plan view. Finally the software interpolates surfaces between all section and map points, honouring the geologist’s interpretation, to produce triangulated surfaces of the tops and bases of each unit in the model stack. Once the 3D geological model has been calculated it can be viewed in 3D, cross-sections can be produced in any direction and synthetic boreholes in any position. Alternatively, the surfaces can be exported as individual objects to integrate with other modelling packages, GIS or CAD systems.
The original BGS Farringdon model
The units to be modelled are usually specific to the requirements of the project and are defined, in their stratigraphical order, in the generalised vertical section (GVS). The general vertical section for the Crossrail Farringdon Street station 3D geological model is in Table 1, with unit descriptions [3]. The model was created for an area 850 m east-west and 500 m north-south, much larger than the footprint of the proposed station, in order to provide adequate control on the azimuthal orientation of any faults that might be encountered.
The model included sheet-like sand bodies, up to 2 m thick in the Laminated Beds, and several short channel-like sand bodies (up to 25 m wide, 3 m deep and 200 m long) in the Upper Mottled Clay. These geometries conformed to what was expected in the respective depositional environments.
The Farringdon model was initially constructed with no faults and with no prior assumptions about the local geological structure. Faults were then introduced where they were justified by the data. Seven faults were modelled, with downthrows ranging from about 1 m to about 12 m (Figure 2). The data available and modelling process allowed the faults to be constrained to within vertical envelopes of less than 20 m wide near the tunnel lines. These faults were not represented on the current geological maps although the Barbican Fault was shown by regional 3D geological models of the London area [7], [8]. The Smithfield Fault had been identified in previous desk studies for Crossrail and two others had been suspected, although their position and orientation were poorly constrained. Most of the fault-blocks displayed a consistent bedding dip of about 2° to the south. Some unexplained anomalies remained and it was likely that there was additional faulting in the north and east of the modelled area but there was insufficient data to confirm this or to locate additional faults with confidence.
The 3D model provided a coherent conceptual ground model of a faulted multi-layered aquifer including the extent of each identifiable geological unit and of at least seven faults[2],[3]. It was used to identify where further intrusive investigation should be targeted, as required by the need to improve the ground model in an efficient manner and with a greater degree of confidence than had been the situation earlier in the project.
![Table 1 - Geological sequence in the Farringdon area with the typical description and thicknesses [3], [16] as they were used in the original BGS model The dashed line is the position of the mid-Lambeth Hiatus [16].](https://learninglegacy.crossrail.co.uk/wp-content/uploads/2016/11/7E-016-Table-1.jpg)
Table 1 – Geological sequence in the Farringdon area with the typical description and thicknesses [3], [16] as they were used in the original BGS model The dashed line is the position of the mid-Lambeth Hiatus [16]. ![Figure 2 - Fault envelopes in the BGS model [3].](https://learninglegacy.crossrail.co.uk/wp-content/uploads/2016/11/7E-016-Figure-2.jpg)
Figure 2 – Fault envelopes in the BGS model [3]. Development of the 3D geological model with tunnelling data
DSP/BFK received the original BGS model in April 2013. At first the model was updated with data from shaft excavations and some additional boreholes that had become available between 2009 and 2013. In order to provide as much information as possible prior to the commencement of the tunnelling works, BFK/DSP decided to exploit the 33 additional boreholes that would be drilled to house the monitoring instrumentation, by extending them to a minimum 4 m below the tunnel inverts. Figure 3 shows the location of the additional borehole information that was included in the final, 2015 model and Figure 4 shows a perspective view of all the boreholes included in the 2015 model.
Tunnelling works started in May 2013. A face map for every metre-long excavation step was logged. In order to serve the 3D model requirements, the elevations of lithological boundaries and major discontinuities were systematically measured and recorded.
The development of the model utilised the most recent version of the GSI3D (INSIGHT GmbH) software which was also used by the BGS in the 2009 model. From 2014 onwards, the Sub-surface Viewer (INSIGHT GmbH) was used, which provided essentially the same environment and capabilities as GSI3D. Additionally, the BGS Groundhog Desktop GSIS [9], a tool that facilitates the collation, display, filtering and editing of a range of data relevant to subsurface interpretation and modelling, has been used in the latest stages of the modelling process.
![Figure 3 - Coordinated position of the boreholes used in the original (2009) and the updated (2015) 3D model (revised from [9]).](https://learninglegacy.crossrail.co.uk/wp-content/uploads/2016/11/7E-016-Figure-3.jpg)
Figure 3 – Coordinated position of the boreholes used in the original (2009) and the updated (2015) 3D model (revised from [9]). 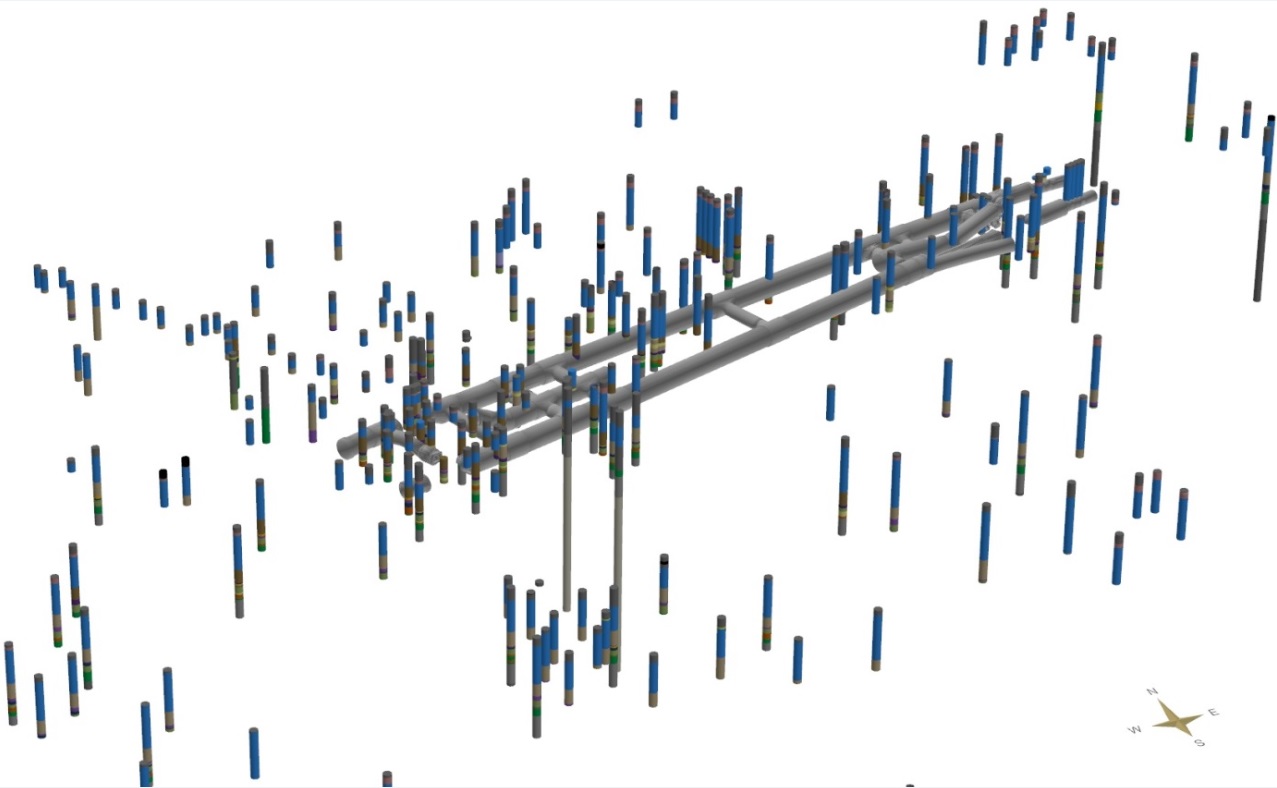
Figure 4 – Perspective view from the 2015 3D model, showing the Farringdon tunnels and all the considered boreholes. Although the main principles and assumptions of the original BGS model were retained, additional modelling rules were adopted for the inclusion of the tunnel excavation data. In detail:
- In the platform tunnels, a complete face map was included for every 10m interval.
- In the shorter tunnels, a minimum of 3 complete face maps were included.
- Where faults or sand lenses were encountered, complete face maps were included for every 1m excavation step.
- Upon the completion of a tunnel, the continuous, geologically-interpreted longitudinal section was included in the model, superseding the imported face maps.
- The inclusion of a section in the model required a subsequent update of all the intersecting sections.
The sections that were included in the updated model based on the tunnel excavation data are shown in the ‘fence’ diagram of Figure 5.
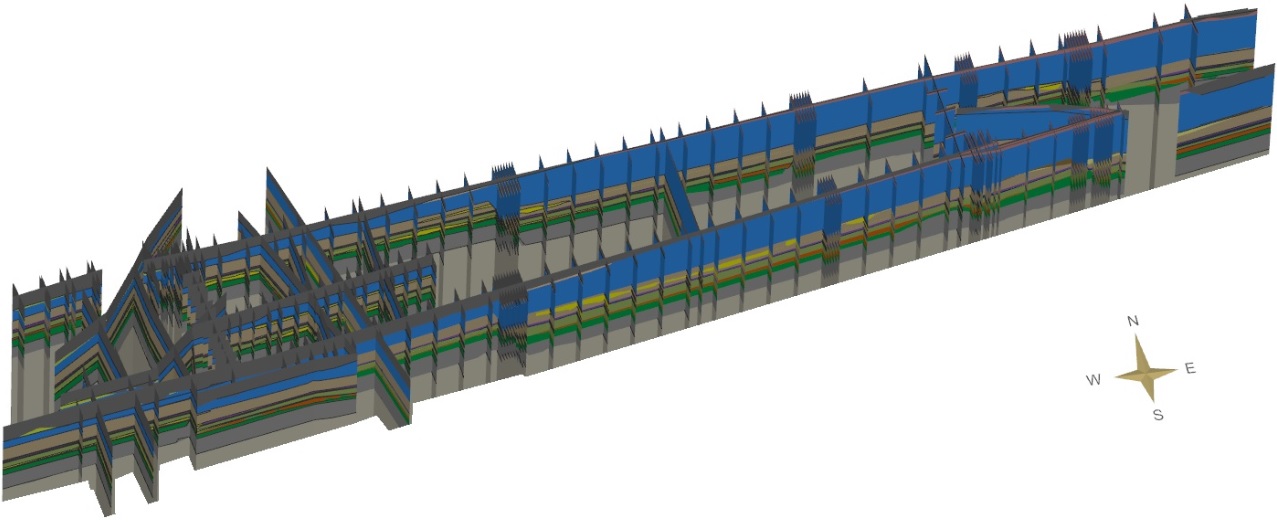
Figure 5 – ‘Fence’ diagram of all the additional sections used in the updated 3D model. Faults
For the simulation of the faults the respective face map data as well as the existing borehole data were interpreted. The orientation of a fault was assessed by connecting at least two points where it was encountered within the footprint of the station. The dip direction and the vertical throw were assessed by correlating the elevation of the discontinuities in successive face maps. All the faults were assumed to be dip-slip faults, as in the original BGS model.
Figure 6 shows the steps of the graphical inclusion of a fault (in this instance the Farringdon Fault) into the model with an average angle of dip of 60o. The Charterhouse Fault was found to comprise smaller faults, possibly accounting for some of the anomalies that remained unexplained in the original model, but for simplicity it was modelled as one fault plane with a total throw equal to the sum of the minor faults. As the revised model focused on the area of the station, no direct information about the Saffron Hill, Turnmill Street and Barbican Faults (Figure 2) was obtained, and they were not modified in the 3D model.
Sand Lenses
The sand lenses were modelled with the highest possible level of accuracy, as these units imposed the highest risk on the SCL works. Two different levels of sand lenses were considered: the higher level included the sand lenses in the upper Clay layer of the Lambeth Group (Upper Mottled Clay) and the lower level, the sand lenses in the lower Clay layer (Lower Mottled Clay). Sand lenses within other Clay units of the Lambeth Group (Laminated Beds) were excluded since within the tunnels they were intermittent and their maximum thickness did not exceed 0.3m. As regards the geometry and the continuity of the sand lenses, two simple assumptions were made:
- The maximum thickness of a sand lens was taken to be equal to the greatest thickness observed in the excavated face.
- If the position of the edge of a sand lens was not observed, in the 3D model the lens was extended up to the mid-distance between the last observation of the sand and the nearest reliable data point without sand.
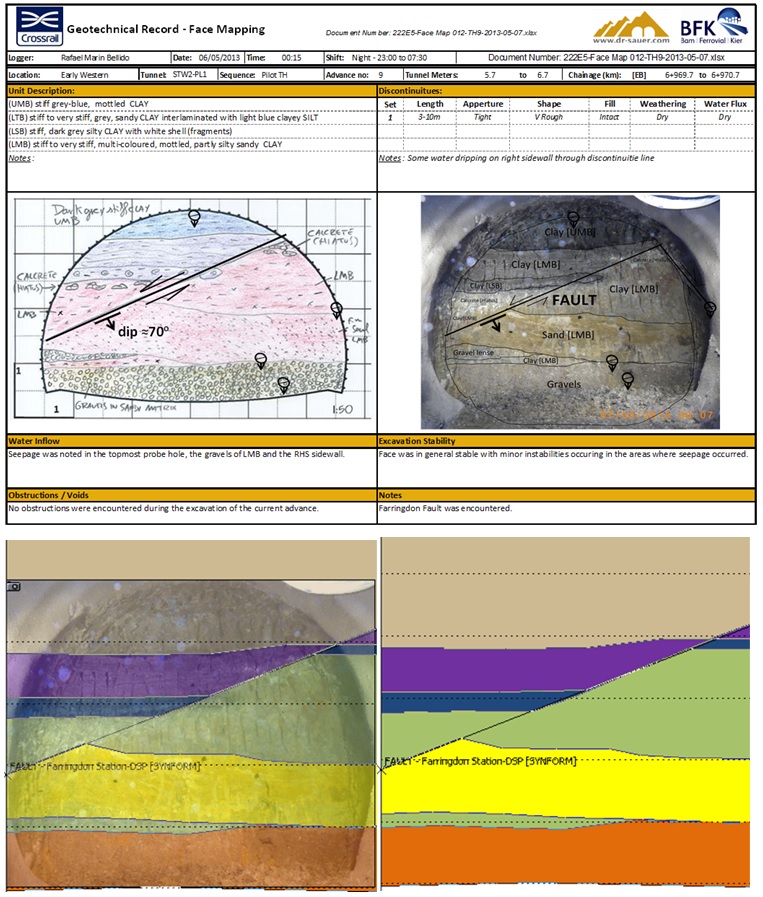
Figure 6 – Steps of the integration of the Farringdon fault into the 3D model. The mapped data from the face (top) are digitised and imported at their respective position into the model (bottom). Geology in Farringdon – Lessons learned
In the course of the tunnel excavations at Farringdon, the geology of the area was described in detail with regards to its lithology and tectonics. The main units encountered during the excavation works, which were subsequently depicted in the 3D model, are described in Table 2, with both lithological characteristics and considerations for SCL tunnelling. The disposition of these units is with a general dip to the south of about 1o – 3o, with localised variations in areas affected by the faults.
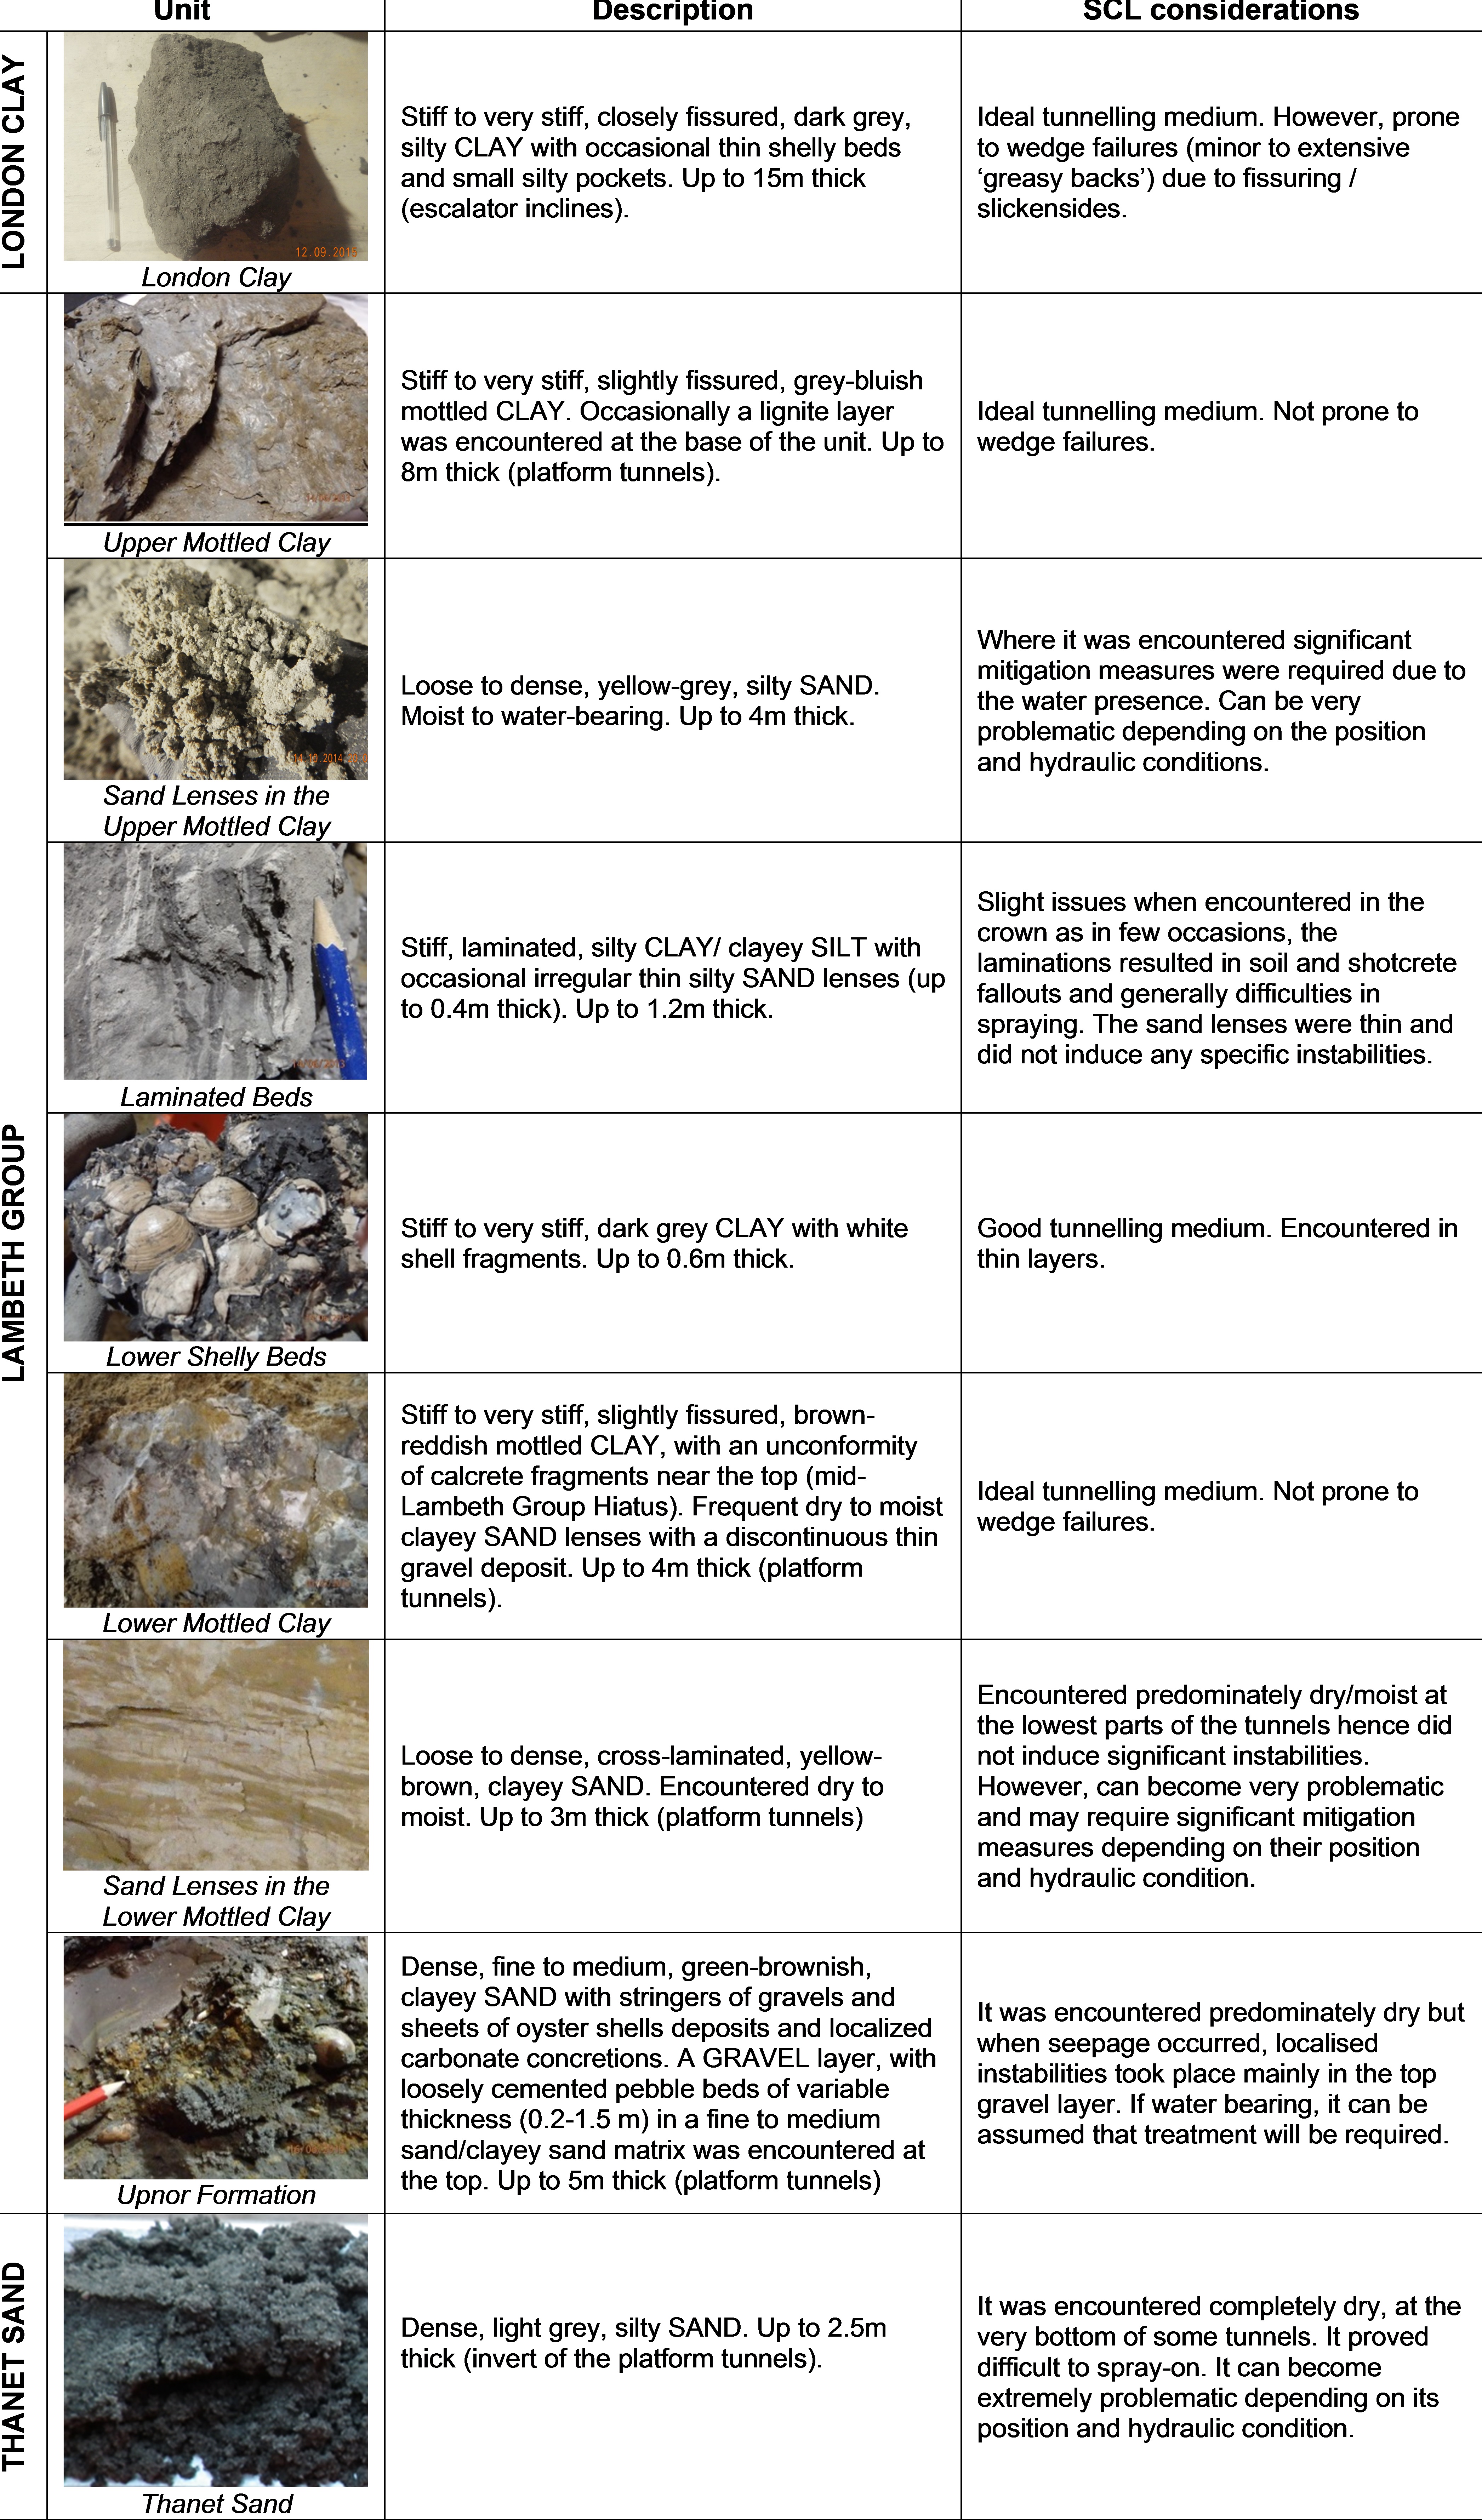
Table 2 – Description and SCL considerations of the geological units as encountered in Farringdon. Faults
In the original model, a horst-like structural block was considered, with four faults expected to intersect the station tunnelling works. In the updated model, the location and characteristics of these faults have been redefined and one additional fault was identified. In detail the following faults were encountered:
- Farringdon Fault: dipping to the west with a throw of 1-2 m in the Farringdon Station area, less than expected in the original model (2-3 m).
- Smithfield Fault: Dipping to the east with a throw of 7 to 9 m, as assumed in the original model.
- John Street Fault: Dipping to the east with a throw of 0.8 to 1.2 m, less than expected in the original model (2 to 4 m).
- Lindsey Street Fault: Additional fault encountered between St. John’s Street Fault and Charterhouse Fault. Dipping to the west with a throw of 0.8 to 1.2 m (very similar to St. John Street Fault).
- Charterhouse Fault: Dipping to the east with a throw of 4 to 5 m, similar to the assumption in the original model (2.5 to 7 m).
When these faults were encountered during the excavation works, there was no visible deterioration in the mechanical soil properties, such as softened regions, and no instabilities at the exposed face. Minor water seepages occurred on the faults in some places.
The updated location of the faults (at platform level) in the original and the updated models is shown in Figure 7. In most cases, the true position of the fault is displaced from its originally modelled position in the direction of dip, consistent with the actual average angle of dip of 60o which was encountered during the tunnelling works, as opposed to the slightly greater assumed angle of dip in the original model (70o).
Sand Lenses
As expected, based on the underdrained piezometric profile of the area (introduced by the historical water abstraction from the deep aquifer), the sand lenses in the Lower Mottled Clay were predominately dry or moist and were encountered in the lowest part of the tunnels without introducing significant difficulties. On the other hand, the sand lenses in the Upper Mottled Clay proved to be quite challenging to tackle. The sand was moist to water-bearing with a maximum measured pore water pressure of 100 kPa (1bar). The maximum thickness of the lenses was 3 to 4 m and they displayed hydraulic continuity. The horizontal extent of the sand lenses in the Upper Mottled Clay in the original and the updated models is shown in Figure 7.
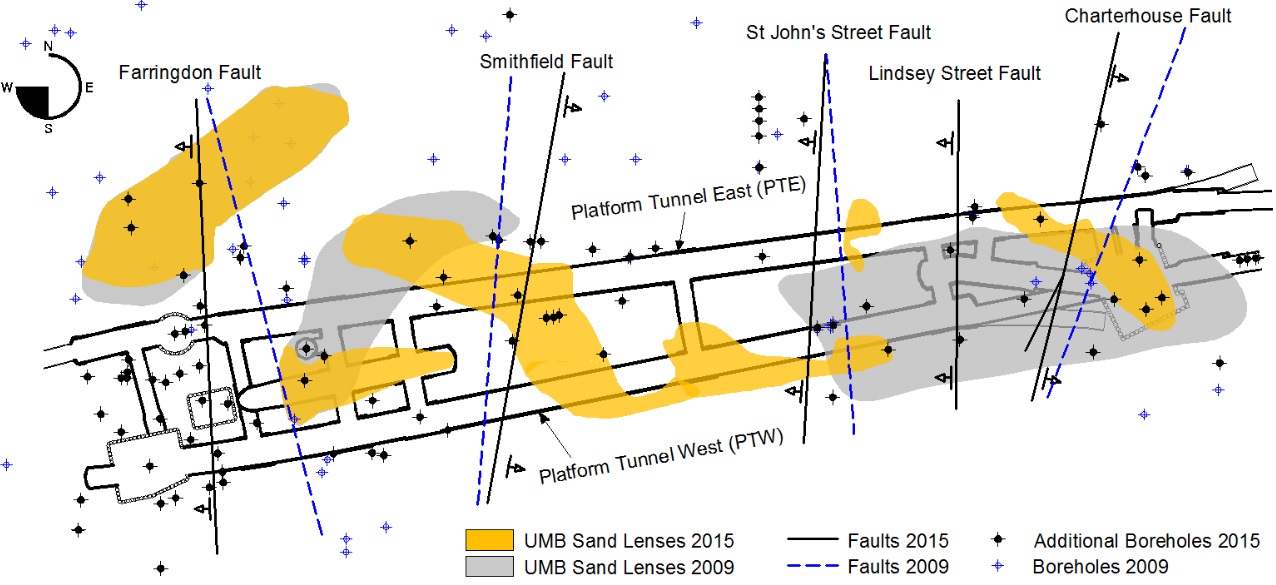
Figure 7 – Plan view of Farringdon Station showing the surface projection of the main faults and the extent of the sand lenses in 2009 and 2015. Main benefits from the use of the model
The main benefits from the use of the 3D model at Farringdon are described in respect of the pre-construction, construction and post-construction stages.
Pre-construction stage
As Farringdon is one of the most complex geologically stations in the whole of Crossrail, the 3D model provided a substantial conceptual ground model. That assisted the identification of areas where additional investigation was required and enabled DSP/BFK to perform an initial geotechnical risk mapping for the tunnelling works [9] as shown in Figure 8. A simple comparison between Figure 7 and Figure 8 reveals that the risk mapping has been very successful even at this early stage. It additionally became evident that the project would benefit from additional intrusive investigation and hence it was decided to extend 33 instrumentation and monitoring boreholes 4m below the tunnel inverts.
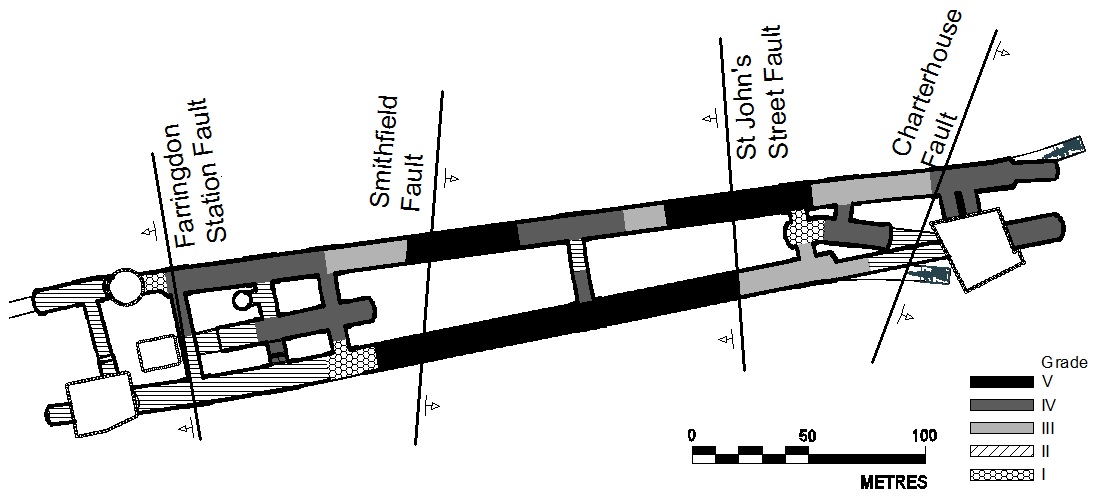
Figure 8 – Geotechnical risk mapping prior to the commencement of the tunnelling works. Construction stage
Being enhanced daily with additional tunnel excavation data, the model exhibited a continuous development and increase in its reliability. In the course of its progress, it was easy to examine existing records and generate virtual boreholes and sections in areas of interest. This was essential support for multiple, additional design changes as parts of the SCL tunnels were redesigned by a DSP design team while construction on other parts of the station had already started. Where the construction environment allowed it, a significant reduction in lining thickness could be achieved supported by the detailed knowledge of the geotechnical conditions.
Due the high geotechnical risks in Farringdon, the model was integrated in the site supervision workflow and became part of the geotechnical risk management framework [9]. The cycle of risk reduction, shown in Figure 9, started with the 3D geological model, which enabled predictions to be made ahead of the excavations. These predictions were validated by in-tunnel probing. At the end of the cycle, the data from the actual excavations were digitised and fed back into the model, increasing its accuracy for the next steps. Through iterative process, the risk was reduced as the level of knowledge and confidence was increased.
A comparison between the predicted conditions prior to the commencement of the excavation of ventilation adit VA1 (see location in Figure 1) and the actual longitudinal section after its completion is presented in Figure 10. It should be noted that the excellent correlation exhibited in this example is attributed to the increased reliability of the model in this area as it was one of the last tunnels to be excavated.
![Figure 9 - Cycle of risk reduction through the implementation of geotechnical risk management tools (reprinted from [9]).](https://learninglegacy.crossrail.co.uk/wp-content/uploads/2016/11/7E-016-Figure-9.jpg)
Figure 9 – Cycle of risk reduction through the implementation of geotechnical risk management tools (reprinted from [9]). 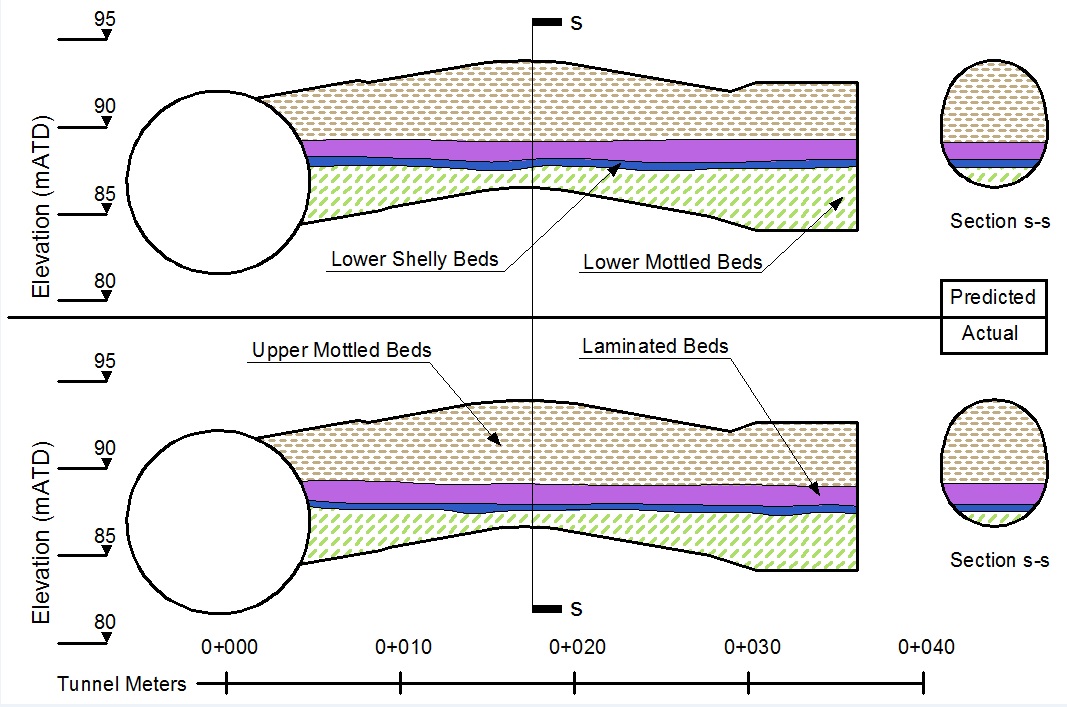
Figure 10 – Comparison between the predicted and the actual geological conditions in ventilation adit VA1. Moreover, the in-depth understanding of the geology of the Lambeth Group as well as the increased confidence in the expected ground conditions during tunnelling, both enhanced with the support of the 3D model, allowed BFK/DSP to reduce significantly the total amount of in-tunnel probing. As a result, the drilled lengths were reduced by approximately 70% (as compared to the Employer’s design) providing significant cost and time savings to the project. Furthermore, during the various encounters of water-bearing sand lenses, the model was used to optimise the direction of additional in-tunnel probing and depressurisation wells in the 3D space.
Post-construction stage
Over the past decade 3D geotechnical/geological models have been used routinely to support groundwater models [18], [17]. However, use of these models in the construction and civil engineering sectors has lagged behind [11]. This situation might be about to change rapidly with the uptake of the concept of Building Information Modelling (BIM) within the geotechnical industry. This development coincides with the phasing out of systematic field mapping [19] and the emergence of the National Geological Model (NGM) concept at the BGS. The NGM aims to build a consistent, multi-scaled, 3D geological model of the UK’s subsurface [14], and it is paramount for the BGS to adapt its system for the ingestion, management and delivery of geoscience data and information, as more geological data and models are generated by external parties [5].
Over the past 5 years, the work at Crossrail Farringdon Station provided a unique, real-world opportunity to test and develop systems and databases able to deal with geological interpretations provided by industry, which were initially based on a BGS geological model. In order for the models and all data to flow back to the national archive for future reuse, it is of vital importance that all data, formats and nomenclatures, such as the BGS Lexicon (http://www.bgs.ac.uk/lexicon/), as well as software systems, are compatible and are shared between project partners. The image below shows the detailed Farringdon model in the foreground nested within the London geological model [13] (mid-ground) and the National Fence Diagram (background) (see Figure 11).
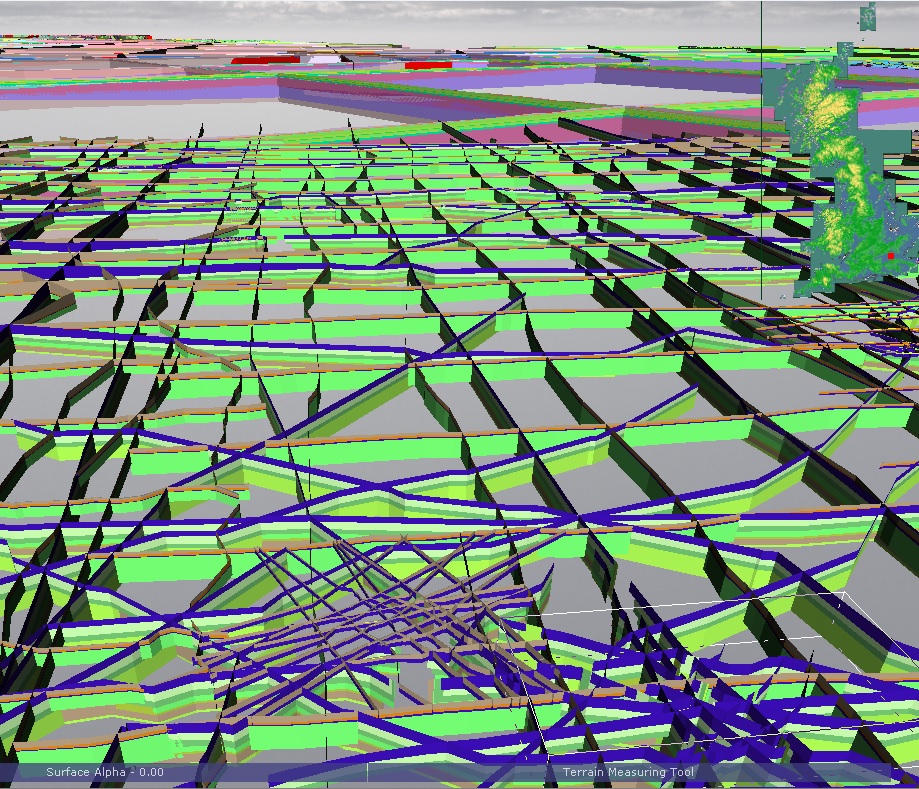
Figure 11 – Farringdon model in the context of the London geological model and, to towards the top, the National Geological Model. Conclusions
The 3D geological model of Farringdon station, originally developed by BGS in 2009 and subsequently by BFK/DSP between 2013 and 2015, provided numerous benefits before, during and after the construction of the tunnels.
- It provided a three dimensional conceptual model of the geology in one of the most geologically complicated stations in Crossrail.
- It assisted the identification of areas where additional investigation was required.
- It assisted BFK/DSP in the production of a geotechnical risk mapping along the station.
- It became a key element of the geotechnical risk management framework as part of the site supervision workflow.
- Being continuously updated with data from the tunnel excavations, it increased its accuracy and reliability with time and was used to examine and assess existing records, to generate synthetic boreholes and sections in areas of interest.
- It enabled geological predictions ahead of the excavations of each tunnel.
- It allowed for more efficient SCL design through enhanced geotechnical knowledge and certainty.
- It supported a 70% reduction of in-tunnel probing from that originally planned.
- It was utilised to direct additional in-tunnel probing and depressurisation wells in the 3D space.
- Finally, as a geological database, the 3D model was used to collate and store all the acquired data from Farringdon. According to BIM principles and the BGS’ National Geological Model concept, the completed 3D model (Figure 12) including all data was handed back to the BGS to incorporate it into their wider London model and to Crossrail to form part of its ‘legacy’.
![Figure 12 - Closing image: 3D Perspective view of the 2015 model showing all the borehole logs, the tunnels, the capping surface, the Upnor Formation and the underlying Thanet sand unit, as well as the discontinuous sand lenses of the Upper Mottled Clay. This image is intended as an updated version of front cover image of [2].](https://learninglegacy.crossrail.co.uk/wp-content/uploads/2016/11/7E-016-Figure-12.jpg)
Figure 12 – Closing image: 3D Perspective view of the 2015 model showing all the borehole logs, the tunnels, the capping surface, the Upnor Formation and the underlying Thanet sand unit, as well as the discontinuous sand lenses of the Upper Mottled Clay. This image is intended as an updated version of front cover image of [2]. References
[1] Aldiss, D.T. (2012). The stratigraphical framework for the Palaeogene successions of the London Basin, UK. British Geological Survey, 87pp. (OR/12/004).
[2] Aldiss, D T, Entwisle, D C, and Terrington, R L. (2009). A 3D geological model for the proposed Farringdon underground railway station, central London. British Geological Survey Commissioned Report, CR/09/014.
[3] Aldiss, D. T., Black, M. G., Entwisle, D. C., Page, D. P., & Terrington, R. L. (2012). Benefits of a 3D geological model for major tunnelling works: an example from Farringdon, east–central London, UK. Quarterly Journal of Engineering Geology and Hydrogeology, 45(4), 405-414.
[4] British Geological Survey (2015). Geology of Britain Viewer. http://mapapps.bgs.ac.uk/geologyofbritain/home.html (accessed 4th September 2015).
[5] Dearden, R.; Kessler, H.; Wood, B. (2013). Mechanics of a 3D geological survey. [Poster] In: Geological Society of America 125th Anniversary Annual Meeting, Colorado, USA, 27-30 Oct 2013. Geological Society of America. http://nora.nerc.ac.uk/503732/.
[6] Ellison, R A, Knox, R W O’B, Jolly, D W & King, C. (1994). A revision of the lithostratigraphical classification of the early Palaeogene strata of the London Basin and East Anglia. Proceedings of the Geologists’ Association, 105, 187-197.
[7] Ellison, R A, Woods, M A, Allen, D J, Forster, A, Pharaoh, T C, and King, C. (2004). Geology of London. Memoir of the British Geological Survey, Sheets 256 (North London), 257 (Romford), 270 (South London) and 271 (Dartford) (England and Wales).
[8] Ford, J., Burke, H., Royse, K., Mathers, S. (2008). The 3D geology of London and the Thames Gateway: a modern approach to geological surveying and its relevance in the urban environment. Cities and their underground environment: 11th European e-conference of International Association for Engineering Geology, September 2008, Madrid, Spain, 15-19. http://nora.nerc.ac.uk/10447/.
[9] Gakis, A., Salak, P., St.John, A. (2015). Innovative Geotechnical Risk Management for SCL tunnels. Proceedings of the ICE Geotechnical Engineering, vol. 168. pp 385-395. Thomas Telford, 2015.
[10] Hight, D W, Ellison, R A & Page, D P. (2004). Engineering in the Lambeth Group. CIRIA C583. CIRIA, London, UK. 210pp. ISBN 0-86017-583-9.
[11] Kessler, H, Mathers, S, and Sobisch, H- (2009). The capture and dissemination of integrated 3D geospatial knowledge at the British Geological Survey using GSI3D software and methodology. Computers & Geosciences, Vol. 35, 1311-1321.
[12] Kessler, H.; Turner, A.K.; Culshaw, M. & K. Royse. 2008. Unlocking the potential of digital 3D geological subsurface models for geotechnical engineers. In: European conference of the International Association for Engineering geology, Madrid, Spain, 15-20 Sept 2008. Asociacion Espanola de Geologia Aplicada a la Ingenieria. http://nora.nerc.ac.uk/3817/.
[13] Mathers, S.J.; Burke, H.F.; Terrington, R.L.; Thorpe, S.; Dearden, R.A.; Williamson, J.P.; Ford, J.R.. (2014). A geological model of London and the Thames Valley, southeast England. Proceedings of the Geologists’ Association, 125 (4). 373-382.1016/j.pgeola.2014.09.001.
[14] Mathers, S.J.; Terrington, R.L.; Waters, C.N.; Leslie, A.G. (2014). GB3D : a framework for the bedrock geology of Great Britain.Geoscience Data Journal, 1 (1). 30-42. http://nora.nerc.ac.uk/505851/1/gdj39.pdf.
[15] Newman, (2009). The impact of adverse geological conditions on the design and construction of the Thames Water Ring Main in Greater London, UK. Quarterly Journal of Engineering Geology and Hydrogeology, Vol. 42, 5-20.
[16] Page, D. P., Skipper, J. A. E. (2000). Lithological characteristics of the Lambeth Grou Ground Engineering, 33, 38-43.
[17] Refsgaard, J. C., Højberg, A. L., Møller, I., Hansen, M., & Søndergaard, V. (2010). Groundwater modeling in integrated water resources management—Visions for 2020. Groundwater, 48(5), 633-648.
[18] Royse, K. R.; Kessler, H.; Robins, N.S.; Hughes, A.G.; Mathers, S.J. (2010). The use of 3D geological models in the development of the conceptual groundwater model. Zeitschrift der Deutschen Gesellschaft für Geowissenschaften, 161 (2). 237-249. http://nora.nerc.ac.uk/10139/.
[19] Smith, M.; Howard, A. (2012). The end of the map? Geoscientist, 22 (2). 19-21. http://nora.nerc.ac.uk/17280/.
[20] Wood, B.; Richmond, T.; Richardson, J.; Howcroft, J. (2015). BGS Groundhog® desktop Geoscientific Information System external user manual. Nottingham, UK, British Geological Survey, 99pp. (OR/15/046) (Unpublished).
-
Authors

Angelos Gakis Dr. Dipl-Ing, MSc DIC, CEng MICE - Dr Sauer & Partners Ltd
Chief Geotechnical Engineer, Crossrail Farringdon Station
