A review of reactive electrical power and power factor correction (PFC) in the Crossrail Low Voltage (LV) systems
Document
type: Technical Paper
Author:
Mohammed Abu-Qulbain MEng(Hons) MIET, Stuart Hill CEng MIET
Publication
Date: 02/12/2021
-
Read the full document
1 Introduction
In general, electrical systems use Alternating Current (AC). The current is ‘driven’ through the circuit by a voltage, and since the voltage follows a sinusoidal waveform the current is also sinusoidal. Capacitance (C) and inductance (L) naturally occur in most circuits due to the components within them, in particular the ‘L’ and ‘C’ characteristics of the load. The electrical power within the circuit associated with the ‘L’ and ‘C’ components are termed Reactive Power, and the electrical power associated with the resistive ‘R’ components are termed Active Power. Inductance results in the current lagging the voltage. Capacitance results in current leading the voltage.
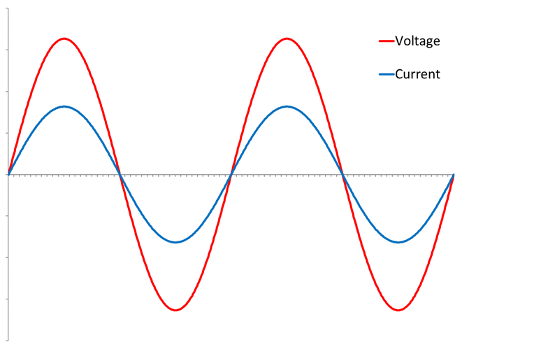
Figure 1. Current and Voltage Waveform –
Linear Current and Voltage in phase (Resistive Load)
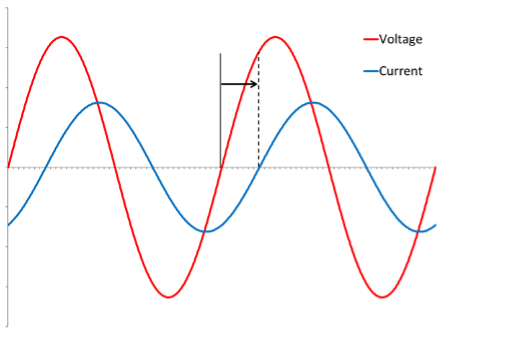
Figure 2: Current & Voltage Waveform – Lagging Current
Current lags voltage (Inductive Load)
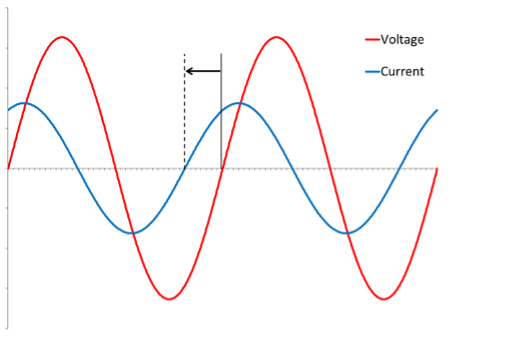
Figure 3: Current & Voltage Waveform – Leading Current
Current leads voltage (Capacitive Load)
Active power is often referred to as useful power, which is required to do work, powering equipment such as lighting, motors, IT equipment, etc. Unlike active power, reactive power is not converted into work, but rather circulates between the source and the load, this increases the amount of current flowing through a circuit and results in electrical losses.[1]
Power consumed in an electrical system is given below:
Using the equation S = I*.V where I* is the complex conjugate of current I (incorporating the phase angle)
The term Power Factor (PF) is a unitless term used to express the relationship between real and reactive power, providing a useful summary of the LV system and the amount of reactive power present. A power factor of unity (PF = 1) means that the electrical system at a particular point contains only active power, whereas a power factor approaching zero (PF = 0) means that the electrical system at a particular point contains only reactive power.
Power Factor is defined as:
PF = P / |S|
Where;
|S| = √(P2 + Q2)
|S| is the magnitude of the complex power S, which includes both real and reactive power
The Power Factor resulting from ‘L’ and ‘C’ components is termed displacement Power Factor (DPF), as the relationship is associated with the displacement (leading or lagging) current waveform relative to the voltage – as shown in Figures 1-3.
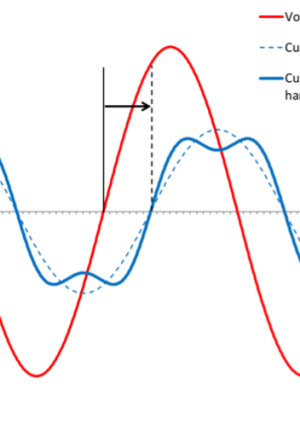
Modern electrical loads often have non-linear components also, whereby the current drawn by the load is not purely sinusoidal. To analyse these waveforms Fourier Transforms are used to represent the non-sinusoidal waveform as a set of harmonic components. Figure 4 below shows an example of a current waveform which has an inductive ‘L’ component and also a 3rd harmonic current. This harmonic component also introduces reactive power into the electrical circuit and so decreases the system Power Factor. The reduction in system power factor resulting from harmonic current is termed distortion Power Factor (PFD).
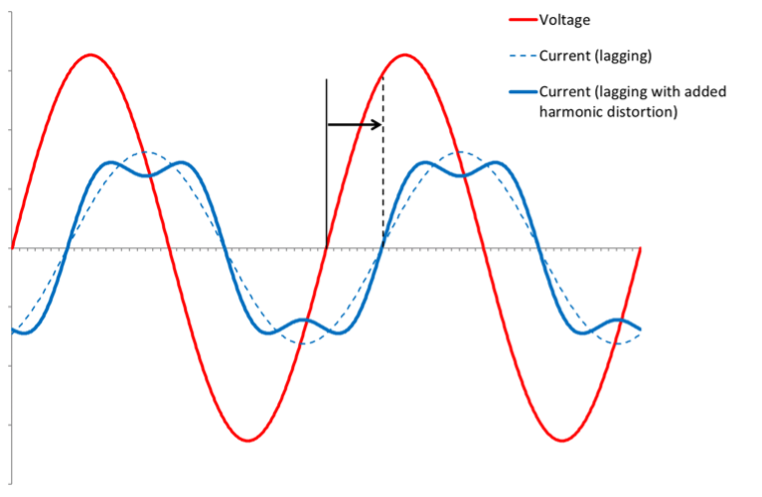
Figure 4: Current & Voltage Waveform – Lagging Current with 3rd Harmonic Component
True Power Factor can be expressed as two aspects; distortion PF and displacement PF:[6]
PFT = PFD . DPF
Consumer electricity networks which have distorting and displacing load currents, will have a reduced True Power Factor. Methods are often employed to correct the power factor and increase the PFT closer to unity (PFT ≈ 1) at the point of connection to the main supply.
1.1 Power Factor Correction Used on Crossrail
During the design stages of the Crossrail project, the power factor of the Low Voltage system and the proposed correction method has been assessed based on estimated values as opposed to final state readings. The Power Factor Correction (PFC) was designed to meet JY 71 LV Switchgear and Distribution Boards Crossrail M&W Specification Clause JY71.1201 which states:
e) Power factor correction equipment shall be provided on individual items of equipment along with a PFC bank at each LV main switchboard to ensure a minimum overall lagging power factor of 0.98 is achieved.
These requirements were aimed at ensuring the power quality maintained on the LV system is kept at optimal conditions, reducing the losses in the High Voltage supply system which may result from distorting and displacing load currents.
All Crossrail stations installed traditional PFC units based on Capacitor Banks which mitigate against the main cause of distorting power factor; lagging power factor due to inductive ‘L’ load current. The smallest step size utilised across all Crossrail sites was 25kVAr with the exception of Custom House Station & Mile End Shaft. These two sites utilised 12.5kVAr which, although available in the market, are a non-standard item.
Measurements undertaken by the Crossrail project observed a number of sites displayed leading power factor which is an odd occurrence due to the majority of the connected load being believed to be of an inductive nature.
2 Power Factor Corrections & How They Work
There are two methods of correcting power factor available on the market as described below.
2.1 Traditional PFC Units – Capacitor & Inductor Banks
Going back to the basics capacitors & inductors store energy in different forms. Inductors store energy in the form of a magnetic field meanwhile capacitors store energy in the form of an electric field. To sustain a magnetic field, inductors consume reactive power, on the other hand, capacitors produce reactive power.
Based on the above traditional power factor correction systems work by utilising a bank of capacitors and or inductors offering a particular capacity (measured in kVAr) to meet the demand of the LV system. The banks are configured into a number of steps, each consisting of a set kVAr size and cumulatively adding up to the total capacity. The PFC unit has a controller which measures the reactive power demand and brings a step or a number of steps.
This approach is one of the most common applications of power factor correction in Low Voltage electrical system, however, one limitation of this type of PFC system is that it is not dynamic, and the resolution is limited by the size of steps and reaction time of the controller. Thus, there are times when this type of PFC is not responsive to small changes in the displacement current as the load increases and decreases with changes in consumption (e.g. combinations of turning lights on and off, lifts moving and ventilation systems increasing/decreasing).
2.1.1 Example
If the system is operating with a reactive power demand of 24kVAr but the smallest step size is 25kVAr the PFC system will do nothing.
If the system then shifts to a reactive power demand of 25kVAr the smallest step size of 25kVAr in the PFC system will be brought into use and the DPF will be corrected back to unity.
If the system then continues to increase in reactive power demand of 25-49.9kVAr, the PFC system will only bring one 25kVAr step into use and therefore will only compensate the system by 25kVAr as opposed to the full required 49.9kVAr.
An obvious solution to this would be to reduce to a smaller resolution within the PFC system. However, this is limited by the availability of capacitor module sizes on the market, and repetitive switching on/off smaller modules would cause increased wear on the components. Implementing a PFC system with greater resolution (i.e. smaller capacitor modules) becomes increasingly expensive which is not off-set by the gains achieved commercially or on a technical basis.
2.2 Active Methods of Correction
Active Harmonic Filters utilise Power Electronics and generate a leading or lagging current to compensate the system. An Active Harmonic Filter, AHF, has the ability to correct poor displacement power factor and can provide correction for either leading (capacitive) or lagging (inductive) loads.
AHF units are able to provide a dynamic response to the electrical system and can inject reactive power that is endlessly variable to correct and maintain a targeted PF. The units can be set to target the required PF and hold it to this specific value, or the value can be set to an optimised PF which allows the PF a bandwidth between the target PF and unity. Where the unit will only inject reactive power should the PF go beyond the prescribed bandwidth, saving on operational expenditure.
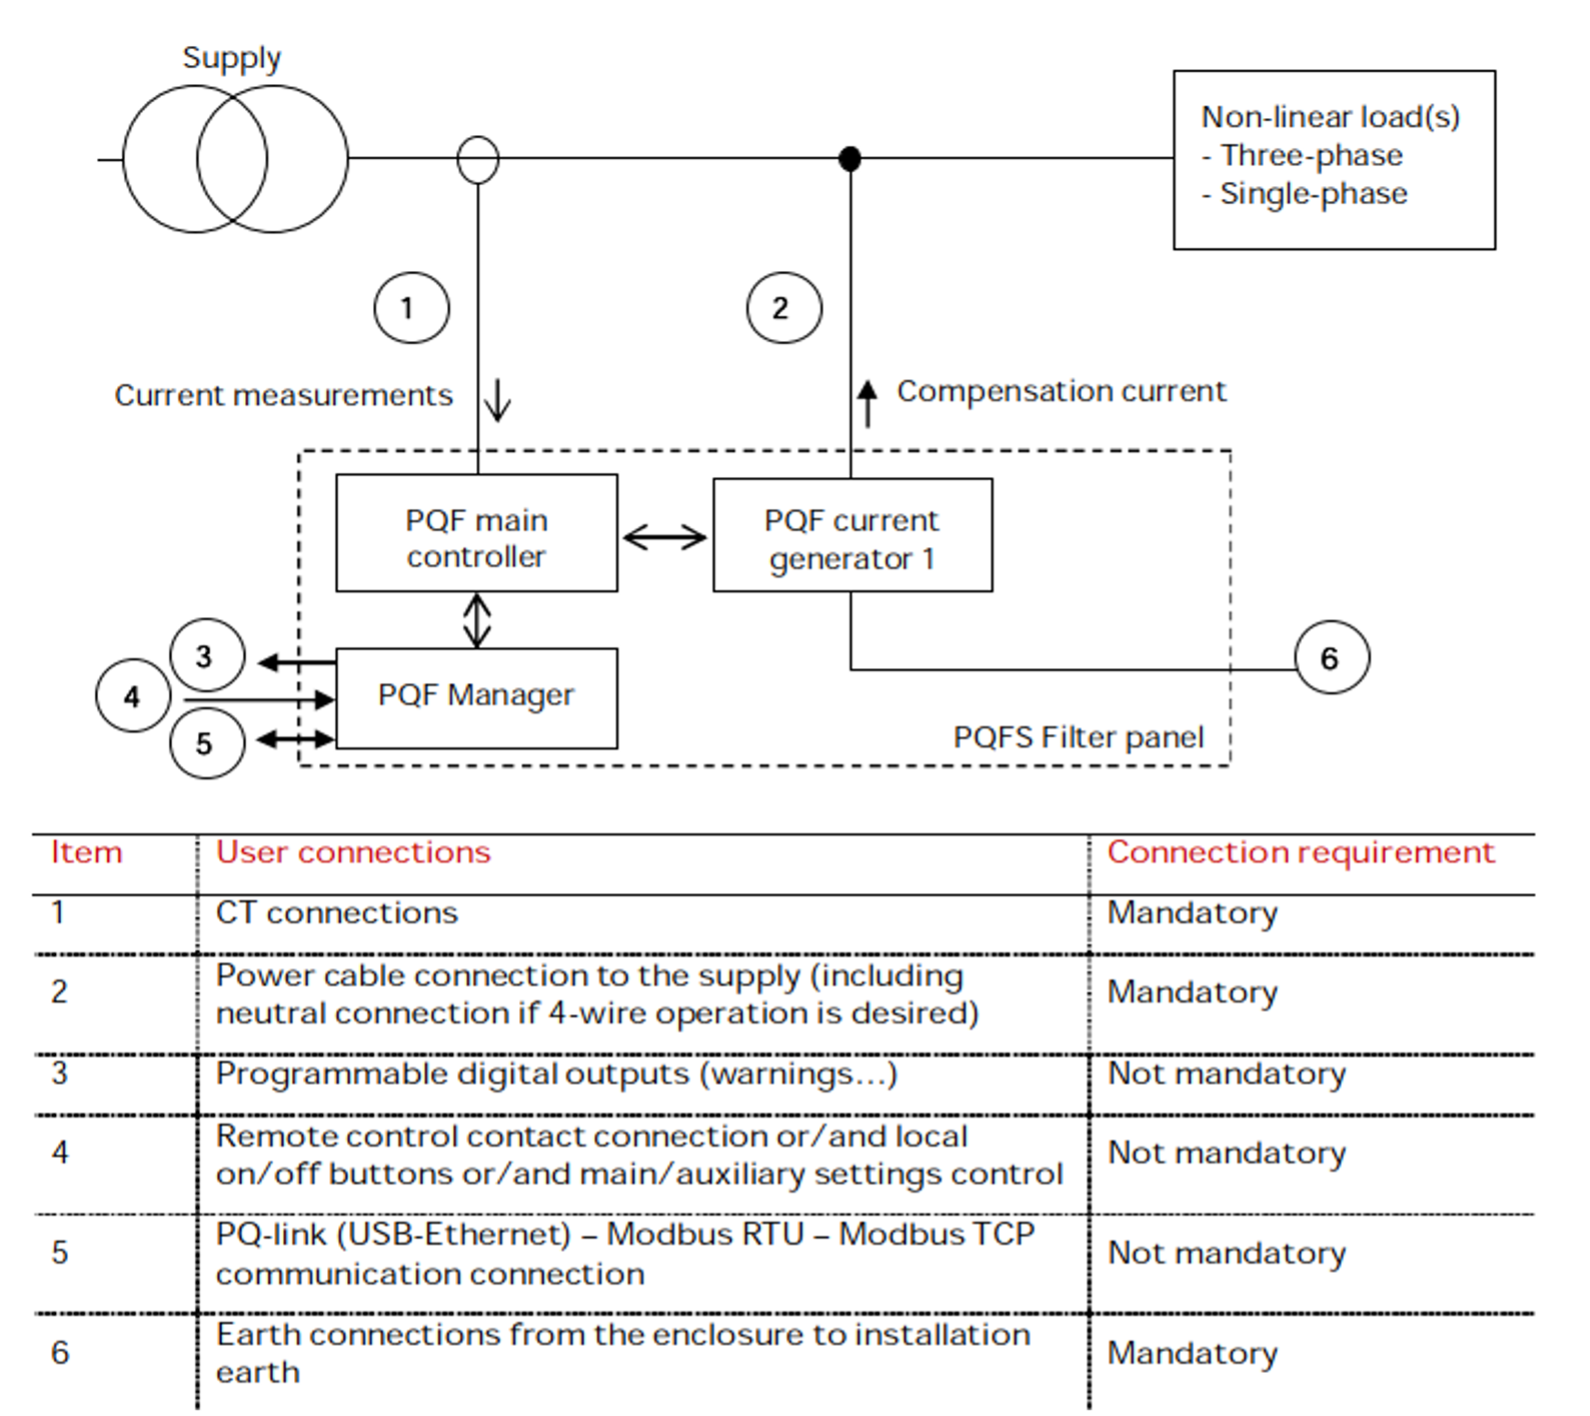
Figure 5. ABB PQFS Schematic[7]
An AHF unit contains a controller which measures the line current being drawn by the load through the use of Current Transformers which are located upstream of the AHF. The Controller is able to determine the level of current required to correct the leading or lagging power factor. The controller then signals to a current generator that converts the control signals into the filter compensation current injected back into the system.
AHF units are able to respond to changes in the electrical system and rectify them within a 40ms (10% – 90% Filtering) with a programmable PF set point from 0.6 lagging to 0.6 leading. The AHF can also filter out any unwanted harmonics in the system. This is also beneficial as there is a negative correlation between harmonics and True Power Factor[4], as can be seen from the below:
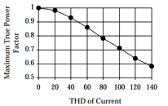
Figure 6: Correlation between True Power Factor vs Total Harmonic Distortion of Current[3]
2.3 Loads and their Impacts on Power Factor
The majority of installed loads would impact the PF within the railway environment except those which are purely resistive. However more precisely there are certain loads which are a cause of poor PF:
- Switch Mode Power Supplies
- Large Mechanical plant – typically operating with Variable Speed Drives
The above-mentioned loads are referred to as non-linear loads where the current waveform does not follow a standard sinusoidal wave as can be seen below.

Figure 7. Non-Linear Load Waveform of Current and Voltage[2]
Loads which are harmonic contribute to a reduction in the true power factor (PFT). Although some loads may have a displacement power factor of unity the true power factor may be far from unity[5] as a result of their non-linear or harmonic current.
2.4 LED lighting Behaviour – Loading Scenarios
As lighting designs progress, more and more systems are utilising smarter control systems offering more control and dimming capability. Systems such as the Digital Addressable Lighting Interface (DALI) used in many modern buildings and used extensively across the Crossrail project, allow users to reconfigure and programme the lighting system to their needs, providing tremendous benefits to energy consumption and prolonging the life of the lighting fixtures.
However, there is a by-product to a premises with many DALI drivers/controllers in dimmed or standby mode. The below data are the findings of a practical study carried out by Philips.
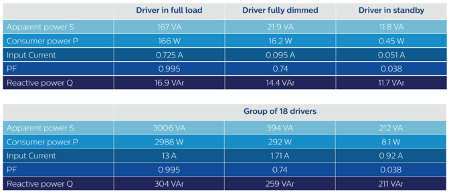
Table 1. Philips LED Comparison of Operation Mode vs PF[9]
It is evidently clear that there is a correlation between the operating mode of the LED/Driver and the PF. As can be seen a fully dimmed driver has a PF of 0.74 in comparison to the operating near Unity under full load condition. It can also be said that change in reactive power Q is smaller and therefore doesn’t impose as big of a problem due to the reduced input current in fully dimmed or standby operation.
Furthermore, some LEDs can be seen to have a leading PF due to the passive filters used within the luminaires which rely on capacitors. The below figure captures results from a LED study whereby the True and Displacement Power Factor is measured.
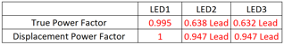
Figure 8. Measured True & Displacement PF for 3 LED Lights[8]
As expected, the True PF measured is worse than that of the Displacement factor, as previously discussed this is because the True PF takes into account the harmonic frequencies.
3 Power Factor Correction under various loading conditions, & its effects
In order to test the PFC systems and demonstrate compliance Crossrail’s Chief Engineering Group (CEG) rolled out a test script which was prepared to ensure all sites shared a similar operational arrangement and testing & commissioning records followed a similar format. However due to fundamental differences between the sites certain loads which were included in the test script are not present at all sites for example:
- Tunnel Ventilation Plant – not present on smaller sites such as Plumstead Portal
- Staircase Pressurisation Plant – not present on smaller sites such as North Woolwich Portal
As testing took place whilst the railway was not in its operational final state, only loads depicted on the test script were running.
During these tests the following was observed:
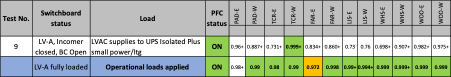
Table 2: Measured PF across large sub-surface Crossrail stations[10]
Large sites displayed a power factor compliant with the target requirement of 0.98 with a fair example of operational loads active. However, using the example of test 9 from the CEG Test script which describes the LV configuration as follows:
- LV-A, Incomer closed, BC Open
- PFC Unit On
- LVAC supplies to UPS Isolated Plus Small Power/ Lighting
Out of 6 large sub-surface stations, Paddington, Tottenham Court Road, Farringdon, Liverpool Street, Whitechapel and Woolwich, which each have two separate LV systems (East & West), all gave rise to Power factor figures below the 0.98 target.
Meanwhile for test 15 which has the following configuration:
- LV-A, Incomer closed, BC Open
- PFC Unit On
- LVAC supplies to UPS energised Plus Small Power/ Lighting
- Plus Escalators, Over Platform Extract, HVAC & chillers and TVS Energised
All of the 6 large sub-surface stations displaying compliant PF readings with the exception of Farringdon East which marginally fell short of the 0.98 lagging with a reading of 0.97 lagging.

Table 3: Measured PF for smaller Crossrail sites including surface stations, shafts and portals[10]
Similarly, to the above, the smaller stations, shafts, and portals for test 9 all displayed a PF below the target of 0.98. Furthermore, under fully loaded conditions only two sites displayed compliant PF; Eleanor Street Shaft & Stepney Green Shaft. It is noted that these were the only two sites with Tunnel Ventilation Systems, a comparatively large load with good power factor correction performance which would have had greater influence on the PF than those with only lighting and smaller power consuming items.
The brief comparison above clearly demonstrates the impact of the operational running load on the achieved power factor on a system.
Because the Power Factor is sized based on the maximum demand, MD, and both of which are dependent on two crucial assumptions, amongst others:
- Assumed Diversity
- Assumed overall PF of the system which needs to be corrected
Both assumptions have major impact on the Power Factor and Maximum Demand. During the design phase there is limited information of what a load profile for a station would look like, and at best it be estimated based on some typical assumptions. Electrical loads are inherently very cyclic, and unlike buildings with more activity-based or climate-based load profiles, railway stations, shafts and portals have intricate and complex differences between their systems and system loads. Presently there is little published data or any reliable “rule of thumb” guidelines which designers can rely on.
As identified during the assessments made by the Crossrail C530 contract, the measured operating current at the time of tests depicted a load not greater than 25% of what was calculated in the MD. This is largely anticipated because the building systems have several large loads which are typically off or in low load state, but will have a load profile that increase and decrease according to a combination of railway system operations, station and portal operation, emergency system use/testing, system maintenance and a variety of other factors.
The data measured during the testing and commissioning of the Crossrail project could be seen to suggest that because the PFC banks were sizes based on the full load (Maximum Demand) conditions these PFC banks were oversized for general lower load operating conditions, or more precisely the PFC systems were not provided with the degree of resolution required to react to a low load operation scenario. This resulted in the PFC system operating adequately and achieved compliant PF when a sufficiently large running load was met, but under low load scenarios the PFC system did not achieve the desired 0.98 PF value.
3.1 Effects of low load scenario
The effects of a low load scenario coupled with the behaviour of certain loads can be demonstrated in the following example.
3.1.1 Worked Example
Using the figures from Table 1.
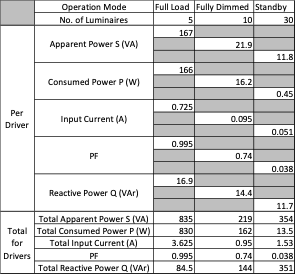
Table 4. Worked example for 45 drivers across a site
From the above figures, Table 5 below shows the summated power figures for lighting.

Table 5. Cumulative power figures for lighting
Assuming the site has an overall load excluding lighting as follows for two operational scenarios, low load and high load and a constant PF:

Table 6. Power figures for non-lighting loads
Combining the power figures for lighting and small power:

Table 7: Cumulative power figures for small power & lighting
As shown in Table 7 the impact of the lighting on the overall site PF is dependent on the overall running load. Under low load, the PF of standby luminaires plays a large role which is further magnified by the quantum of luminaires across the site.
Although the site displayed a PF of 0.9 without taking lighting into account, the cumulative effect of the drivers and their behaviour under dimmed and standby operation begins to play a larger role during the low operating scenario – which is a more common condition – bringing the PF down to 0.8. During the full load scenario, the same dimmed lighting has a reduced impact on the total power factor because the consumed power (P) has increased to a greater extent than the reactive power (Q).
4 Cost Analysis of PFC & Load scenarios
There are obvious advantages of incorporating power factor correction into an LV system; beyond the realm of achieving the Crossrail specification requirement of 0.98 lagging minimum. The advantage of PFC depends on a several factors:
4.1 Average non corrected power factor on the LV system
The impact of a PFC system depends on how much reactive power compensation is required. If the normal operational state of a site gives rise to an average PF of 0.95 lagging whereas the required is 0.98 the system is being corrected by 0.03. Therefore, the impact the PFC system is assessed against the additional cost resulting from the 0.95 PF over the lifetime of the PFC system relative to the cost of providing the PFC system itself.
Meanwhile if the PFC system is correcting from an average PF of 0.8 to 0.98 lagging then PFC would play a larger role on such an installation and the lifetime cost-benefit would be more viable.
4.2 Average operating load
Similar to the above, the impact of the PFC system also depends on the operating load. The impact of a low PF on a low operating load such as 0.8 lagging PF on a 10kVA operative load has less cost associated with it when compared with 0.9 lagging PF on a 100kVA operating load.
4.3 How responsive the PFC system is
A PFC system which is not very responsive is a system which cannot react to small changes in the load and subsequently the kVAr demand. The resolution of the system is determined by the size and quantity of increments/ steps which itself has some practical limitations. If the smallest step on a capacitor bank is 50kVAr then the system will only be able to react when the reactive power of the system meets or exceeds 50kVAr.
4.4 Cost of implementing/incorporating PFC into the LV system
Finally, the cost of incorporating the PFC system is a major indicator, the benefits and energy cost savings of the PFC must outweigh the cost of the system itself.
A cost assessment has been carried out by C530 which provides a direct comparison between the cost of implementing a new PFC solution moving away from traditional Capacitor banks.
4.5 C530 Cost Benefit Analysis
In response to the measured PF readings indicating a PF below the desired 0.98, the C530 contract team (covering Woolwich Station, Plumstead Sub-Station, Plumstead Portal, North Woolwich Portal and Connaught Support Building) carried out a cost benefit analysis based on proposed solution of installing AHF units instead of capacitor based PFC units. The assessment was developed with the following base assumptions:
- 25-year life of correction method
- The assumed Tariff is based on High Voltage Half Hourly Metered
- Fixed charge p/MPAN/day irrespective of the power factor
- Capacity Charge of 7.79 p/kVA/day
- Reactive Power Charge of 0.201p/kVA/day
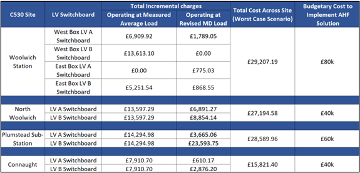
Table 8: Crossrail C530 Contract Cost Benefit Summary[11]
A worst-case assessment was made where the system was deemed to operate both at the measured average load and based on a revised maximum load demand assessment. Bringing about the above incurred costs resulting from a power factor <0.98 during normal operating conditions, as shown above in table 8.
Due to the low average measured load, coupled with a revised MD, the costs incurred are lower than what would be seen based on a higher MD assessment. The cost analysis concluded that working towards achieving the PF requirement of 0.98 by means of installing AHF added little value due to the higher cost of implementing a solution than the cost savings.
The above would not be true had the operating load been higher or if the system displayed a less desirable PF.
5 Lessons learned
5.1 Load Profiles for an Operational Site
There is a large delta between connected load and running load, that statement stands without taking into account the various operating scenarios such as network power up and fire conditions. There are multiple sources of information that designers rely on such as BSRIA Guides and British Standards etc. However, the Railway industry is so varied with different systems across the industry and the Low Voltage system can also vary considerably depending on whether they are used in Light Rail, Metro, High-Speed rail, surface or sub-surface infrastructure.
Obtaining live operational load profiles will enable designers to better fine tune systems such as power factor correction based on more accurate maximum demand calculations. Utilising the example of North Woolwich Portal, a small portal which does not include large plant such as Tunnel Ventilation Fans or Staircase Pressurisation system displayed a very small running load. This information, and monitoring data for other similar sites would be a valuable asset to be shared with future infrastructure owners and designers.
5.2 Procure PFC Systems based on final state readings
There are benefits to procuring PFC systems based of final state readings recorded once the railway is operational. Selecting and procuring PFC based on preliminary design data has shown to be difficult and often leading to provision of systems which are not the most efficient solution during normal operating conditions which are much lower loaded than the Maximum Demand scenario. Instead, it can be argued that it is more appropriate to make provision for power factor correction systems to be implemented post-construction when realistic operating conditions can be measured. However, this may introduce more complicated commercial structures to facilitate this in practice.
5.3 Use Active Methods of Correction as Opposed to Traditional Step Banks
As technology advances active methods of correction provide more functionality to the user. Within a single system both Harmonics and PF correction can be catered to potentially even reducing the space required by two separate systems. Furthermore, a single AHF can correct both leading and lagging removing the need for separate inductor and capacitor banks.
As discussed earlier in this paper, with more LEDs and more non-linear loads are being installed on sites. The need for both more reactive correction methods and systems which can cater for a leading PF is much more apparent than in the past. The PFC solutions in future projects should also cater for increased capacity, by facilitating units which can be arranged in a master-slave arrangement to add more capacity to the AHF.
The use of AHF offer a number of benefits over traditional PFC methods, and are better equipped to deal with the increased non-linear loads seen in modern LV systems. However, special consideration must be paid to the following items:
5.3.1 Heat dissipated
These units can dissipate a considerable amount of heat which makes these units difficult implemented as a retrospective upgrade unless adequate cooling/ventilation, or passive provision for the same, has been suitably considered in the switchroom design. The following table provides typical heat loss data for an example range of AHF units:
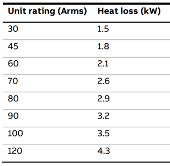
Figure 9: Active Harmonic Filter Heat Dissipation per Unit[7]
5.3.2 Skin effect
Due to the frequency of the system being higher than the LV network, the Skin Effect phenomenon within the relevant LV cables needs to be considered. At higher frequencies, the current tends to travel in the outer surface of the conductors, leading to an uneven head distribution within the cable, and the effective area which the current uses to travel through the cable being reduced. Due to this phenomenon the cables may need to be oversized to take into account the way the current behaves.
6 Conclusion
An effective and systematic change in the way Power Factor Correction is approached will be beneficial to future railway and other LV infrastructure projects. With the advancements in technology Active methods of correction can cater for a wider range of effects in the modern LV systems containing more complex electronic and non-linear loads. The advancement of smart metering, more developed BMS or monitoring systems, and greater focus on energy management should be giving us a step-change in the amount of electricity usage data being obtained from infrastructure managers & operators. As an industry, clients, designers, users and maintainers would all benefit from more transparent sharing of this load and consumption data to enable more informed decisions to be made in relation to maximum demand, power factor, harmonics and overall systems efficiency.
References
[1] Hofmann, W., Just, W and Schlabbach, J. (2012). Reactive power compensation a practical guide. Germany: Wiley.
[2] Faiz, J and Shahgholian, G. (2009). Modelling and Simulation of a Three Phase Inverter with Rectified Type Non-Linear Loads. Armenian Journal of Physics. 2(4): p307-316. Available from: https://www.researchgate.net/publication/228891815_MODELING_AND_SIMULATION_OF_A_THREE-PHASE_INVERTER_WITH_RECTIFIER-TYPE_NONLINEAR_LOADS [Accessed 13th August 2021].
[3] Grady, W and Gilleskie, R. (1993). Harmonics and How They Relate Power Factor. In: Proceedings of the EPRI Power Quality Issues & Opportunities Conference (PQA’93). San Diego, CA. Available from: https://www.maintenance.org/fileSendAction/fcType/0/fcOid/399590942964674223/filePointer/399590942964873514/fodoid/399590942964873512/POWERFAC.pdf[Accessed 21st August 2021].
[4] Williams, D. Understanding total harmonic Distortion (THD) in power systems – technical articles. All About Circuits. 2017. Available from: https://www.allaboutcircuits.com/technical-articles/understanding-thd-total-harmonic-distortion-in-power-systems/ [Accessed 21st August 2021].
[5] Santoso, S., McGranaghan, M., Dugan, R and Beaty, H. (2012). Electrical Power Systems Quality. Second Edition. Spain: McGraw-Hill.
[6] Das, J.C. (2015). Power System Harmonics and Passive Filter Designs. Germany: Wiley.
[7] ABB. Instruction Manual: Power Quality Filter PQFS. Available from: https://search.abb.com/library/Download.aspx?DocumentID=9AKK107045A4706&LanguageCode=en&DocumentPartId=&Action=Launch [Accessed 7th August 2021]
[8] Voltage Disturbance Power Engineering Study Resource. LED Lamps. Available from: http://voltage-disturbance.com/lighting-power-quality/led/ [Accessed 20th August 2021]
[9] Philips White Paper. Power Factor when changing from Conventional to LED lighting. Philips Lighting. Signify; 2020. Available from: https://www.docs.lighting.philips.com/en_gb/oem/download/xitanium-led-drivers-outdoor/power-factor-white-paper.pdf [Accessed 21st August 2021].
[10] Leary, N. (2021). Power Factor Testing Summary Report, Station, Tunnels, Shafts and Portals. CRL1-XRL-E-RGN-CR001-50064. Crossrail.
[11] Chitsatso, T. (2021). C530 Power Factor Correction (PFC) Technical Note. C530-BBR-E-RGN-CR147-50658. Mott MacDonald.
-
Authors

Mohammed Abu-Qulbain MEng(Hons) MIET - Mott MacDonald
An electrical engineer in the Building Services sector, with specialist skills in low voltage design within the railway environment. Previously having worked on Woolwich Station & Portal Fit out Stage ‘F’ design and resident electrical engineer onsite, Bond street Station and Crossrail Plateau 2.

Stuart Hill CEng MIET
Stuart is a chartered engineer with over 15 years’ experience of designing electrical building services systems for rail and other sectors. He has been engaged with the Crossrail programme since the Hybrid Bill and Royal Ascent programme. More recently he was the lead electrical engineer for Mott MacDonald team developing the construction design for Woolwich Station.