Analyses of convergence and utilisation of SCL-tunnels during excavation
Document
type: Technical Paper
Author:
Dr Alfred Stärk Dipl Ing Dr Ing, Larisa Jimenez Rangel, Christopher Wade, ICE Publishing
Publication
Date: 31/08/2016
-
Read the full document
Notation
Ch. Chainage
CP1a Cross Passage 1a
PTW-W PT Platform Tunnel Westbound-West Pilot Tunnel
PTW-W EL Platform Tunnel Westbound-West Enlargement
SCL Sprayed Concrete Lining
Ø tunnel diameter
Introduction
The platform and pedestrian tunnels for the Crossrail Stations at Whitechapel and Liverpool Street have been constructed using Sprayed Concrete Lining (SCL) techniques 20 m to 30 m below the congested urban streets of London. Most of the tunnels were built in two stages. Firstly an approximately 6.3 m Pilot Tunnel has been excavated, followed by a 10.5 m to 11.5 m Enlargement.
As a common part of SCL construction sequence, in-tunnel displacements have been used to monitor stability during construction. This paper provides a comparison between the measured and the predicted displacements in order to provide a feedback to the designer on design assumptions.
- Absolute displacements: a comparison gives an indication if general assumptions on ground properties, support properties and effectiveness, and construction sequence have been matched within the design. Common and important tools of checking are time-displacement graphs which provide the absolute displacements and the zone of influence until a new equilibrium has been established. Generally, if the measured displacements are equal or less than the predictions, stable and safe conditions are assumed.
- Convergence: analysis of measured single point displacements is often insufficient to assess stability since displacements may not necessarily create stress in the lining, such as in the case of whole body movement of the lining. An analysis of the deformation of the tunnel lining in terms of relative displacements between monitoring points is required. For this reason convergence and divergence across the tunnel section between adjacent monitoring points have been calculated and checked against predictions.
- Utilisation: due to the time dependent nature of shotcrete, i.e. strength and strain development and creeping ability, the same deformation occurring at different ages of the shotcrete creates a different state of stress. Therefore, Utilisation has been calculated. Utilisation is defined as the ratio of actual stress and permissible stress; thus, it gives the actual factor of safety. See [1] for further information and references on Utilisation.
Crossrail contract C510 comprises the SCL tunnelling works for the two new stations at Liverpool Street and Whitechapel. Tunnel size, geology (mainly London Clay[2], [3]), construction sequence and support have been the same. LaserShell™ tunnelling technique has been used for Pilot Tunnel and Enlargement[4], [5], [6].
The main difference between both stations is the depth of the main tunnels. At Liverpool Street Station the crown is approximately 30 m below ground level; at Whitechapel Station approximately 20 m. Presumably for this reason Liverpool Street Station has slightly larger absolute displacements. Otherwise the monitoring results are comparable.
Three areas have been selected within this analysis:
- Whitechapel’s Platform Tunnel Westbound – West Heading (PTW-W) has been picked as case history because its approximately 220 m length was the longest continuous SCL excavation within the C510 project providing a comprehensive set of monitoring data (Figure 1).
- PTW-W merges into the Cavern Westbound, another location of interest. This is a double side wall drift about 35 m long and nearly 17.5 m wide forming one of the largest SCL structures ever been built in London Clay.
- A quick look will be provided on the influence of cross passage 1a on the ‘mother’ t PTW-W.
Monitoring arrays have been installed generally at 10 m centres, in both Pilot Tunnel and Enlargement. As it may happen on a construction site, monitoring targets can be destroyed, or damaged, obstructed or suffer other reasons preventing them being read. For this analysis the data base has been filtered to pick only those arrays with early base reading and good and continuous data thereafter.
The design provided predictions on displacements individually for each monitoring point within an array. It is obvious that the location of the monitoring target within the cross section can have a significant influence on the displacements, predicted and measured. E.g. the higher a target is located towards the crown the more vertical displacement can be expected; the closer the target comes to axis level, where the tunnel is widest, the more horizontal movement should occur. As-built positions of targets have been checked against their theoretical position in the design, to make sure that the predicted displacements are applicable and not to compare apples and oranges.
As a side note: one of the prominent features of the LaserShell™ is the inclined and domed face. The main reason for this is an overhead protection close to the face and an increase of face stability. This results in an inclined advance and, to ensure that all monitoring points of an array are located in the same advance, in an inclined position of the monitoring arrays. The inclined face has been taken into account in the design.
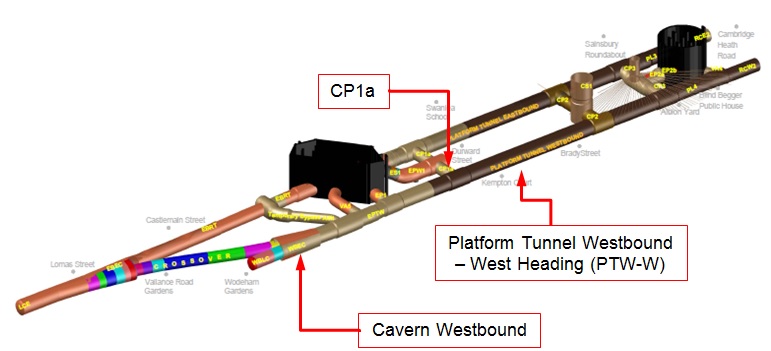
Figure 1 – Whitechapel Station. The case history looks at Platform Tunnel Westbound – West Heading, opening for CP1a and at Cavern Westbound. Graphic Credit: BBMV JV C510. 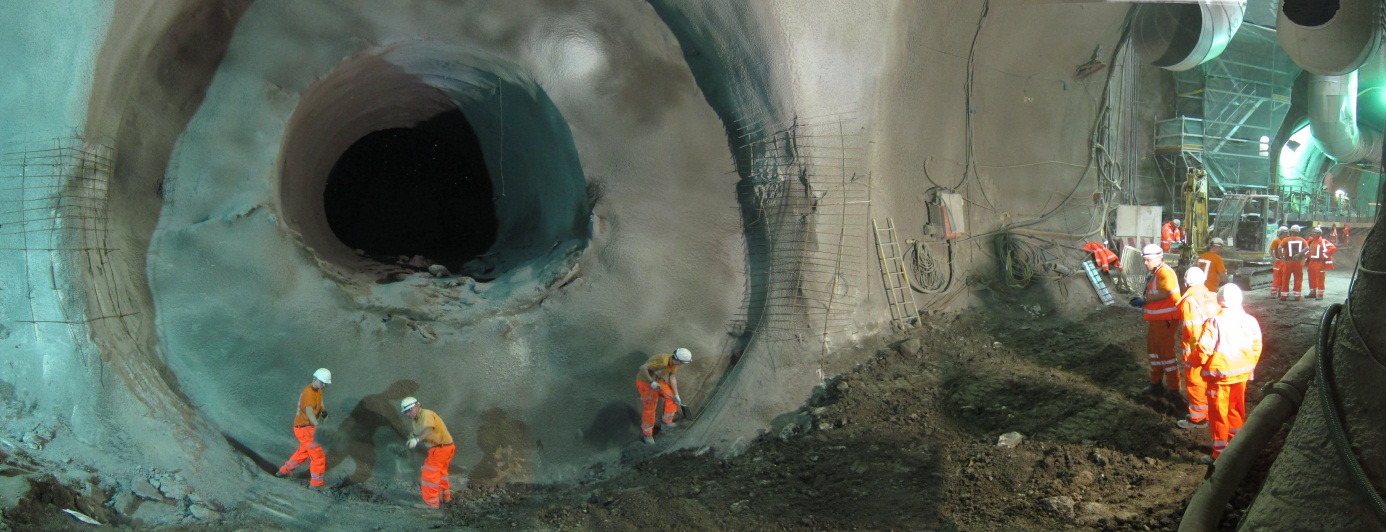
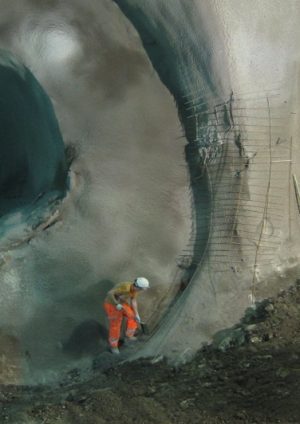
Figure 2 – Whitechapel Station. PTW–W; completed Pilot Tunnel and start of Enlargement. Geology
Excavation of PTW-W and the Cavern Westbound was entirely in London Clay. The top of London Clay was approximately 10 m above crown level. The bottom of London Clay, i.e. the top of Lambeth Group was two to five meter below invert level. Harwich Formation was present in some areas at the interface between London Clay and Lambeth Group. Further details on geology can be found in [2] and [3].
Pilot Tunnel
Absolute displacements, Pilot Tunnel
Pilot Tunnels have been excavated full face in 1 m-advances. The structural lining had a thickness of minimum 250 mm which has been applied in every advance in two layers, 75 mm initial lining and 175 mm primary lining.
The layout of the monitoring arrays in the design stage assumed the ventilation duct to be positioned centrally in the crown. Therefore, no monitoring point in the crown was foreseen, but a on either side of the ventilation duct resulting in six monitoring points per array. During construction the ventilation duct could be re-positioned into the shoulders thus leaving more space for the excavator arm to manoeuvre – and allowing for a monitoring point to be installed centrally in the crown and going back to the usual five monitoring points per array. This slightly different position of the crown target had only impact on the predicted horizontal displacement which is now zero; the influence on the predicted vertical displacement is less than half a millimetre and negligible.
Figure 3 shows the vertical displacements versus time at Chainage 85. For the sake of clarity graphs for points 2 and 4 are not shown as they are nearly identical to their counterparts 3 and 5. For location of monitoring points see pictogram within Figure 3.
The measured vertical displacements show the typical settlement curves:
- largest increase occurs at the first day;
- fading out within 5 to 10 days, in average 7 days;
- absolute values -5 mm to -7 mm at the crown;
- absolute values -2 mm to -5 mm at the lower points 4 and 5.
- The tunnel on the whole settles by -2 mm to -3 mm as indicated by the points 4 and 5 (whole body movement). Only the remaining differential movement between the points generate deformation and hence stress in the lining.
The predicted vertical displacements generally match with the measured; however the predicted whole body movement is smaller.
The measured horizontal displacements are not shown. They have no identifiable trend as they are not exceeding 2 mm. The predicted horizontal displacements are in the order of 5 mm inwards. This is more than double as much as measured.
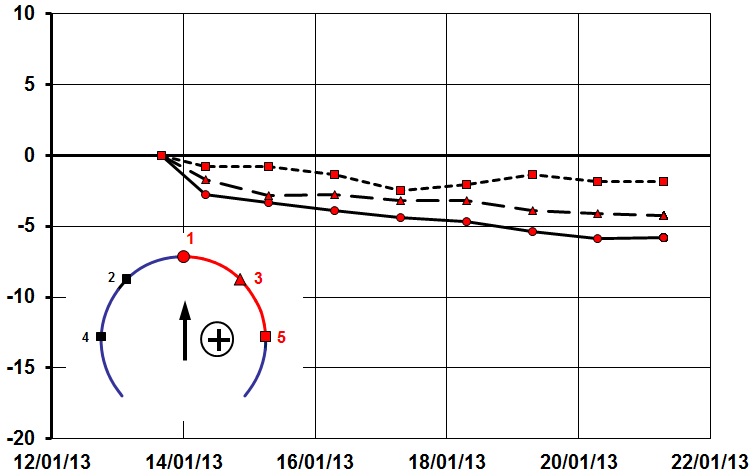
Figure 3 – PTW-W Pilot Tunnel. Chainage 85 represents typical vertical displacements versus time. Note: points 2 and 4 not shown for the sake of clarity. Negative sign = settlement. Convergence, Pilot Tunnel
Analysis of measured single point displacements as shown in the previous chapter may not be sufficient in assessing stability since displacements may not necessarily create stress in the lining, such as in the case of whole body movement of the lining. An analysis of the deformation of the tunnel lining in terms of relative displacements between monitoring points is required. Convergence across the tunnel section which is generating deformation have been calculated and checked against predictions.
For another reason convergence is more suitable to assess stability rather than absolute displacements. As seen in the previous chapter, the absolute displacements are generally small, thus the effect of monitoring accuracy is higher as with large displacements. In contrast, relative displacements between monitoring points are less likely to be affected by monitoring accuracy since all points of an array are usually subject to the same error when a reading is taken.
By definition convergence is the shortening of the distance between two points; shown with a negative sign (-). Whereas divergence is the elongation of the distance between two points; shown with a positive sign (+).
The vertical convergence is the settlement difference of the point 1 in the crown to the averaged settlement of points 4 and 5.
The horizontal convergence analysis is based on points close to axis level, where the tunnel diameter is largest. These are the monitoring points 4 and 5.
Fifteen monitoring arrays in the Pilot Tunnel between chainage 8 and 275 have been analysed. Convergence has been calculated at the time when the displacements due to Pilot Tunnel excavation have been faded out. This period has been considered individually for each monitoring array.
Figure 4 provides a matrix where each monitoring array is represented by a marker which shows simultaneously horizontal and vertical convergence / divergence. These are displayed along with a larger marker representing the prediction. Predicted convergence has been derived from predicted displacements which were provided separately in horizontal and vertical directions for each monitoring point.
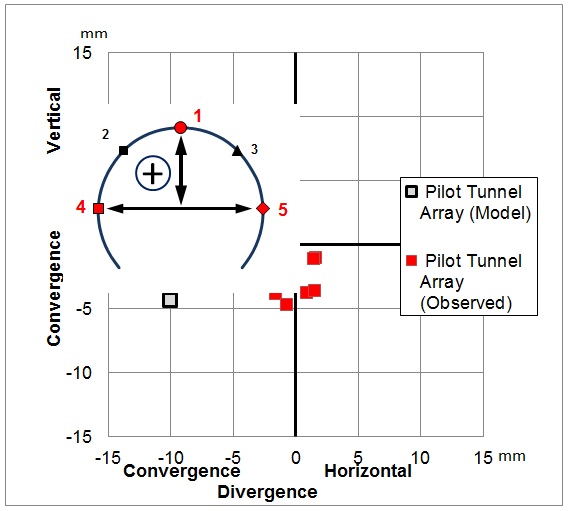
Figure 4 – PTW-W Pilot Tunnel. Comparison of predicted (modelled) and measured horizontal and vertical convergence / divergence between point 1 (crown) and points 4 and 5 (close to axis level). Positive = divergence /elongation; negative = convergence / shortening. For vertical convergence the settlement of points 4 and 5 is averaged. The predicted vertical convergence is -4 mm. This matches with the maximum measured vertical convergence of -4 mm. However, the average is in the range of -2 mm.
The predicted horizontal convergence is -10 mm. The measured horizontal convergence is in the range of 0 mm to -2 mm, with a few arrays showing up to +2 mm divergence. The latter is probably due to monitoring accuracy which usually has to allow for a scatter in the data of ±1 mm to ±2 mm. In average the horizontal convergence is close to zero.
It is obvious that the predicted convergence is significantly higher than the actual measured, especially in the horizontal direction. Assuming homogeneity and a fairly isotropic stiffness of London Clay one possible cause is an overestimation of the load which had to be applied in the design. To bring the larger modelled convergences closer to the measured the horizontal load would need to be reduced which would lead to less convergence in the horizontal direction. Simultaneously, the vertical load must be reduced as well, to keep the vertical convergence at the same level as they are not far-off from the measured ones.
Utilisation, Pilot Tunnel
Utilisation is defined as the ratio of actual stress and permissible stress[1]. Figure 5 shows the Utilisation of the longitudinal section of PTW-W Pilot Tunnel. Each colour or shading represents a section of the sprayed concrete lining. As both, actual and permissible stresses are time dependent and therefore differ from one monitoring array to another Utilisation is given as percentage. ‘100 %’ means that the bearing capacity of the lining is reached which is equivalent to a factor of safety of 1.0. ‘50 %’ means that the stresses can be doubled, equivalent to a factor of safety of 2.0.
With Figure 5 the complete tunnel can be reviewed at a glance: Utilisation is mostly less than 20 %. That means the actual factor of safety is not less than 4.0 and generally larger than 5.0. This result is in line with the small convergences shown in Figure 4.
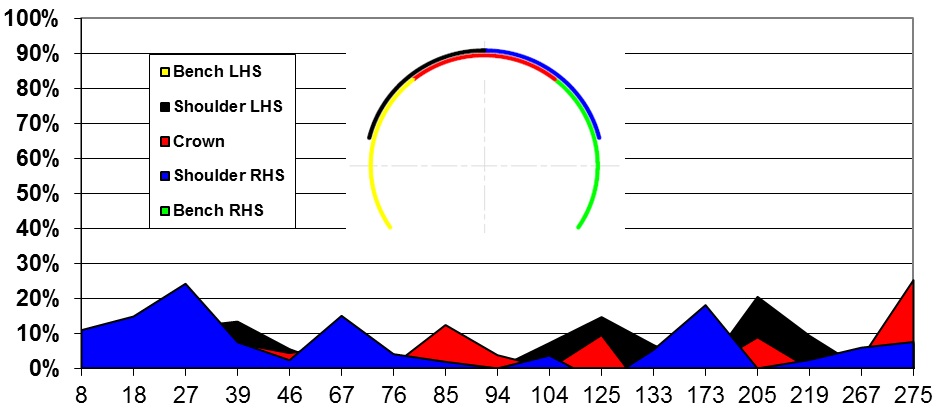
Figure 5 – Utilisation PTW-W Pilot Tunnel Enlargement
Absolute displacements, Enlargement
Enlargements have been excavated in a sequence of two 1 m top-heading advances, followed by a 2 m-invert for full ring closure. The structural lining in the top-heading had a thickness of 325 mm which has been applied in three layers: 75 mm initial lining and 150 mm 1st layer primary lining in every advance; 2nd layer primary lining of 100 mm after invert excavation. The latter was increased at invert by 50 mm to a total thickness of 375 mm.
The enlargement had two different geometries. The regular diameter was approximately 10.5 m; in areas of openings for cross passages the tunnel was nearly one meter larger, approximately 11.5 m. The larger diameter accommodated the thickening of the lining around the opening. The layout of the monitoring arrays in the design and in-situ matches. Each array contains seven monitoring targets. Figure 6 provides a pictogram of point numbers and location.
Figure 6 shows the vertical displacements versus time at Chainage 99, 10.5 m diameter. For the sake of clarity graphs for points 2, 4 and 6 are not shown as they are nearly identical to their counterparts 3, 5 and 7. In terms of absolute displacements no difference could be observed between 10.5 m and 11.5 m diameter.
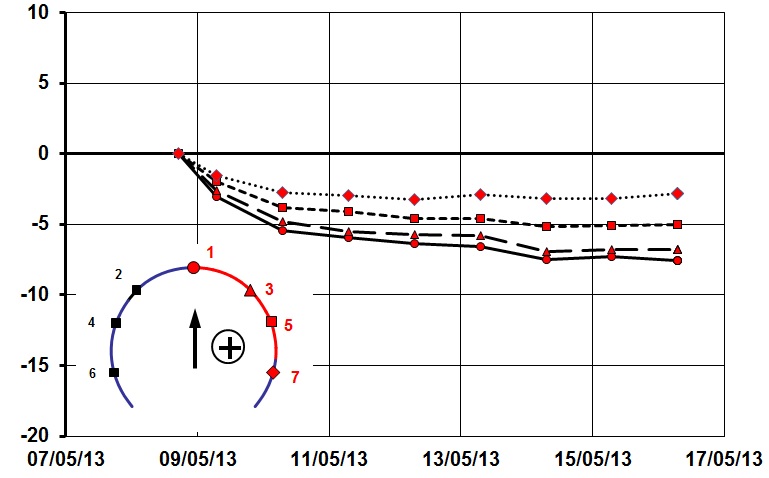
Figure 6 – PTW-W Enlargement. Chainage 99, 10.5 m diameter, represents typical vertical displacements versus time. The measured vertical displacements in the Enlargement are similar to the Pilot Tunnel:
- largest increase within the first two days;
- fading out within 5 to 12 days, in average 8 days;
- absolute values -7 mm to -10 mm at the crown;
- absolute values -2 mm to -3 mm at the lower points 6 and 7.
- The tunnel on the whole settles by -2 mm to -3 mm as indicated by the points 6 and 7 (whole body movement). Only the remaining differential movement between the points generate deformation and hence stress in the lining.
The predicted vertical displacements generally match with the measured; however the predicted whole body movement is smaller.
The measured horizontal displacements are not shown because they have no identifiable trend as they are not exceeding 2 mm. The predicted horizontal displacements are in the order of 6 mm inwards. This is three times more than measured.
Convergence, Enlargement
Design provided for diameters 10.5 m and 11.5 m separate sets of displacement predictions in horizontal and vertical direction, shown in Figures 7 and 8. Accordingly, within the convergence analysis both diameters have been considered separately, with the regular 10.5 m shown as triangles, the 11.5 m shown as squares.
The vertical convergence is the settlement difference of the point 1 in the crown to the averaged settlement of points 4 and 5 (Figure 7) and points 6 and 7 (Figure 8), respectively.
The horizontal convergence analysis looks separately at points 4 and 5 just above axis level (Figure 7), and at points 6 and 7 just below axis level (Figure 8), where the tunnel diameter is largest.
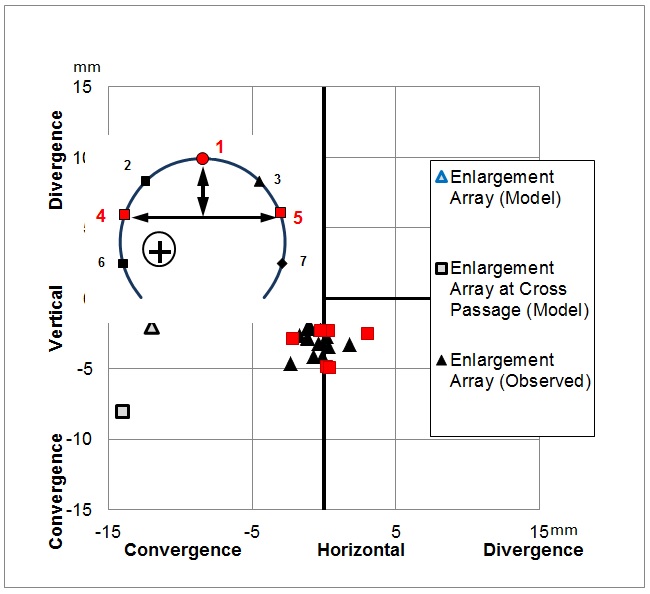
Figure 7 – PTW-W Enlargement. Comparison of predicted (modelled) horizontal and vertical convergence / divergence between point 1 (crown) and points 4 and 5 (above axis level). Posi-tive = divergence /elongation; negative = convergence / shortening. For vertical convergence the settlement of points 4 and 5 is averaged. 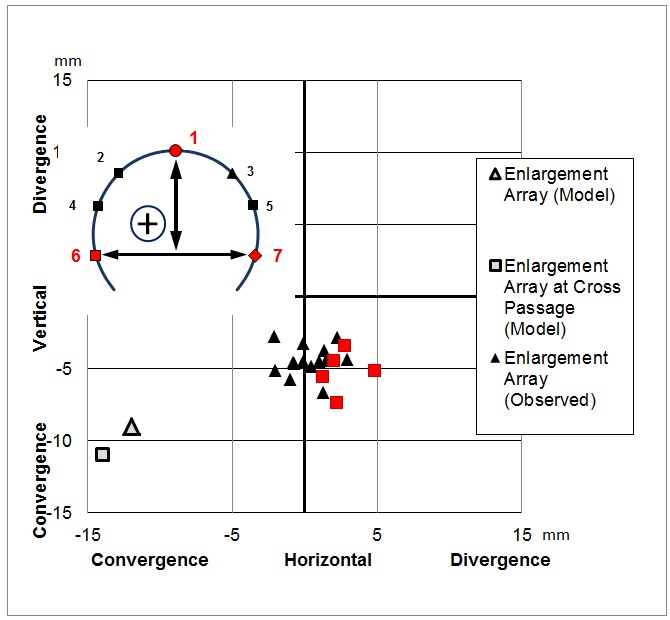
Figure 8 – PTW-W Enlargement. Comparison of predicted (modelled) horizontal and vertical convergence / divergence between point 1 (crown) and points 6 and 7 (below axis level). Posi-tive = divergence /elongation; negative = convergence / shortening. For vertical convergence the settlement of points 6 and 7 is averaged. Between chainage 9 and 212 fifteen monitoring arrays at 10.5 m diameter and five monitoring arrays in the larger 11.5 m sections have been analysed. Convergence has been calculated at the time when the displacements due to Enlargement excavation have been faded out. This period has been considered individually for every monitoring array.
Figures 7 and 8 provide a matrix where each monitoring array is represented by a marker which shows simultaneously horizontal and vertical convergence / divergence. These are displayed along with a larger marker representing the prediction.
Convergence 1 ↔ 4/5 (Figure 7)
The predicted vertical convergence is -2 mm (Ø 10.5 m) and -8 mm (Ø 11.5 m). The measured vertical convergence is in the range of -2 mm and -5 mm with no noticeable difference between the diameters.The predicted horizontal convergence is similar for both diameters: -12 mm and -14 mm. The measured horizontal convergence is in the range of +3 mm to -3 mm, with no noticeable difference between the two diameters. In average horizontal convergences are close to zero.
Convergence 1 ↔ 6/7 (Figure 8)
The predicted vertical convergence is -9 mm (Ø 10.5 m) and -11 mm (Ø 11.5 m). The measured vertical convergence is in the range of -3 mm and -7 mm with no noticeable difference between the diameters.The predicted horizontal convergence is similar for both diameters: -12 mm and -14 mm. The measured horizontal convergence is in the range of +5 mm to -2 mm. In general the measured scatter is larger as with points 1 ↔ 4/5 (Figure 7), however the larger Ø 11.5 m shows exclusively divergence.
Similar to the Pilot Tunnel it is obvious that the predicted convergence is higher than the actual measured, especially in the horizontal direction. The latter is most significant in the larger Ø 11.5 m which shows exclusively divergence instead of predicted convergence. Analogical, one possible cause is an overestimated load which had to be applied in the design. To reduce the large predicted horizontal convergences or even to turn those into divergence the horizontal load would need to be reduced. Simultaneously, the vertical load must be reduced as well to keep the vertical convergence at level as they are fairly similar to the measured.
Utilisation, Enlargement
Figure 9 shows the Utilisation on the longitudinal section of PTW-W Enlargement. Utilisation is mostly less than 20 %. That means the actual factor of safety is in general larger than 5.0. This result is in line with the small convergences shown in Figures 7 and 8. Even allowing for some additional load to cover long term effects as the lining will contribute to long term stability the actual factor of safety seems unnecessary high.
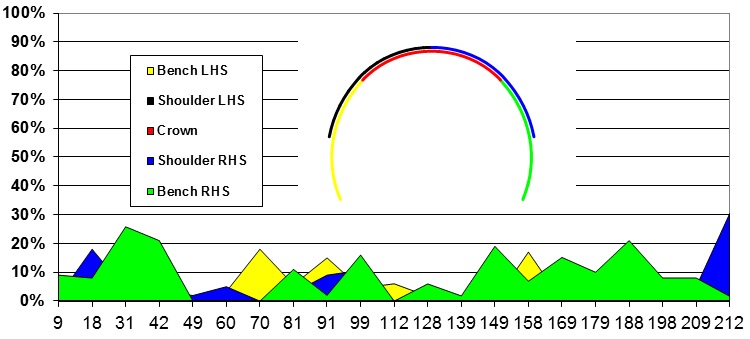
Figure 9 – Utilisation of PTW-W Enlargement Opening at Cross Passage 1a
At cross passages the larger diameter of the Platform Tunnel Westbound accommodated the increase of lining thickness by 325 mm following the completion of excavation. Due to the thickening the original inclined monitoring arrays were lost in these areas and replaced by three new vertical arrays: one array in the centre-line of the opening, and one array on either side. Of most interest was obviously the array in the centreline as this should be affected the most by the cross passage excavation. Figure 10 shows a schematically sketch of the cross passage opening for CP1a. Firstly CP1a Pilot Tunnel has been excavated followed by CP1a Enlargement. The vertical displacements of the monitoring point in the crown “1” are shown in Figure 11.
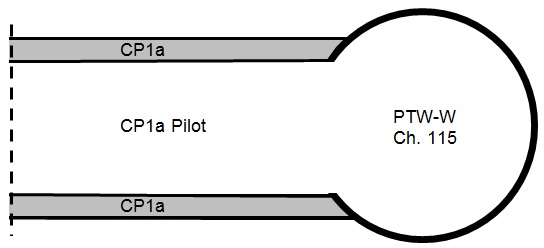
Figure 10 – Schematically sketch PTW-W with opening for CP1a Pilot Tunnel and Enlargement 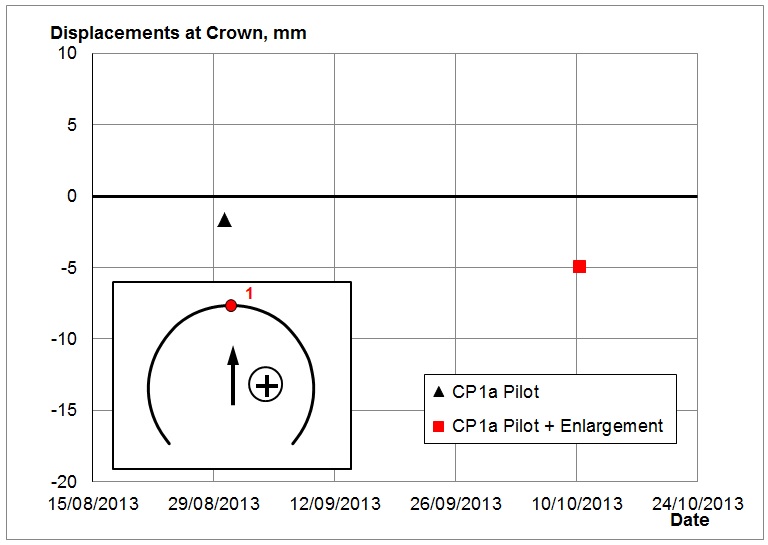
Figure 11 – PTW-W Enlargement Ch. 115. Vertical displacements of Crown due to excavation of CP1a Pilot and Enlargement. Positive sign (+) = heave; negative sign (-) = settlement. For a change, prediction did not provide absolute displacements but convergence between monitoring points at crown and invert. However, the levelling point at invert was very difficult to read and the obtained set of data is not sufficient to reliably measure the invert movement. It is known from other invert monitoring points within the Platform Tunnels that vertical movements usually were negligible. This is in line with the general observation of the reduction of settlement from crown towards invert, as visible in Figure 6. Extrapolation would lead to the conclusion that the vertical movement at invert is close to zero. Therefore, the assumption can be made that the displacements shown in Figure 11 are nearly identical with the convergence between crown and invert. The error is estimated to be ±1 mm, which is within monitoring accuracy.
CP1a Pilot Tunnel: The predicted vertical convergence is -6 mm. The measured settlement is less than -2 mm. Taking the uncertainty of the invert movement into account the as-built convergence is in the range of -1 mm to -3 mm.
CP1a Pilot Tunnel + Enlargement: The predicted vertical convergence is -12 mm. The measured settlement is -5 mm; including the uncertainty of the invert movement the as-built convergence is in range of -4 mm to -6 mm.
Horizontal convergences have not been considered as monitoring points could only be installed on one side due to the opening.
In conclusion, as-built convergence is assessed to be third to half of the predicted values. This is not unique to the CP1a opening but applies to the other cross passages as well.
Double Side wall drift (WHI Cavern Westbound)
Platform Tunnel Westbound merges into the Cavern Westbound which is part of the Vallance Road Crossover (Figure 1). The Cavern Westbound is trumpet shaped with a width of 10.4 m and a height of 10.9 m at the beginning and a width of 17.3 m and height of 14.0 m at the end. The total length is approximately 35 m. Cavern Westbound is one of the largest SCL tunnels ever built in London Clay.
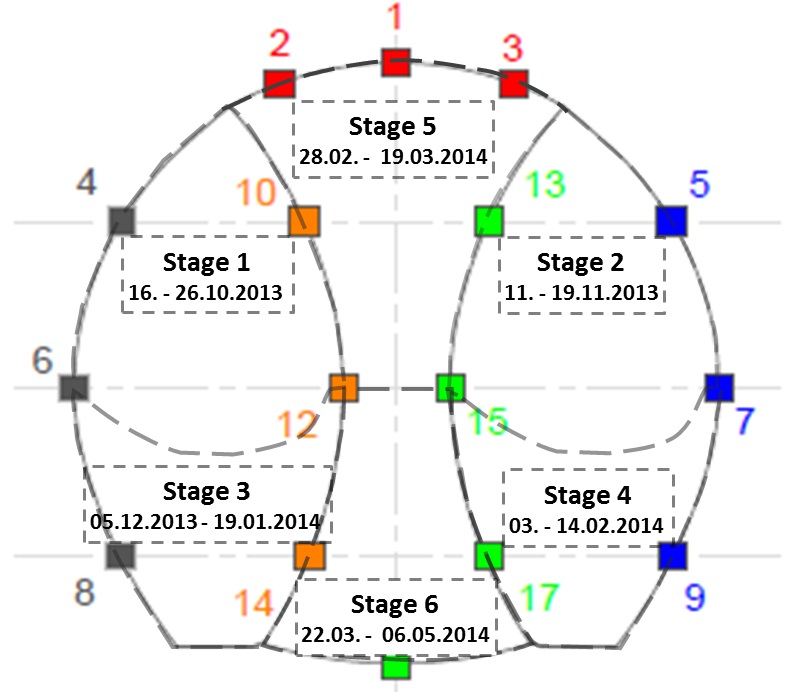
Figure 12 – WHI Cavern Westbound, excavation stages and time. Numbers and squares are monitoring points. Due to its size the cross section has been divided into double side wall drifts, centre drift and bench / invert drift. Excavation was done in six stages as schematically shown in Figure 12 starting with the top heading of the left side wall drift, followed by the top heading of the second side wall drift. Both top headings comprised a temporary invert. The left side wall drift has been enlarged to full height in stage 3 with subsequent enlargement of the second side wall drift. The centre drift was excavated in stage 5. Stage 6 included bench / invert drift and removal of the inner walls.
All single stages have been excavated to full length and a thickening has been applied before the start of the next stage. The lining was tapered towards the connections of inner and outer wall. The minimum thickness of the lining varied with the increasing size of the cavern: side wall drift’s outer walls at axis level were 525 mm to 600 mm; the inner walls were 400 mm; the crown of the centre drift was 725 mm to 800 mm.
Convergence, Cavern Westbound
Within Cavern Westbound three monitoring arrays have been installed out of which Ch. 242, in the middle of the cavern, provided the best set of data. At this location the cavern is approximately 14.2 m wide and 12.5 m high. Design provided displacement predictions as resulting vectors. Within this analysis these were split in horizontal and vertical displacements to be able to calculate convergence / divergence.
All six excavation stages have been analysed. The results of stages 1 and 5 are presented within this paper as they are considered to be representative (Figures 13 and 14). The analysis focuses on horizontal convergence as the results and conclusion in the vertical direction are the same.
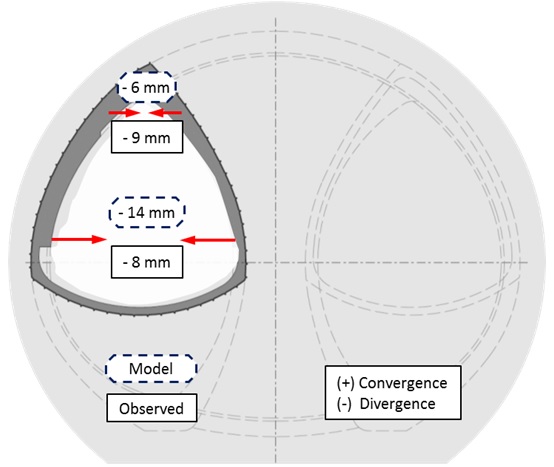
Figure 13 – WHI Cavern Westbound, Ch. 242. Stage 1. Comparison of predicted (modelled) horizontal convergence. Arrows are indicative only and not to scale. The results can be summarised as follows:
- Stage 1: the predicted vertical and horizontal displacements are significantly larger than the measured. This is reflected in the difference in horizontal convergences as shown in Figure 13.
- In general, the predicted displacements within a new excavation stage are larger than the ones observed. This applies to monitoring points 5, 7, 13, and 15 during excavation of Stage 2 (see Figure 12 for monitoring points); to points 8 and 14 during excavation of Stage 3; and to points 9 and 17 during excavation of Stage 4.
This result is in line with the analysis of PTW-W. It seems that the loads to be applied in the design are too high.
- In contrast to the previous statement: the predicted displacements in “old” stages are matching generally well with the measurement. This might be a result of the thick and stiff lining which keeps movements small, in theory and practice.
- Stage 5: also in contrast to the previous statement is that the prediction within the newly excavated centre drift matches surprisingly well with the measurement (Figure 14).
Predicted and measured convergence in the “old” stages are fairly small, in the range of 0 mm to 3 mm, which is barely larger than monitoring accuracy. Although it might be confusing that the horizontal convergence / divergence of the top headings of the side wall drifts show opposite directions for prediction and measurement they also are just within monitoring accuracy. The overall small displacements during Stage 5 may be as well a result of the thick and stiff lining.
The question may arise if convergences need to be restricted to an amount which is barely measurable?
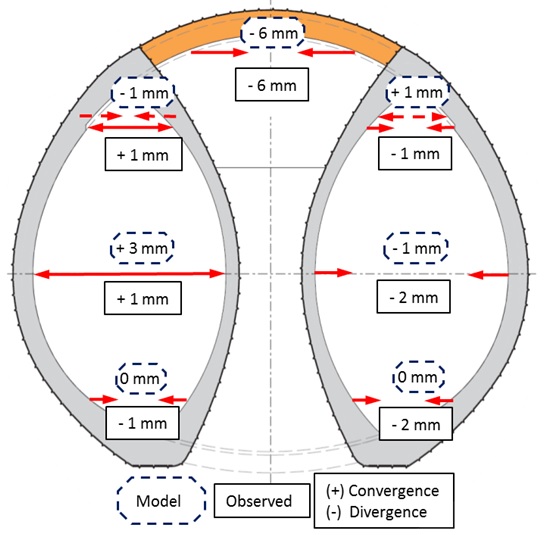
Figure 14 – WHI Cavern Westbound, Ch. 242. Stage 5. Comparison of predicted (modelled) horizontal convergence / divergence. Displacements of previous stages are not included. Arrows are indicative only and not to scale. Summary and conclusion
This analysis provides a comparison of the predicted and measured displacements during tunnelling. It focuses on the short term and direct influence until the displacements fade out due to the disappearing excavation face.
Absolute displacement, convergence, and Utilisation have been analysed by example of Whitechapel’s Platform Tunnel Westbound and the Cavern Westbound.
It turned out that predicted displacements mostly were significant larger than the measured, especially in the horizontal direction. The probable cause could be an overestimated horizontal load which had to be applied in the design. The Utilisation method proofs that the as-built factor of safety is not less than 4. Even allowing for some additional load to cover long term effects, as the Enlargement-lining will contribute to long term stability, the actual factor of safety seems unnecessary high. The authors see a large potential of design optimisation without compromising safety and stability if load assumptions would be amended to match in-situ displacements.
References
[1] Stärk, A. and Zachow, R (2015) Real time determination of the utilisation of a sprayed concrete lining during tunnelling. Crossrail Project: Infrastructure Design and Construction (Volume 2) – Black, Dodge and Lawrence (eds.) – ICE Publishing.
[2] Colace, A. and Stärk, A. (2015) Depressurisation and Surface settlement at Vallance Road Garden, Whitechapel. Crossrail Project: Infrastructure Design and Construction (Volume 2) – Black, Dodge and Lawrence (eds.) – ICE Publishing.
[3] Soler, R., Colace, A., Stärk, A, Zeiszig, W. and Roberts, T.O.L. (2016) In-tunnel depressurisation for SCL tunnels at Whitechapel and Liverpool Street stations Crossrail Project: Infrastructure Design and Construction (Volume 3) – Black, Dodge and Lawrence (eds.) – ICE Publishing.
[4] Eddie, C. and Neumann, C. (2003) LaserShell™ leads the way for SCL tunnels. Tunnels and Tunnelling, June 2003, 38 – 42.
[5] Eddie, C. and Neumann, C. (2004) Development of LaserShell™ Method of Tunneling. Proceedings of the North American Tunneling Conference 2004, Atlanta. Pub. Balkema, Rotterdam.
[6] Chapman, D., Metje, N. and Stärk, A. (2010) Introduction to Tunnel Construction. Applied Geomechanics Volume 3, Taylor & Francis Group, ISBN-9 780 415 468 428
[7] BBMV JV Crossrail C510 (Balfour Beatty, BeMo Tunnelling, Morgan Sindall, Vinci Construction Grands Projets) Monitoring data 2011 – 2015.
-
Authors

Dr Alfred Stärk Dipl Ing Dr Ing - BeMo Tunnelling
Dr Alfred Stärk is Chief Geotechnical Engineer and Engineering Manager at BBMV for Crossrail Contract 510 ‘Whitechapel and Liverpool Street Station Tunnels’ since March of 2011. He started his career at the University of Hanover, Germany, where he worked as assistant professor and consultant for 10 years. In 2002 he joined BeMo Tunnelling, Innsbruck, Austria. He now has 25 years of experience in large-scale tunnelling, mainly with sprayed concrete lining in soft ground.

