CAD Support Metrics
Document
type: Micro-report
Author:
Abderrahman Saod Kather Al-Shammery
Publication
Date: 09/07/2018
-
Read the full document
Introduction and Industry Context
The Crossrail CAD Services team was responsible for administering the Electronic CAD Management System (ECMS) used to directly manage the design CAD data. The technical management of the design data required to safely and efficiently complete the Crossrail project was a huge challenge.
The Crossrail ECMS consisted of over 70 separate contracts, plus third party design data, surveys and historical legacy data. The contracts accounted for over 600 daily active CAD users, accessing 1000’s of files each day, and often requiring interfacing with each other in a controlled and effective way. The total number of files within the ECMS grew to over 2 million. The CAD Services team received over 50 ProjectWise data and technical requests daily from Crossrail’s supply chain.
The CAD Services team aimed to resolve or close out all data requests within 24 hours. This was managed initially by distributing the calls into different categories and investigating all calls on a first come first serve basis, however, more complex technical requests often took longer than this, especially as the project neared construction completion with the growing complexity of the CAD data within the ECMS. The workload of the less complex calls was distributed across the team to allow the subject matter experts (SMEs) more time to investigate the more complex calls. This system has proved to be both efficient and effective.
The team also needed to be able to interrogate CAD usage across the project, to establish patterns and trends relieve issues and gain insight into contractor performance. To do this the optimum solution was to use the power of metrics.
How the Metrics Were Collected
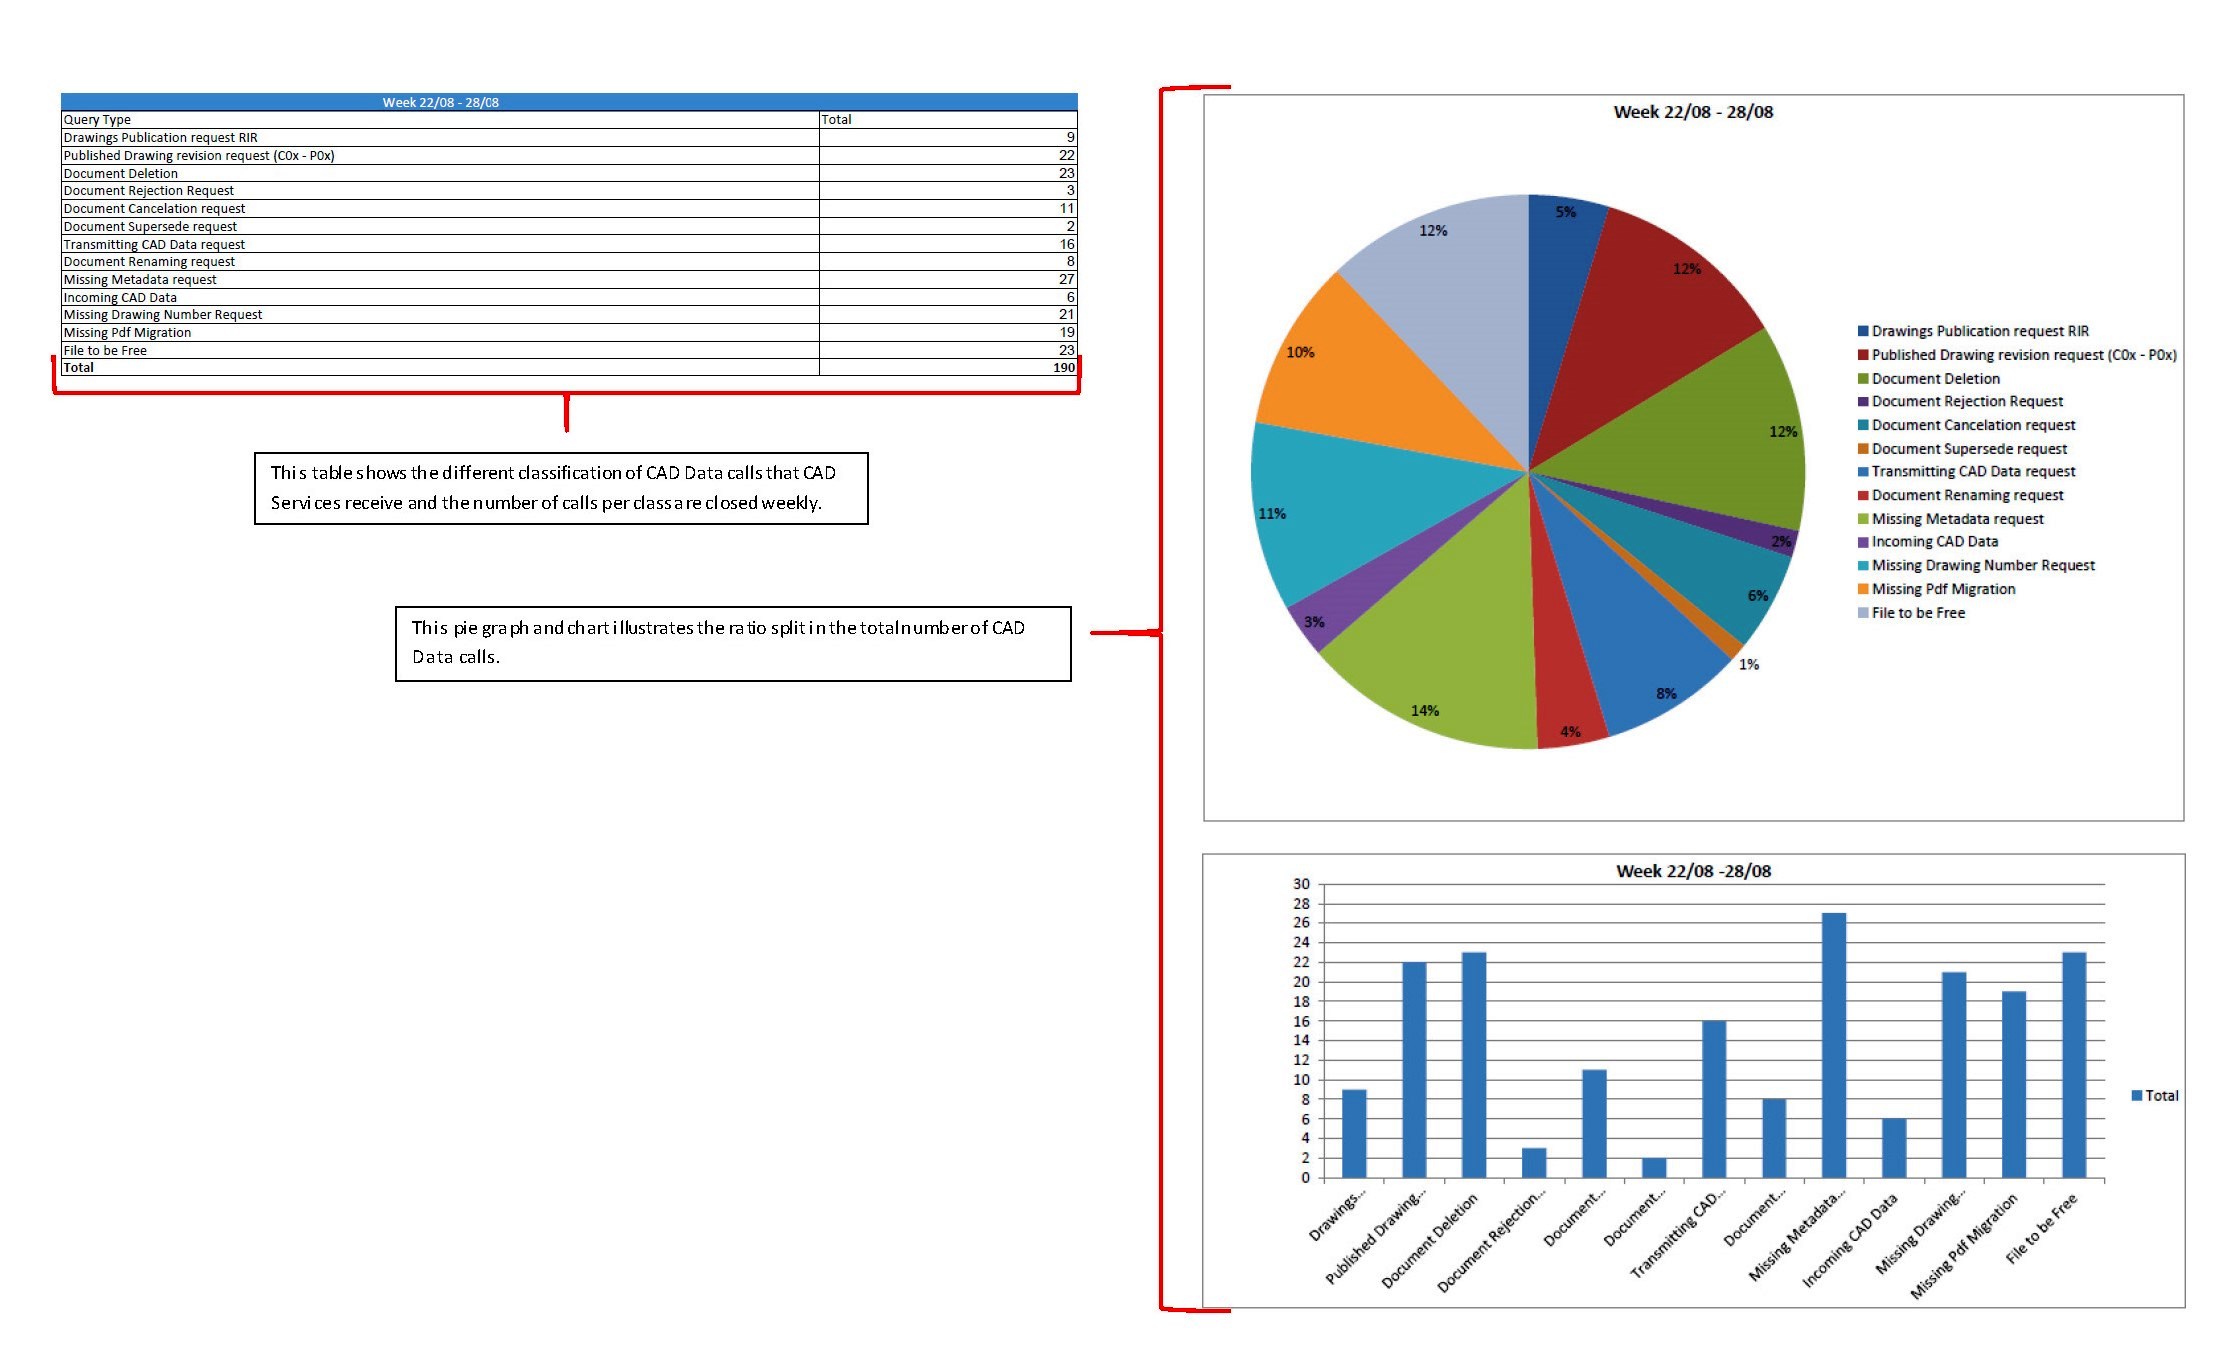
The CAD Services inbox is broken down into different folders of the categories of the calls received. These categories were identified as the basis of the metrics collected. Each call was categorised accordingly and scored separately by the team that actioned and closed the call. These categories range from Technical issues, Data, Management, System, Liaison and Production as shown in Figure 1

Figure 1 – Call categories based on folder system
After they’re closed, all emails are labelled with their contract reference and the score that the call has gained.
Scoring System
CAD Services use a points based scoring system where a call or request is assessed on the information that it includes. Each sub-team in CAD Services scores their request to the standard that they have set. Each call is scored based on the fulfilment of requirements that have been communicated by the CAD Services sub-teams to the contractor CAD teams across the project. These scores are then populated on to the metrics dashboard.
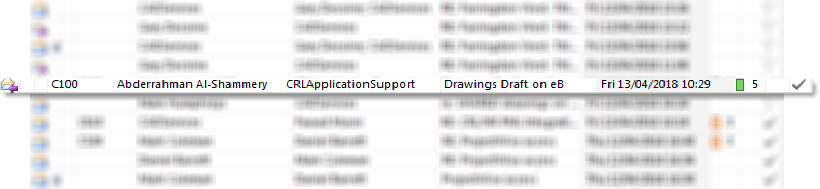
Figure 2– Snapshot of scoring system
It is a system based on achieving a score of 1-5 and the level is based on the definition shown below:
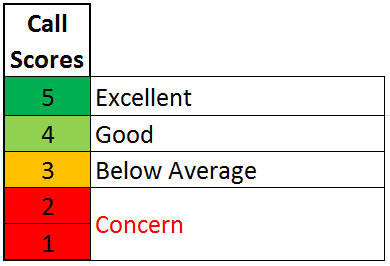
Figure 3 – Scoring Categories
The Dashboard
All data accumulated from the CAD Services inbox and from the CAD portal is manually populated onto a weekly dashboard.
The scoring system is split into three areas, technical, data and publication. This helps when assessing in which of the areas the Main contractor and their supply chain are lacking or exceeding in.
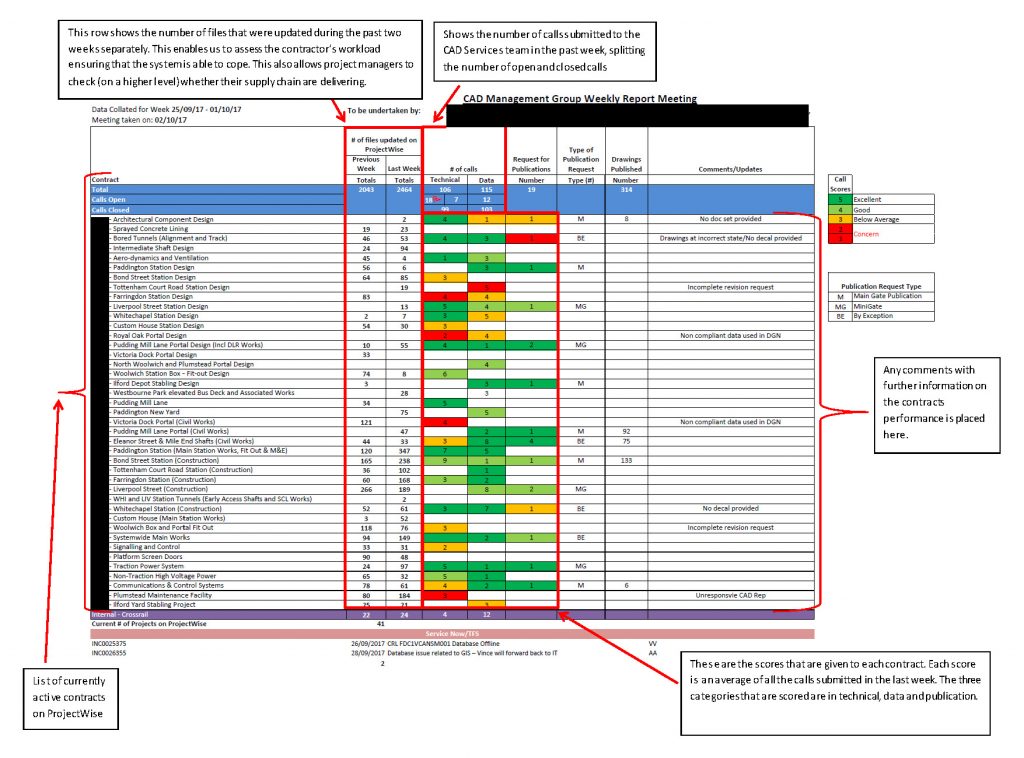
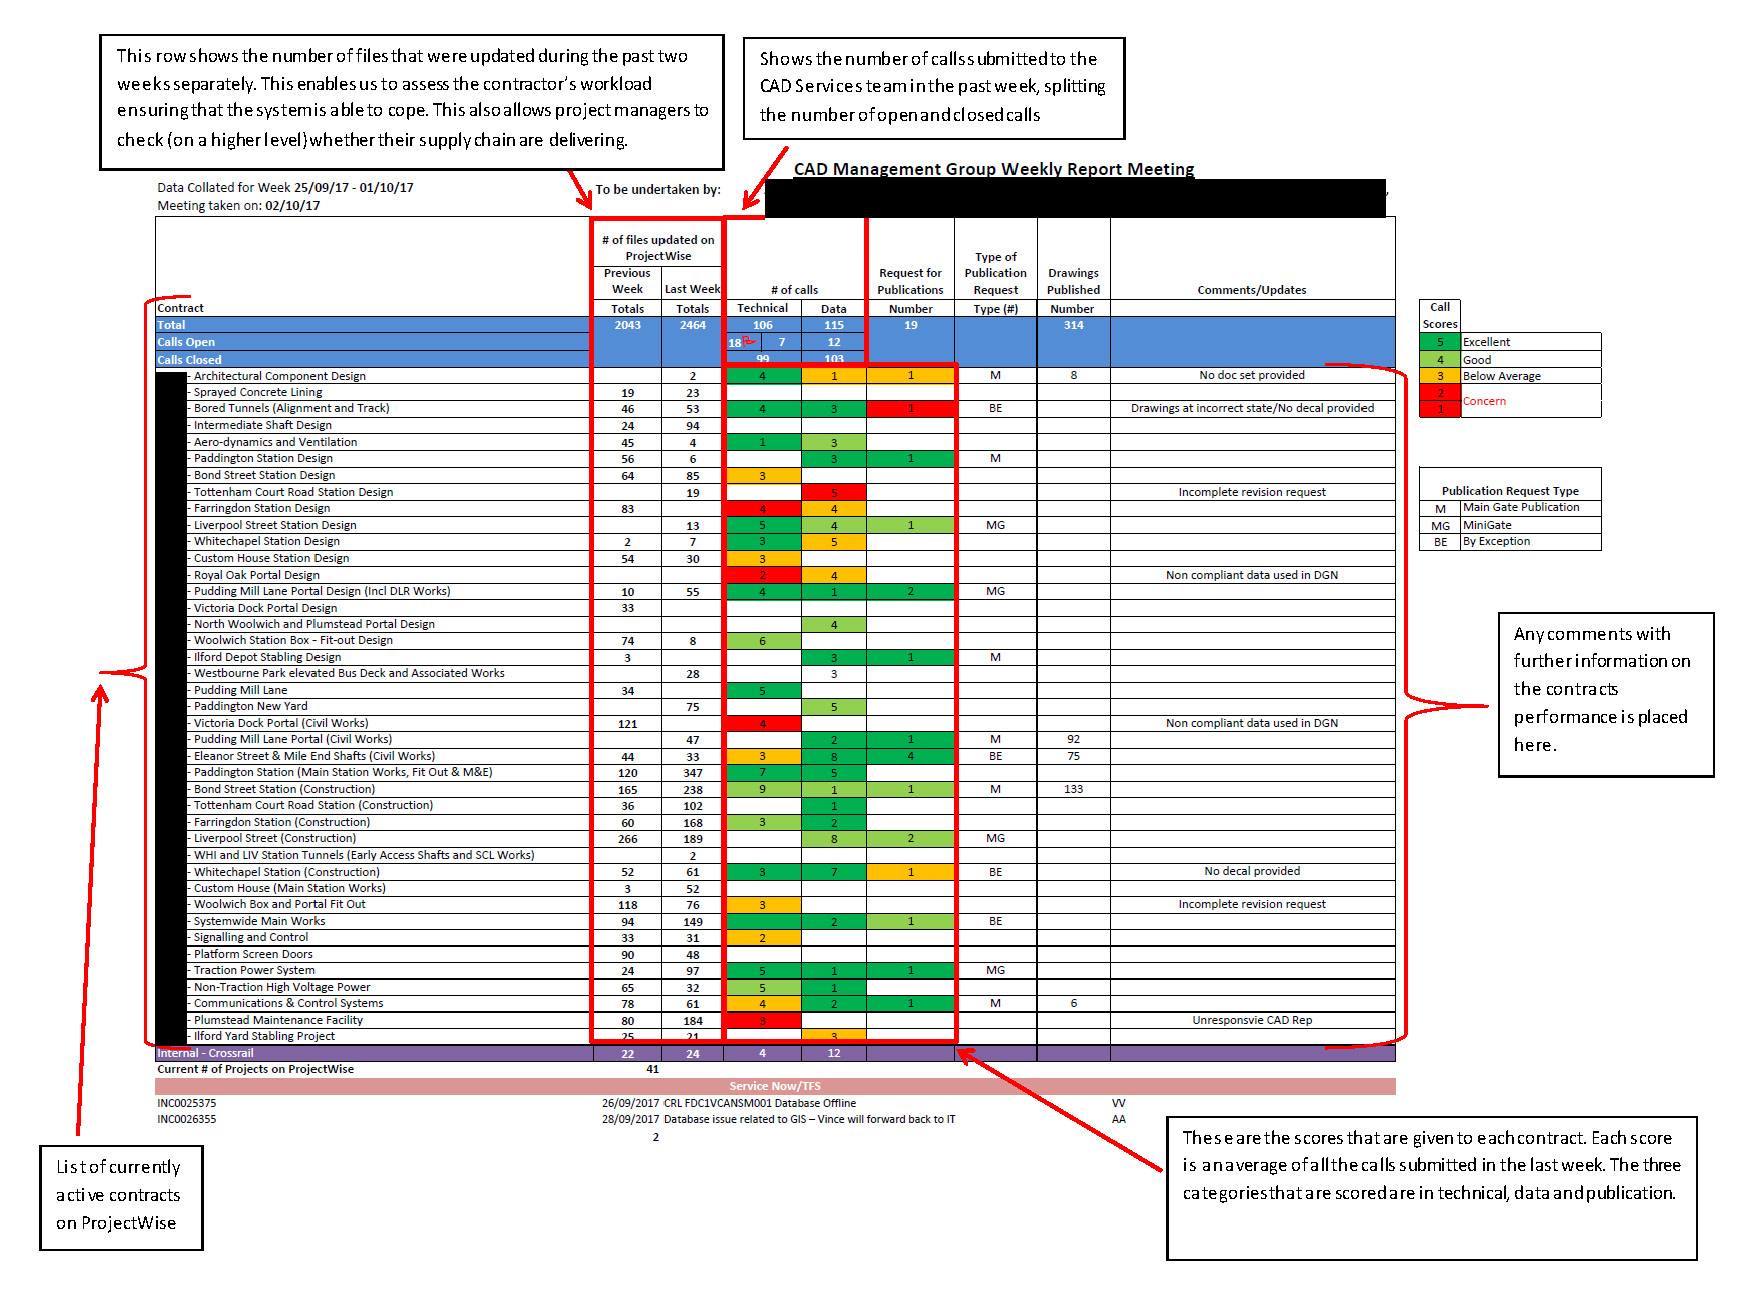
Figure 4– Sample dashboard
Figure 4 shows a sample dashboard. The dashboard shows the score that a contracts supply chain has averaged over the last week for all the technical calls and data calls that they have submitted. In the above example the gaps show the contracts that haven’t submitted a call during that particular week. Where the gaps in the ‘of files updated on ProjectWise’ columns are blank there would have been no updated files in during the last two weeks.
The publication requests are the actual numbers requested. The scoring system allows us to filter the contracts that are in a low scoring position such as a 1 or 2. A score of 3 is below average and will also be included in any advisory communication with the project manager advising them of their supply chain’s performance.
We also use the scoring system to appraise the contracts that are doing well and praise them accordingly.
The dashboard is used for weekly team meetings to discuss any outstanding problematic issues. It allows a direct view to the contracts that are submitting calls incorrectly and/or with missing information and to those that are submitting calls correctly with all the required information. This allows us to feed back performance information to the CAD Representatives and Project Managers. This is done through meetings with the sub-CAD Liaison team that arrange meetings with contractors to discuss raised issues with regards to the quality of calls/requests. The CAD Liaison team also arrange training sessions for the contracts that require further training. These training sessions include presentations, Q&A sessions with the SMEs, and the detailing items within the CAD Representative handbook. The CAD Rep Handbook is the CAD users bible as it includes a step by step guide on how to access, use and work within the Crossrail ECMS.
The dashboard also gives us an opportunity to highlight any system configuration issues within the ECMS that need to be investigated. This is done by looking at the trend of the different types of calls that are received and identifies any unusually high numbers of calls that could flag an issue.
The metrics can also be used to analyse the number of files that have been updated by each contract. This helps identify the contracts that are putting the most pressure on the ECMS. By looking at the number and types of calls received from the contracts a better understanding can be gained of any system configuration issues that are caused by the pressure.
The dashboard also shows how many publication requests were sent to CAD Services in the last week and the quality and fulfilment of the request is also scored by CAD services.
The ‘Requests for Publication’ column shows the number of publication requests (in digits) that have been received per contract and the average score that the contracts have gained for that week is identified through the coloured cells. The blank cells show the contracts that have no submitted pubcliation requests for that particular week.CAD Services Web Portal
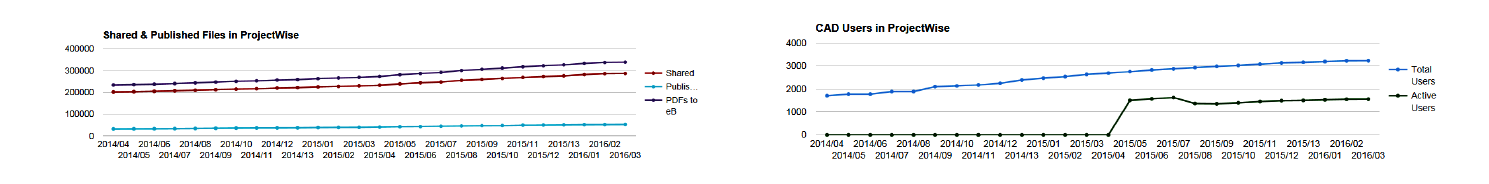
Figure 5 below shows the additional information captured via the CAD web portal
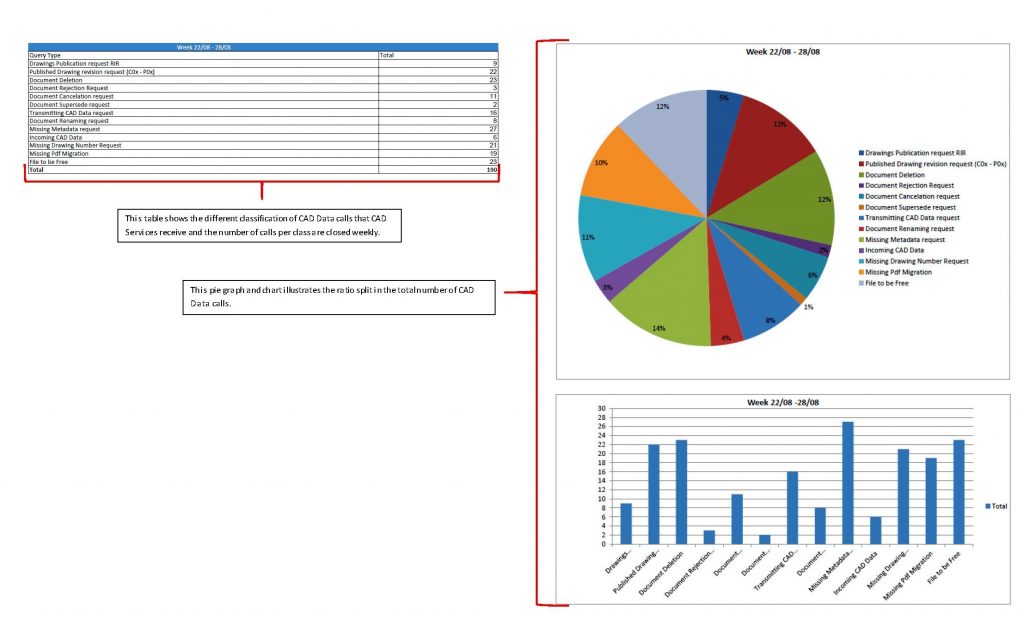

Figure 5 – Additional Web Portal Metrics
These are automated metrics collected and illustrated on the CAD Services WEB portal. A link has been built between the back end of ProjectWise and the CAD WEB portal. This has allowed us to create metrics that are autonomous that can be used to analyse live contract workload and activity. Through these metrics we can, not only identify the number of files that are being updated, but also the status that these files are being progressed to whether to be shared for information or to be published for onsite construction use. These metrics show data such as user productivity, CAD Rep permission changes, individual workflow activity, and user login times. We’ve also been able to monitor the server’s activity and login times through these metrics. This information can be used to gain a better understanding of the workload that each of the 2 production data sources have to manage, to ensure that neither are being overworked. This helps us avoid system configuration issues and downtime.
Benefits of CAD Metrics
With the huge amount of file creation/editing/interface, it would be impossible to effectively interrogate CAD transactions without the use of metrics. The CAD Services portal metrics allows us a snap shot in real-time of the health of the CAD data within ProjectWise, as well as quickly highlighting any issues that contractors are having. We are able to then adapt and improve the ECMS functionality for a better contractor experience, as well as finding ways to more efficiently administer it.
Lessons and Recommendations
The Crossrail CAD Services team has been constantly reshaped to fulfil the demands of the business. This hasn’t always played in favour of the team when a certain resource was required. Data and metrics were always available long before the CAD Portal was introduced. The ProjectWise database did have the ability to produce metrics and analytical data reports but it was only a skilled few who had the ability to produce reports through SQL Developer. The business may have benefited if they had invested in an SQL Developer earlier in the project. This would have enabled the back end of the ProjectWise database to be transformed into a user friendly web page for all members of the CAD Team and Crossrail employees and contractors to access and easily run reports. The key lessons learned identified were:
- An automated collation of scoring and email traffic. It would have been more beneficial if the dashboard was linked directly to the mail server where an email would be sent to whom it may concern informing them of any irregularities within ProjectWise. This automated system couldn’t have been implemented due to the lack of resources.
- It would have been better if the request forms on the CAD Portal were used for all the different CAD requests as then an automated system would be used to collect and populate the data. This would reduce misinformation within requests and the information wouldn’t have to be collated manually form by form.
- It would have been more beneficial if this dashboard was published on the Crossrail intranet for it to be analysed by anyone involved in the design process of a contract. This would have helped the individual understand the supply chain’s strengths and weaknesses within the CAD Environment.
- This experience has proved that communication with the hierarchy of a contract such as the project managers and project engineers is vital to ensure that reviews and feedback on the contracts performance is always transferred.
- It is vital to create a three point link between the Client’s CAD team, a contract’s hierarchy and their supply chain.
-
Document Links
-
Authors

Abderrahman Saod Kather Al-Shammery - Crossrail Ltd
Abderrahman Al-Shammery is the CAD Systems Coordinator for Crossrail and is responsible for coordinating, investigating and resolving technical issues/queries regarding the client’s Electronic CAD Management System (ECMS). During his time at Crossrail Abderrahman qualified as BQF Practitioner.
Prior to Crossrail Abderrahman worked at Kelly Communications Ltd in a more commercial role involving (but not limited to) Quantity take-offs, supply chain payroll and tender preparation.
He was also involved in construction projects abroad such as the South Al-Mutlaa City in Kuwait which on completion will include around 30,000 new housing units. His involvement included contract administration, client/contractor liaison and supply chain payroll.