Cast in-situ Cross Passages: Thermal Stress Assessment
Document
type: Technical Paper
Author:
Agnieszka Mazurkiewicz, ICE Publishing
Publication
Date: 31/08/2016
-
Read the full document
1 Abstract
The C310 Thames Tunnel comprises twin 2.72km long bored tunnels between North Woolwich and Plumstead Portal. Four cast in-situ cross passages link the tunnel drives and the junction between the running tunnels and cross passage linings are made by RC collars cast in-situ on the primary sprayed concrete lining (SCL). Since the collars are regarded as thick concrete elements there was a risk of early-age cracking due to high hydration temperature and thermal calculations based on CIRIA C660 and 2D numerical modelling were carried out to provide predictions on the collar performance. Additionally, a series of thermocouples were installed on site to register the actual temperature developed in the collars during first 28 days after casting.
Thus, this paper seeks to compare the design of the early-age concrete approach with on-site assessment results from the installation of the thermocouples in the cross passage collars, and to make recommendations on the design assumptions and on-site operations to be undertaken in the future.
2 Scope of work Introduction
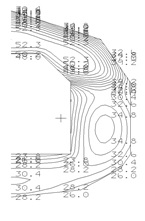
This paper summarises both design and on-site thermal assessment of the early-age concrete performance carried out in Contract 310 Thames Tunnels. The scope focuses on the RC collars of cross passages 16 and 17 located between Woolwich Station and North Woolwich portal as shown in Figure 2:1.
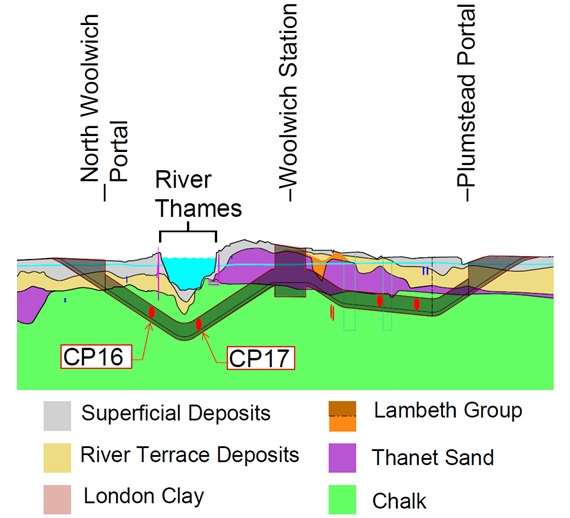
Figure 2:1 (i) – Geological profile of Thames Tunnels. Cross passages 16 and 17 where the thermal monitoring was carried out are highlighted in black 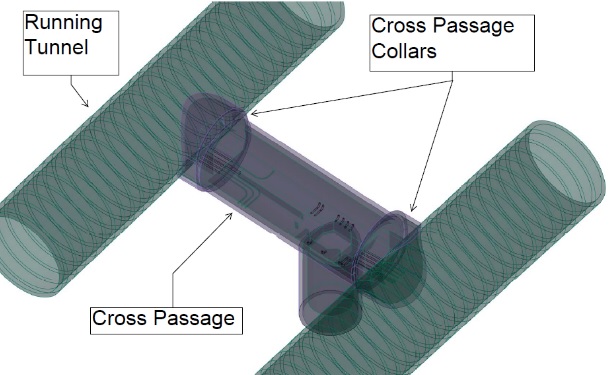
Figure 2:1 (ii) – Schematic view on the cross passage alignment 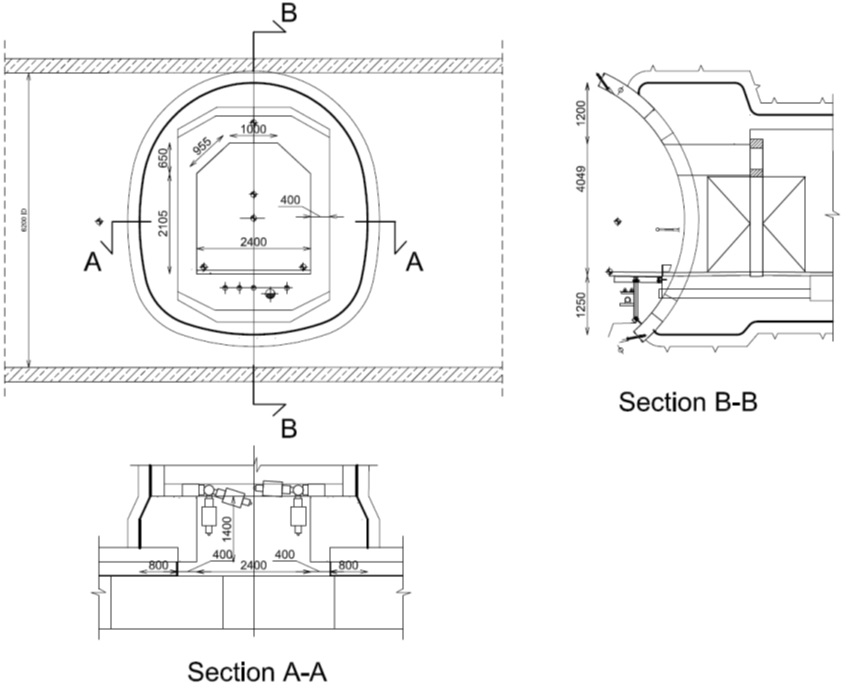
Figure 2:2 (iii) – Cross passage geometry: plan and sections 3 Scope of work
Findings of the thermal stress assessment have been presented in detail in “Crossrail Innovate18: Cast in-situ Cross Passages – Thermal Stress Assessment” report. Its scope covered comparison between the thermal calculations and on-site temperature monitoring. The calculations based on CIRIA C660 were correlated with the thermocouple readings allowing verification of the design assumptions. Then, the Finite Element analysis was carried out to correlate the temperature with the actual stresses induced in the concrete. The FE model simulated the actual sequence of the collar construction. Finally, the results of FE analysis were compared with both CIRIA C660 findings and on-site assessment leading to estimation of the actual thermal stresses in the concrete. Figure 3:1 highlights the methodology of the thermal analysis.
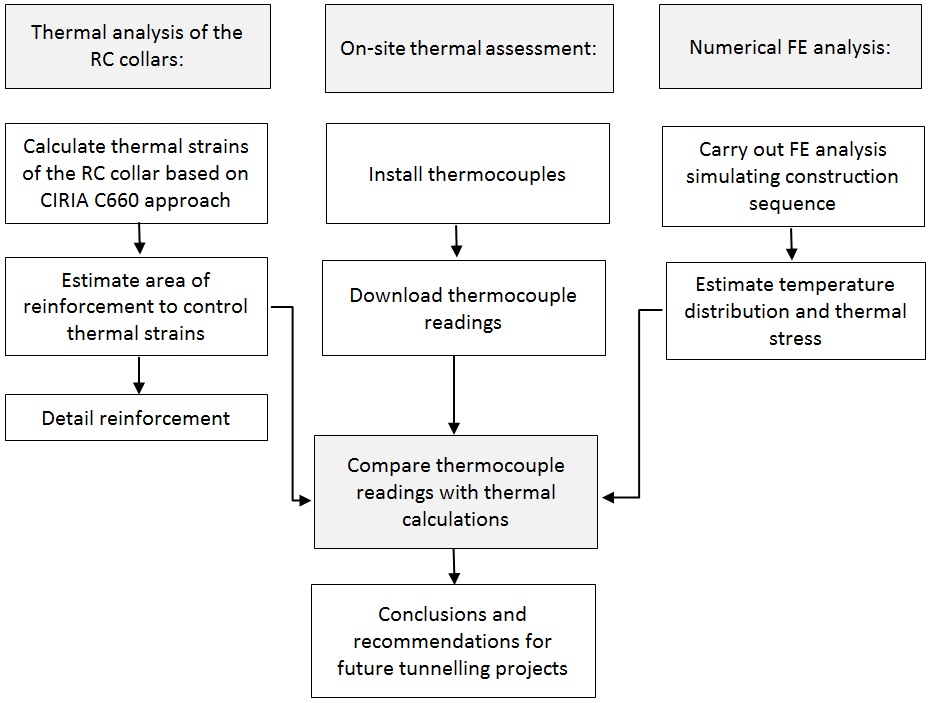
Figure 3:1 – Methodology of thermal analysis 4 Concrete mix parameters
In order to understand the early age concrete behaviour it is essential to refer to the concrete mix parameters. In this particular case, the concrete mix was designed especially for the underground environment. Thus, it featured reduced cement content including PFA addition in order to minimise hydration temperature and risk of early age cracks. Table 4‑1 outlines the concrete mix key parameters and their impact on the concrete curing process.
Description C32/40 M380 W45 + Fires@2kg + SP 10mm Aggregate Cement Type CIIB-V + SR Target Slump S4 Content Notes / Comments Binder CEM I
52.5 N
280 kg/m3 – “N” cement type refers to normal early strength
– Portland cement hydration temperature rises roughly 12-13C per 100kg/m3.
– dry blend of Portland + fly ash initial setting time > 45min
PFA 120 kg/m3 – by-product of high-temperature processes of coal power stations
– Slower concrete curing
– Reduced early heat of hydration results in slower early age strength development.
– Reduces hydration temperature better than GGBS. It is partly related to the application time: fly ash is inert a few days before casting whereas GGBS just a few hours before hand.
Aggregate 0/2 FP Sand 129 kg/m3 – aggregate type has a significant effect on εctu through its influence on the elastic modulus of the concrete
– The fine and coarse aggregates generally occupy 60% to 75% of the concrete volume (70% to 85% by mass)
0/4 MP Sand 734 kg/m3 04/10 Limestone 934 kg/m3 Admixture SPLAS
CSP340
3000 ml/m3 – Superplasticising admixture to reduce water and increase workability
– Reduce bleeding
– Produce cohesive workable concrete at high slump
Polypropylene Fibres PP FIB 2 kg/m3 – Fire protection as increase resistance to explosive spalling
– Increase cohesion
– Reduces settlements and bleeding
– Increase durability
– 12mm-long fibres
Retarder MR800 800 ml/m3 – Control set retardation
– Contain phosphates to temporarily halt cement hydration
– Produces cohesive workable mix
W/C 0.41 – Increased durability when low w/c (i.e. below 0.45) Aggregate/
Cement ratio4.49% – Coarse aggregates affect the coefficient of thermal expansion and its final limited differential temperature Chloride
Content % by
weight of Cement %0.12 – Represents the sum of the chloride content of all constituents (water, aggregates, cement, admixtures, etc.)
– Low ratio < 0.4
– The chloride content is below the specified limit C0.4 based on BS EN 206/BS 8500.
Alkali 2.20 kg/m3 – Refers to the total amount of alkali in all constituents Fines 48% – Refers to the ratio of the total amount of fine aggregate (0/4) to the total amount of aggregates which characterises the ability of concrete for easy compaction.
– The lower fine content the better concrete features of placement, pumping, more cohesive mix aiming for self-compacting, and reduced segregation.
Table 4‑1 – Concrete Mix parameters
4.1 Thermal stresses
The growth of early age concrete thermal stress is directly linked to the mechanical behaviour of the young concrete as was presented in M.Emborg’s publication (Ref. 2). It refereed to an experiment of casting a fully restrained concrete member and measuring the thermal stresses in laboratory tests. The experiment assumed a 0.7m-thick wall cast against stiff restraints along its top and bottom edges. Hence, the uniaxial stress was assumed. The developed stress-time curve is shown in Figure 4:1. The following stages should be considered:
- Stage 1: Plastic: Within first couple of hours concrete is fully plastic and no assessable stresses occur.
- Stage 2: Compression: After the plastic stage, the temperature increases rapidly leading to compression up to the moment when the highest temperature is reached. However, the compressive stress is relaxed due to young concrete high creep disposition.
- Stage 3: Tension: Afterwards, the temperature starts falling resulting in relaxation and de-loading to zero-stress. As the cooling proceeds the tension grows up to the point when the tensile resistance is reached and cracks form.
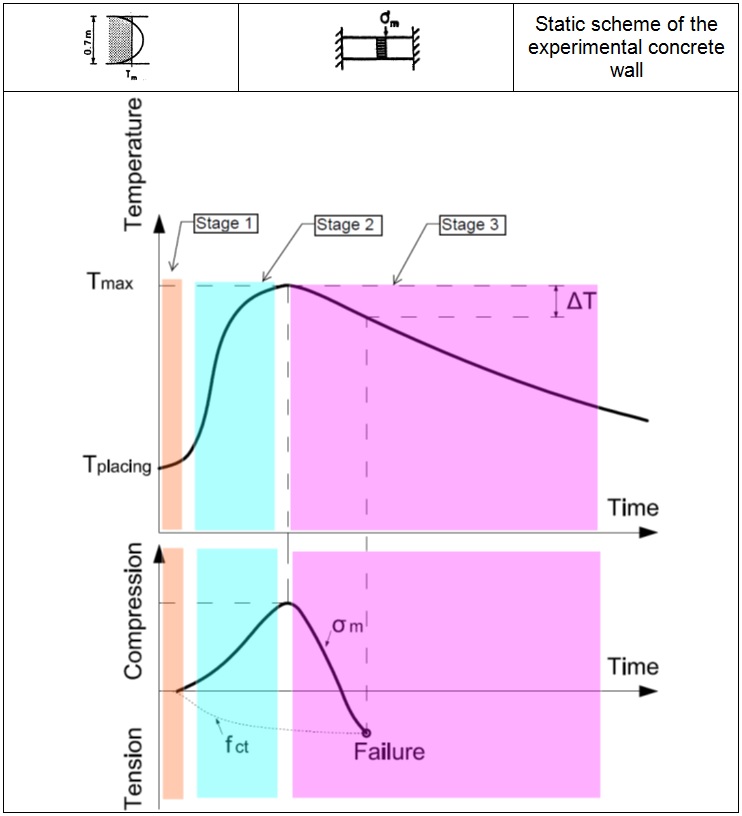
Figure 4:1 – Correlation between thermal stress and temperature growth derived in laboratory test as stated in Emborg’s publication (Ref. 2) 4.2 Voids between new and old concrete
During concreting the adjacent concrete expands due to high hydration temperature and deform the young concrete. As the temperature drops the new concrete contracts and the old concrete reduces its volume to its original shape causing voids along the interfaces as shown in Figure 5:1. It is critical for the concrete durability to fill the voids by grouting the re-groutable tubes installed along the interface, in this case, along the cross passage collar external perimeter.
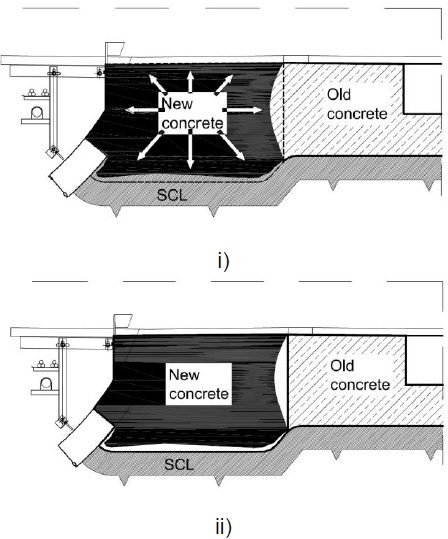
Figure 5:1 – The mechanism of void formation between the new and existing concrete i) At peak temperature of the new pour the heat is absorbed by the adjacent concrete causing its expansion towards the new soft concrete; ii) When temperature decreases the new concrete consolidates and the old concrete gets back to its original profile leaving the voids along the interfaces. 5 On-site thermal assessment
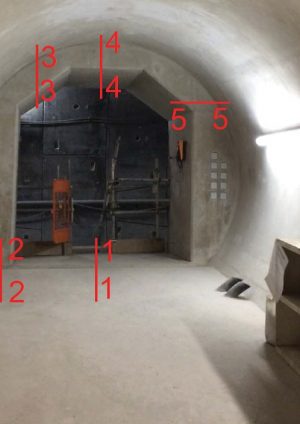
As shown in Figure 6:1 the construction sequence of the CP collars considered three pours and each of them housed 9 loggers. The thermocouple layout of a 3×3 matrix was based on the assumption that the collars deformed as thick internally and externally restrained concrete mass and therefore, the parabolic temperature distribution was predicted.
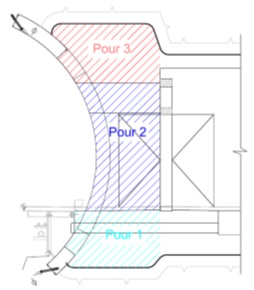
Figure 6:1 i) – Cross section showing construction stages (Pours 1, 2, and 3), 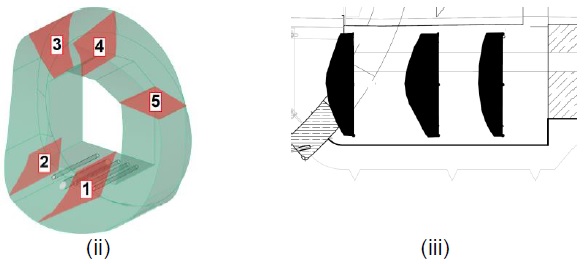
Figure 6:1 (ii) – CP schematic view with monitored sections; (iii) Expected temperature development in Pour 1 5.1 Temperature comparison between the thermocouple readings and CIRIA C660 estimation
Detailed calculations of CIRIA C660 are presented in “Crossrail Innovate18: Cast in-situ Cross Passages – Thermal Stress Assessment” report.
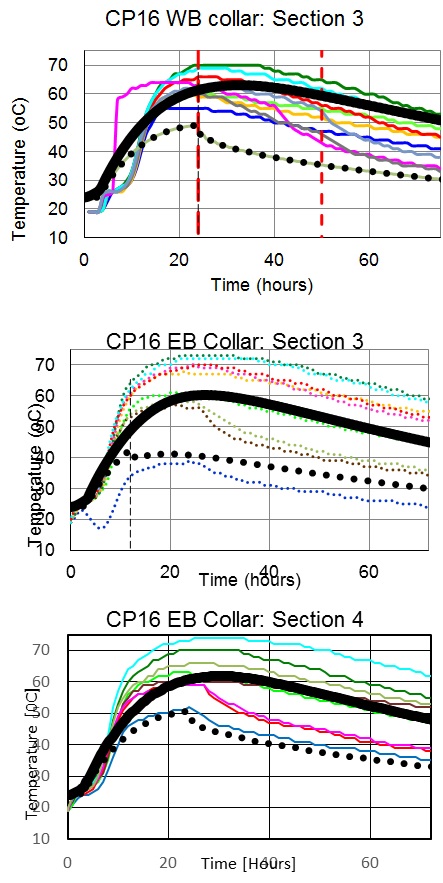
Apart from cooling down which was faster on site than calculated, CIRIA C660 results matched the thermocouple readings in a sense of reaching similar peak temperatures as shown in Figure 6:2, Figure 6:3, and Figure 6:4. The section layout is presented in Figure 6:2.
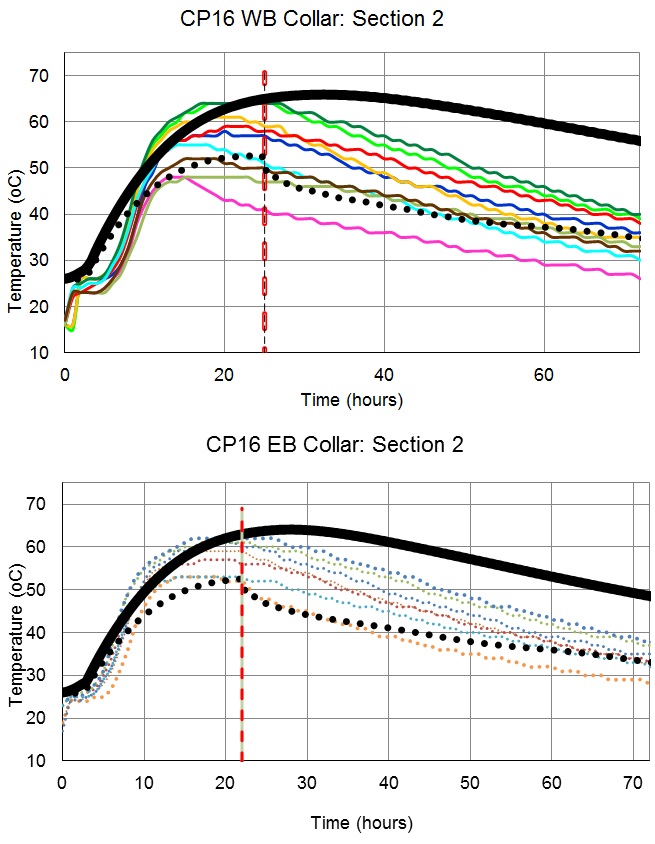
Unlike in Section 1, Section 2 was isolated by the SCL and the segments (i.e. cast in the “pocket”), hence the peak temperature was lower than designed and sustained for longer. In other words, Section 2 could be classified as the internally restrained element whereas Section 1 was considered as a combination of internally and externally restrained element (i.e. laterally and longitudinally).
In Section 1 the top surface was constantly cooled down by the cold air from the running tunnels. So, the ambient temperature in Section 1 was lower than in Section 2 which affected the rage of the differential temperatures and may cause cracking between Sections 1 and 2 (valid especially for wider cross passages). Knowing that the peak temperatures correspond with the maximum compressive stress, the high compression sustained for longer in Section 2 than in Section 1. As a result, the compression on one side (i.e. Section 2) and tension in the middle (i.e. Section 1) may result in cracking what should be controlled by providing the thermal reinforcement between Sections 1 and 2.
In reference to Section 3 located in the top part of the collar (i.e. lintel), CIRIA calulations underestimated the max hydration temperatures. Even though the member geometry was similar to Section 1 the peak values were much higher. Since the section is located in top part of the cross passage, it is understood that that the hot air built up by the concrete surface which increased ambient temperature.
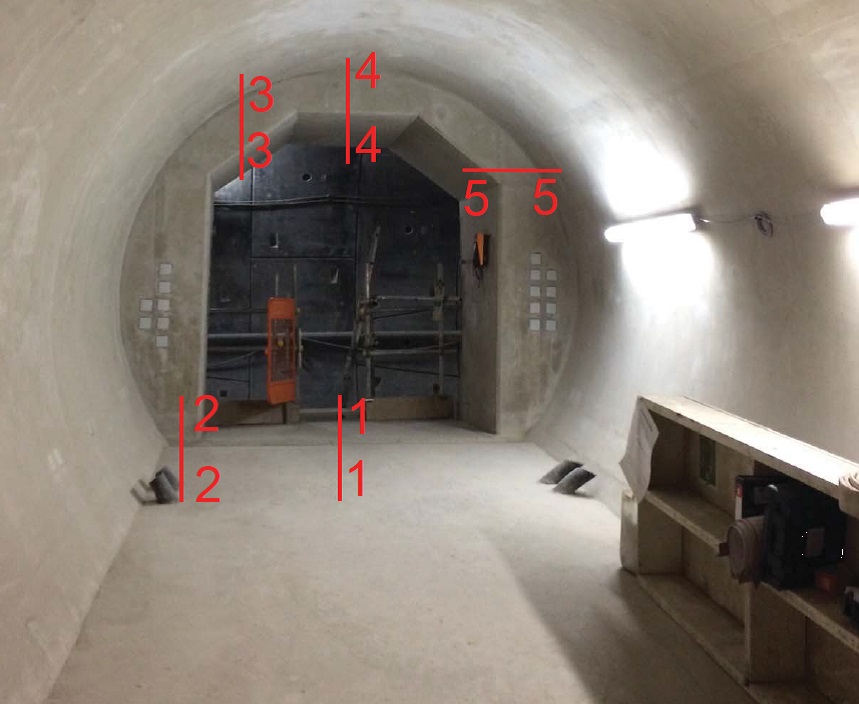
Figure 6:2 – CP elevation with monitored sections 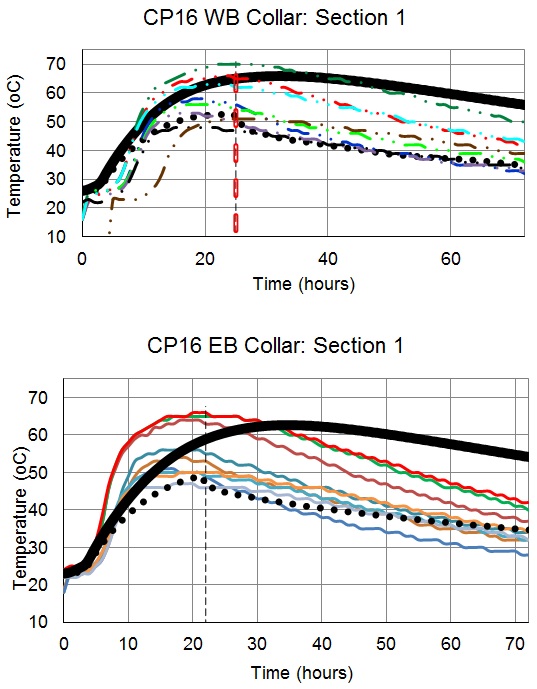
 CIRIA C660 Peak Temperature
 CIRIA C660 Surface Temperature
 On-site assessment readings
WB collar:
It can be concluded that the temeperature measured on site corresponded with the CIRIA C660 design. The actual maximum temperature recorded (in the section centre) by the thermocuples was only 50C higher than designed. Regardless the fact that the temperature loss in the core was faster than predicted, the estiamtion of the surface termperature well corresponded with the thermocouple readings by the SCL (i.e. lowest temperature). Also, in the cooling phase, the temperature drop along all surfaces (except the section centre) matched the design.
Summing up, regardles the fact that in the heating phase the design and on-site assessment matched the cooling rate was faster on site than deisgned.
EB collar:
Unlike in the WB collar, the design max temperauture did not correspond with the on-site assessment despite similar casting parameters (i.e. concrete mix, placing temperature etc.). It should be highlighted that in principle the concrete heating and cooling phases were faster than designed.Figure 6:3 – Temperature comparison: Section 1
 CIRIA C660 Peak TemperatureCIRIA C660 Surface TemperatureOn-site assessment readings
WB and EB collars:
In both WB and EB sections the maximum tempearature measured on site was approx. 50C lower than designed and was reached approx. 10 hours sooner than calculated. The lowest reading was below the estimated values and also, the actual cooling rate was faster on site than predicted.
Summing up, CIRIA temperature curves did not match the on site termal assessment.Figure 6:4 – Temperature comparison: Section 2
 CIRIA C660 Peak TemperatureCIRIA C660 Surface TemperatureOn-site assessment readings
In the last pour (i.e. lintel) the thermal monitoring showed that both the peak and surface temperatures exceeded the design by approx. 100C and sustained for more than 15 hours. The concrete cooling rate matched the design even tough the formwork was removed in two stages which has not been considered in the CIRIA design.
One-stage only shutter removal (i.e. marked by dotted vertical lines) was considered in CIRIA calculations.Figure 6:5 – Temperature comparison: Sections 3 and 4
5.1.1 Differential temperatures
The purpose of the differential temperature comparison aimed to identify zones where the risk of cracking was high. They depend on the thermal diffusivity of the concrete; surface conditions, in particular formwork types and removal time.
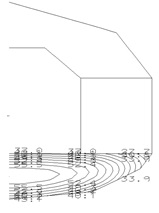
In general, the concrete cooled faster than expected. As shown in Figure 5:7 the differential temperatures between loggers 5-1, 5-7 and 5-9 exceeded 200C regarded as a cracking threshold for the limestone concrete.
Considering the differential temperature as the critical factor of concrete cracking is a reasonable approach for slabs and wall where the thermal stress along one direction dominates. However, in the CP collars there is no dominating stress plane due to its robust geometry (short and thick) hence, this problem is three-directional.
Having said that, the differential temperature exceeding 200C (i.e. 2D problem) does not necessary indicate cracking and a 3D analysis would enable to identify whether or not the cracks formed.
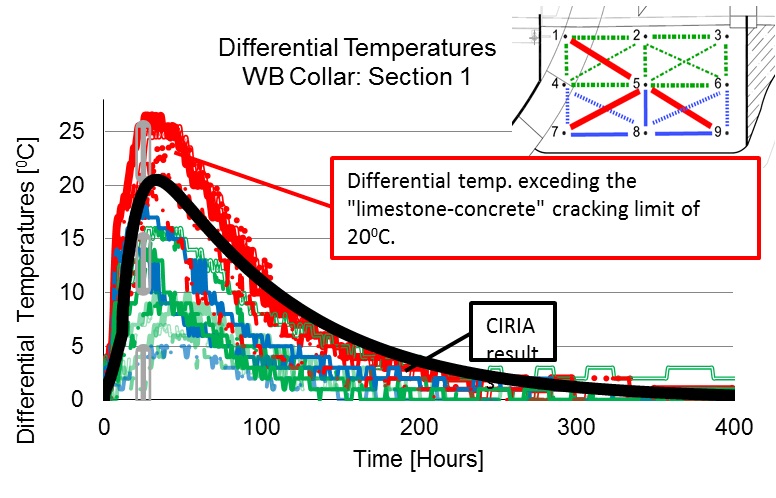
Figure 6:6 – Differential temperatures: WB Section 1 Figure 6:7 refers to the differential temperatures recorded in the WB collar Section 2. In general, the readings were below the given cracking threshold of 200C except for the readings between the loggers 5 and 7. Regardless the peak and surface on-site readings matched the CIRIA estimation (presented in Figure 6:3) the cooling down rate was faster than expected. It may be related to the fact that Section 2 was cast in the well isolated “pocket” hence small differential temperatures were expected.
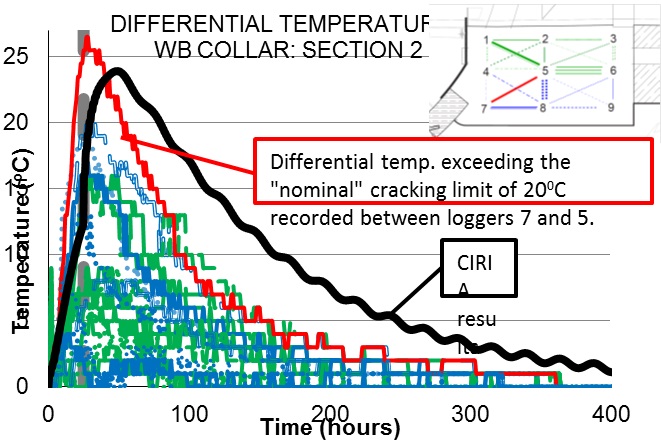
Figure 6:7 – Differential Temperatures: Section 2 6 Finite Element (FE) analysis
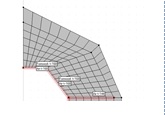
The main purpose of the FE analysis aimed to derive a correlation between the temperature and stress described in M.Emborg’s publication (see Figure 4:1). The numerical models A and B reflected the actual RC collar geometry, material properties and boundary conditions. Figure 7:2 outlines the key analysis assumptions.
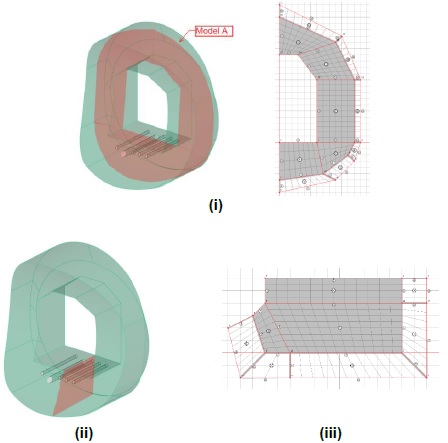
Figure 7:1 (i) – Schematic view on the overall section through the collar and its FE representation (Model A); (ii) Schematic view on the collar sections through the sill ii) FE model of the sill (Model B) In-put data 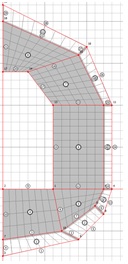
Symmetrical
model
The collar geometry has one vertical axis of symmetry so its reactions and internal forces are identical in both parts. Hence, only a half of the collar was modelled. Mesh The collar geometry was divided into five regions which were refined into finite elements by a mesh generation algorithm. The RC collar mesh comprised 8-node quadrilateral elements whereas the SC lining comprised 5-node singly infinite elements allowing for heat transfer between the RC concrete and the SCL. Boundary conditions defined in the FE model referred to both temperature and displacements. In general, due to the underground environment, the ambient temperature within the cross passage remained constant and were as follows:
– approx. 160C inside the cross passage (i.e. between EB and WB collars) and
– approx. 100C in the running tunnels.
Programme-wise, the casting sequence of each member considered 3-day-curing followed by construction of the next member and, it should be highlighted, the shutter removal times varied in each case.
Lintel – Placing temperature of concrete: 230C
– Shutter type: 30mm-thick plywood
– Horizontal shutter removal after 24 hours
– Vertical shutter removal not considered
Jamb – Placing temperature of concrete: 230C
– Shutter type: 30mm-thick plywood
– Vertical shutter removal after 24 hours
Sill
– Placing temperature of concrete: 230C
– Shutter type: 30mm-thick plywood
– Vertical shutter removal not considered
– Duct pipes not considered
Note: The SCL lining worked as a permanent formwork and its temperature measured on-site was approx. 100C. It has been modelled by the FE elements allowing for heat transfer only without displacement restrained. 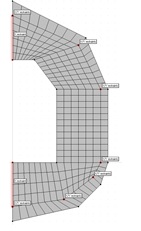
Displacement boundary conditions · Prior to casting the RC collars the waterproofing membrane was provided on the SCL primary lining which, restraint-wise, could be considered as a slip-free surface along the collar extrados.
· Having said that, due to the inadequate restraint types in the software, the boundary conditions were simplified to the nodal restraints in X- and Y-directions along the interface between the RC collar and the SCL.
· Vertical-axis symmetry of the RC-collar comprised X-displacements restrained along the vertical axis.
Loads Thermal load only was considered in this analysis. Figure 7:2 – In-put data of FE model
6.1 FE analysis
Model A aimed to simulate the collar construction sequence which helped to understand the thermal correlation between the consecutive pours. Isotherms in Figure 7:3 outlines the temperatures after 2, 48, 90 and 168 hours.
In principle, Model A correctly simulated the temperature rise phase and maximum temperatures matched the on-site readings except for Section 3. To a certain point the heat was mainly absorbed by the SCL which also occurred on site. However, in the FE analysis the SCL absorbed the heat up to a certain level only and then, unrealistically, the hydration heat was released by the air. As the result, the similar risk of cracking appeared along both the intrados and extrados. In reality, the heat release was constant on both surfaces and more effective by the SCL interface.
On the pour interfaces the double temperature peak was recorded due to the consecutive concrete pours. In the jamb the local “double-heat” effect owing to a new pour on the previous one caused the temperature to rise twice; at first due to Pour 2 and then, Pour 3. Figure 6:4 shows the double peak temperature curves recorded in the jambs of CP17 which was observed in the FE analysis (see Figure 7:4 Pour 3).
The Pour 1: time = 2 hours Pour 1: time = 48 hours 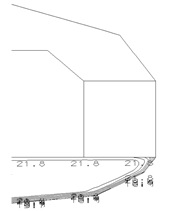
· Concrete temperature: 230C (i.e. placing temperature)
· Hydration has not started yet
· The SCL cooled down the concrete lump to 180C
· Still, more effective cooling through the SCL than the air
· Concrete temperature: 58.50C (max)
· SCL temperature: 430C
· Surface temperature: 370C
Pour 2: time = 90 hours Pour 3: time = 168 hours (Formwork removed) 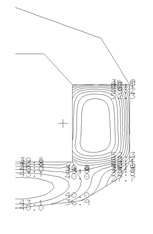
Sill:
· Concrete: 480C
· SCL: 400C
· Surface: 300C
Jamb:
· Concrete: 580C (max)
· SCL: 520C
· Surface: 520C
Jamb:
· Concrete: 420C
· SCL: 330C
· Surface: 210C
Lintel:
· Concrete: 520C
· SCL: 350C
· Surface: 480C
Figure 7:3 – Temperature plots of the FE analysis resultsF
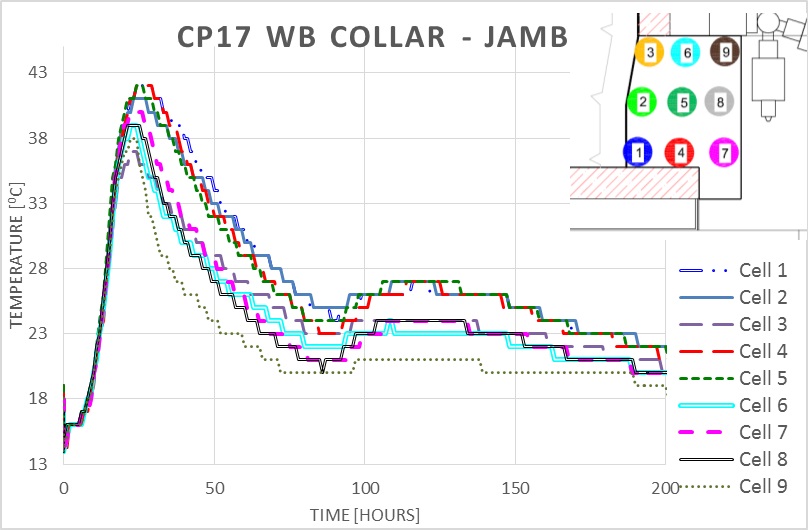
Figure 7:4 – Thermocouple readings from the jambs 6.2 Thermal stresses
The aim of modelling the lateral section of the sill (i.e. Pour 1) was to obtain the similar temperature as on site and then, to calculate the thermal stresses which represented the actual stresses developed on site.
The FE analysis showed that the crack formed when the tensile stress exceeded the concrete tensile capacity after approx. 75 hour as the temperature dropped 180C (see Figure 7:6).
Figure 7:6i) shows the temperature development derived in all three methods i.e. CIRIA C660 calculations, FE analysis and on-site assessment. All curves correspond well in the temperature-rising phase including similar max temperatures achieved. In terms of the concrete contraction phase, apart from CIRIA calculations, the cooling down was similar in the FE analysis and on site (see Section 6.1).
Figure 7:6 ii) and iii) show the FE principle stresses including tensile capacity based on Eurocode2. It considered 28-day compressive strength including an age function which enables to estimate the mean tensile strength, fctm(t) at time t in relation to the 28-day value.
As explained in Section 4.1, the rise of the hydration temperature corresponded with the compression up to the point when the maximum temperature was reached. Then, the temperature dropped what correlated with the tensile stress to develop until the concrete tensile capacity was reached and cracks formed.
As shown in Figure 7:6iii) the thermal stress exceeded the tensile capacity of the concrete after approx. 75 hour coinciding with the temperature drop of 180C. These results correspond with the CIRIA design confirming that the thermal reinforcement was required.
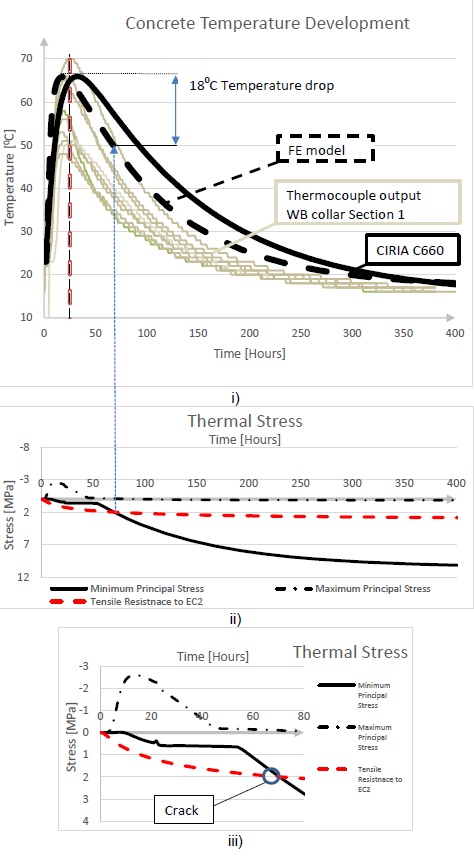
Figure 7:5 – Pour 1: Summary graph showing the temperature development on site, in CIRIA C660 estimation and FE analysis; ii) Thermal stress derived in the FE model; iii) Zoom on the stress graph during the first 80 hours. 6.3 Concluding remarks and recommendations
The aim of this technical paper was to summarise both design and on-site thermal assessment of the early-age concrete performance. Note that no cracks were observed in the concrete early-age (assuming 3 days). The following conclusions can be drawn.
- Temperature drop due to shutter removal
The thermocouple readings showed the maximum drop of approx. 100C due to the shutter removal which is below the cracking limit (i.e. 200C) for the limestone aggregate concrete. The shutters were removed after approx. 24 hours. - Thermal reinforcement required
The FE analysis showed that the crack formed when the tensile stresses exceeded the concrete tensile capacity (see Figure 7:6) which matched CIRIA C660 calculations. They proved that the thermal strains exceeded the concrete capacity therefore the cracking was predicted and the thermal reinforcement was provided. - Cracks in the collar extrados
Figure 6:2, Figure 6:3, and Figure 6:4 show the results of the thermocouples compared with the CIRIA C660 estimation.- As expected the highest temperatures were recorded in the centre of the collar.
- The extrados of the collars cooled down faster than the intrados due to SCL absorbing the hydration heat better than the air.
- Also, knowing that the collar middle sections reached the maximum temperatures, it can be concluded that the greater differential temperatures by the extrados the higher risk of cracking along the SCL/RC-collar interface. This interface is the first concrete defence against water penetration and for this reason adequate durability requirements should be applied (i.e. sufficient cover, crack width, and spacing).
- Internally – externally restrained members
The collar was regarded as a combination of the external and internal restraints.- On one hand, CIRIA C660 calculations assumed friction between the newly cast concrete and its sub-base (i.e. SCL) which might have resulted in strains leading to concrete cracking. In reality, the concrete was cast on the waterproof membrane which minimised the friction and reduced the risk of cracking.
- On the other hand, considering all three concrete pours separately, it is understood that the friction-reduced scenarios are valid for the first pour only (i.e. sill). The consecutive concrete pours were restrained by the previously cast members.
- Hence, for calculation simplicity, based on engineering judgment a degree of external restraint should be taken into account at the design stage.
- Voids in the construction joints
The construction joints locally expand due to the hydration heat generated by consecutive concrete pours. The existing concrete surface expands and deforms the young concrete. Next, during cooling down the new concrete contracts and the old concrete reduces its volume to its original shape causing voids along the interfaces with the cross passage invert (see Section 5.2).
- Temperature development varied along the collar width in Pour 1
The ambient temperature in Section 1 was lower than in Section 2 as the top surface was cooled down by the cold air from the running tunnels. Knowing that the peak temperatures correspond with the maximum compressive stress, the compression sustained for longer in Section 2 than in Section 1. As a result, compression on one side (i.e. Section 2) and tension in the middle (i.e. Section 1) may cause cracks which should be controlled by providing the thermal reinforcement between Sections 1 and 2 (valid especially for wider cross passages).
6.4 Recommendations
As it has been stated above, this paper aimed to compare the design of the early-age concrete approach with the on-site research results and to make recommendations on the design assumptions and on-site operations to be undertaken in the future. Hence, the following recommendations could be adopted in future tunnelling projects:
- Thermal reinforcement should be provided along SCL interface due to high differential temperatures.
- Especially in the well isolated sections (e.g. in this case Section 2 which was cast beyond the tunnel segments) the differential temperatures occur along the SCL interface and not on the top surface. Therefore, the thermal top reinforcement can be reduced as the temperatures developed in both the centre and in the surface of the collars are similar (see Section 6.1.2).
- For wide openings, the thermal reinforcement should be provided along the width of the collar due to thermal cracking between the middle and remote parts of the collars. This is a result of different boundary conditions along the collar width considering the remote part of the collar to be cast in the well isolated “pocket” (i.e. higher ambient temperature) whereas the middle of the section is cooled by the air from the running tunnels (i.e. lower ambient temperature).
- When concrete is cast on the membrane the external restraint should be reduced in the design due to limited friction.
- The re-groutable pipes should be installed in all construction joints (e.g. along the extrados and the SCL interface) in order to grout the voids formed due to expansion of the existing concrete.
- In terms of casting against the SCL (valid especially for thin sections e.g. cast in-situ secondary lining of cross passages) the shutters should be removed soon after concreting. On the one surface the formwork insulates and prevents temperature loss whereas on the other side the SCL cools down the pour constantly. It increases the differential temperature leading to cracking.
8 References
- CIRIA C660; Early-age thermal crack control in concrete; Bamforth, P, London, 2007
- Thermal stresses in concrete structures at early ages; Mats Emborg; Doctoral Thesis 1989:73 D; Division of Structural Engineering; Lulea University of Technology, 1990
- Effect of heat generation from cement hydration on mass concrete placement; Soo Geun Kim; Iowa State University, 2010
- CIRIA 135 Concreting deep lifts and large volume pours; P B Bamford, W F Price, London
- Technical Note No. 22 – Forth Edition – Non-structural cracks in concrete, A concrete Society Report, 2010
-
Authors

Agnieszka Mazurkiewicz - Arup
Tunnel Engineere
