Data management, analysis and visualisation on Crossrail Drive X Western Tunnels
Document
type: Technical Paper
Author:
Daniel Rendell, Paul Thurlow, ICE Publishing
Publication
Date: 03/11/2014
-
Read the full document
Introduction
The Crossrail project is one of the largest construction sites in Europe. It also specified the largest monitoring package in modern times. To enable the installation of instrumentation, capture of data reporting and archiving required a considered specification to be issued for the project.
Crossrail has specified and let the 701 contract prior to main works tender. This tender allowed for instrumentation and monitoring of assets prior to main works as well as providing an overarching archive software called UCIMS ( Underground Construction Information Monitoring Systems) that all contracts had to send processed data to and receive data from.
During the construction of the Jubilee Line Extension, instrumentation and monitoring was used extensively on different sites. There was very little co-ordination between sites and the data and results were largely left at site level. Attempts by academia to retrieve data and re- process the information was difficult due to different operating systems and data format.
The use of a common format for storing data was a logical step forward in monitoring data archiving. The AGS format is an established method of recording borehole data in the UK, but the use of this system for monitoring geotechnical and structural instrumentation data at such a scale was a first for instrumentation companies tendering on the project.
Monitoring software had to be re written to allow for automatic AGS export and import as many sections of the works overlapped between different contractors and their instrumentation suppliers. Data would be retrieved from UCIMS, but at critical phases of construction, the specified time frame in the works specification was not suitable, so instrumentation contractors took raw data from source and calculated results within their own software to facilitate construction progress. The use of an archive is commended, but for daily use on TBM and SCL works, co- ordination between data suppliers and their willingness to work together was key.
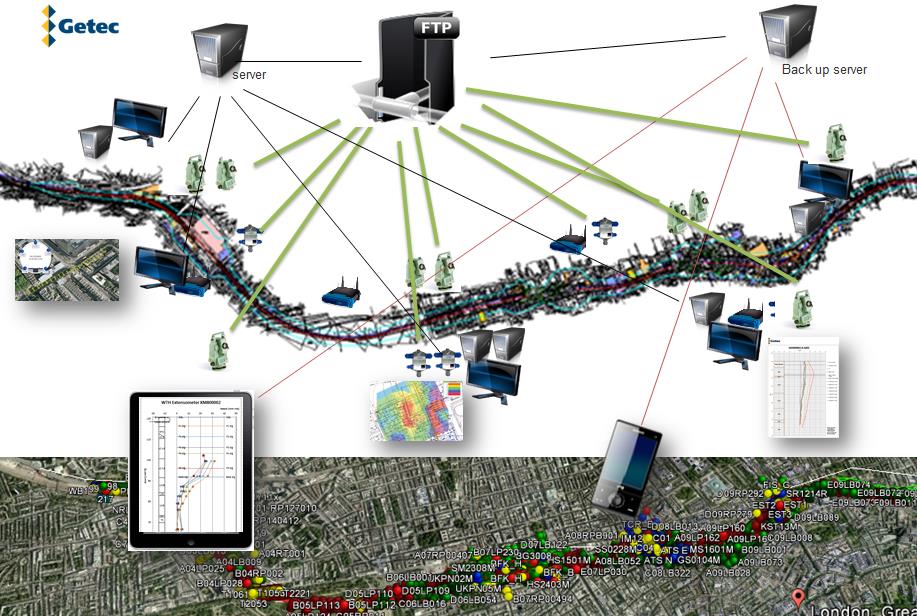
Figure 1 – Schematic of data collection techniques
The supply and visualisation of data is only useful if the software used on major infrastructure is able to expand as the project progresses and innovates. Contractors and Clients should invest in a database and monitoring system that is compatible with all end users and is able to expand as data load is increased. At the very least it should include the facility to track excavation progress and location real time and with absolute spatial position. It should also be compatible with mobile technology to enable Utility and Public stakeholder’s access for particular activities.
Current and future monitoring software will be able to add the latest technology such as 3D models that are used in BIM, site reporting that is linked by date and time stamp to data and public information.
Monitoring software and its management of data points should also be linked to the method of use in the work place. The preparation of set views and graphs is essential for the daily review meetings as is management of new drawings, new instrumentation locations and software updates.
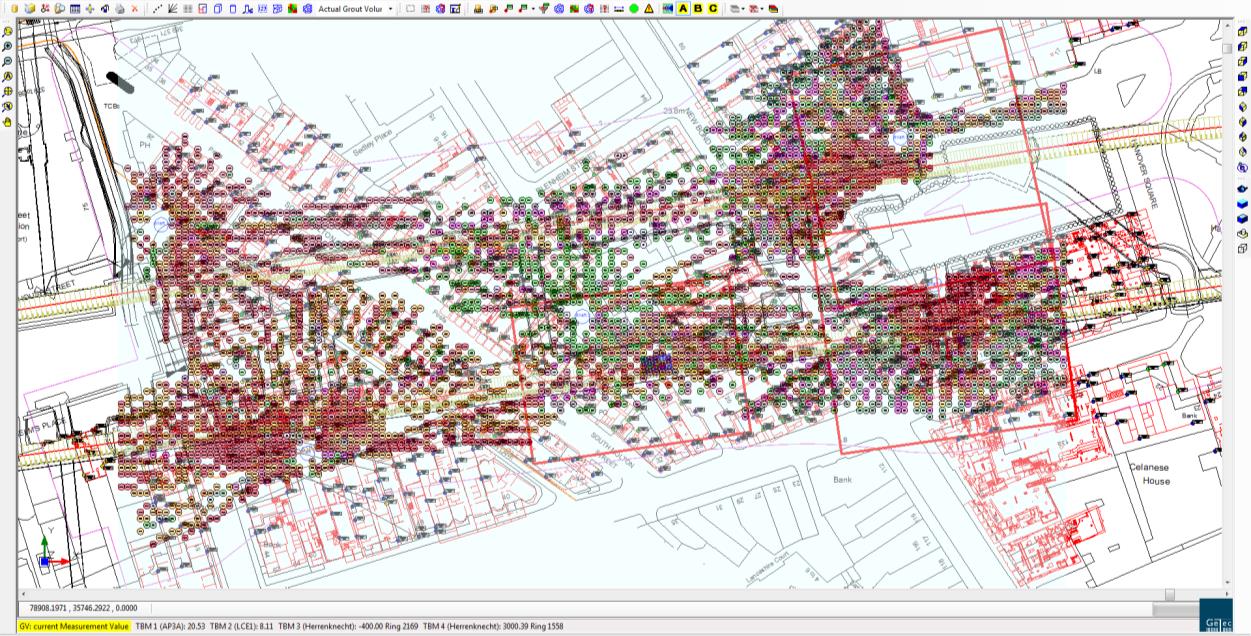
On a project of this scale data collection alone is not enough. There needs to be a way of storing the information in a secure way and also to view it from anywhere across the site at a speed that is acceptable to all end users. The software used for monitoring the I&M on the Crossrail Drive X Western Tunnel Drive was a specialist monitoring software called gtcVisual. gtcVisual is a software that was developed for the mining industry in the early eighties and was eventually used to also show grouting phases and results in a shared format. The software and its features have been upgraded extensively for Crossrail technical compliance and also to feature new instrumentation types such as fibre optics, shape accel array, wireless flat mesh tilt data and digital noise and vibration data.
The software has also been developed to provide fast and clear visualisation to the end user. The features far exceed the specification, but also provide user friendly input fields, data export for use in other geotechnical design software and clear journal features, that enable the history of instrumentation points on the project, but also the site activities.

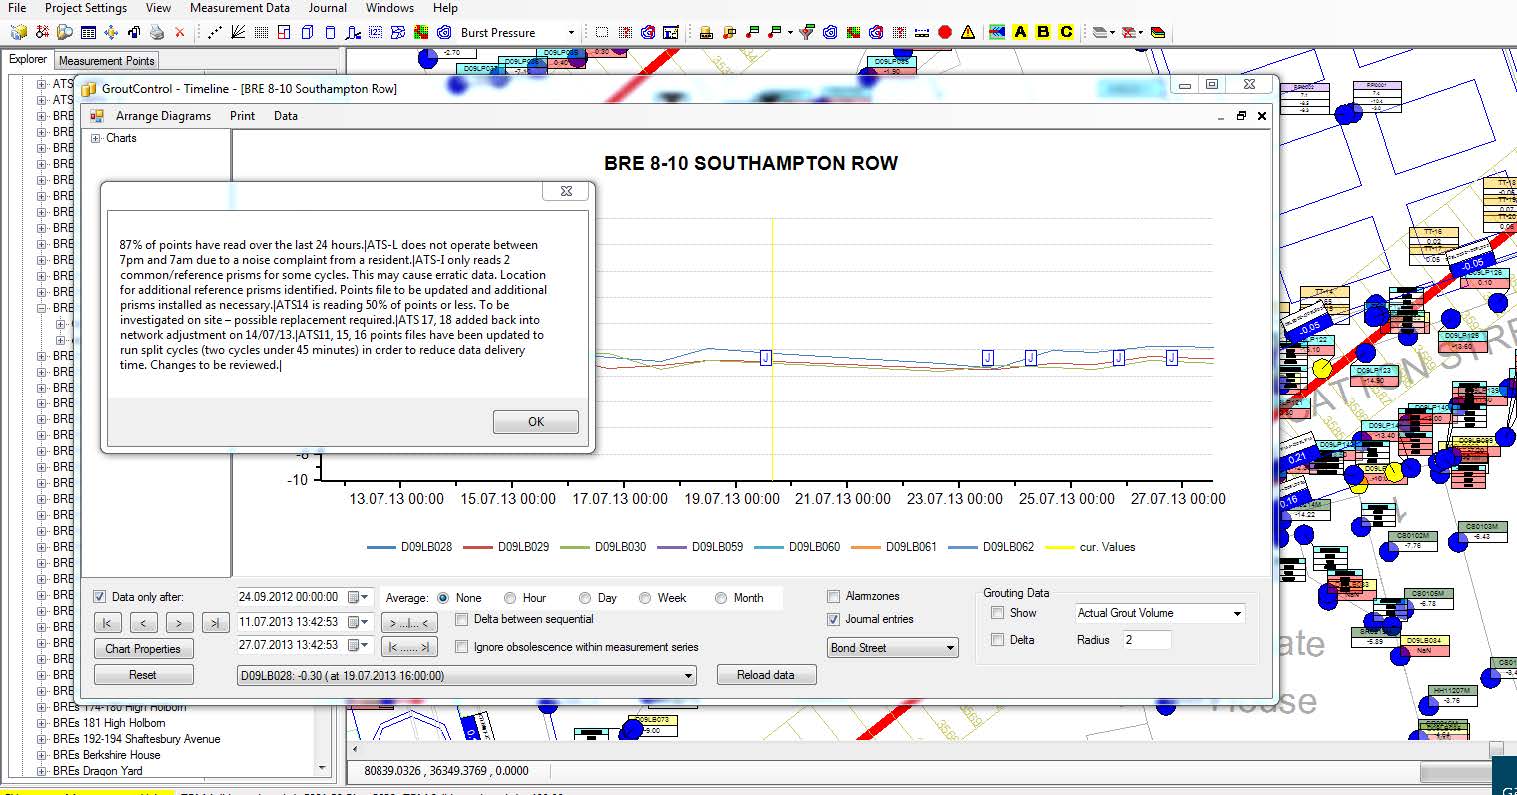
Figure 2 – The journal feature in gtcVisual
Data Management
Managing and visualising data is key to delivering a successful project. The effectiveness of instrumentation is also a key consideration at the design stage. The instrumentation and monitoring industry is constantly changing with more accurate and functional products being released constantly. An adaptive software system must be in place which is able to adapt to these changes and ready to accept data in a wide variety of formats.
With all the different work packages on-going around the drive x route it was critical to ensure that the data collected was as up-to-date as possible so that on-site trends could be monitored closely and reviewed in a timely fashion and also at daily review meetings. To achieve this a reliable and robust system needed to be implemented which would automatically collect data from a variety of sources and then map that data to the correct measurement point ready for visualisation, manually downloading data was not an option. When considering the monitoring system there are generally four criteria which need to be considered:
Speed and capacity, security, Visualisation requirements and functionality for the end user
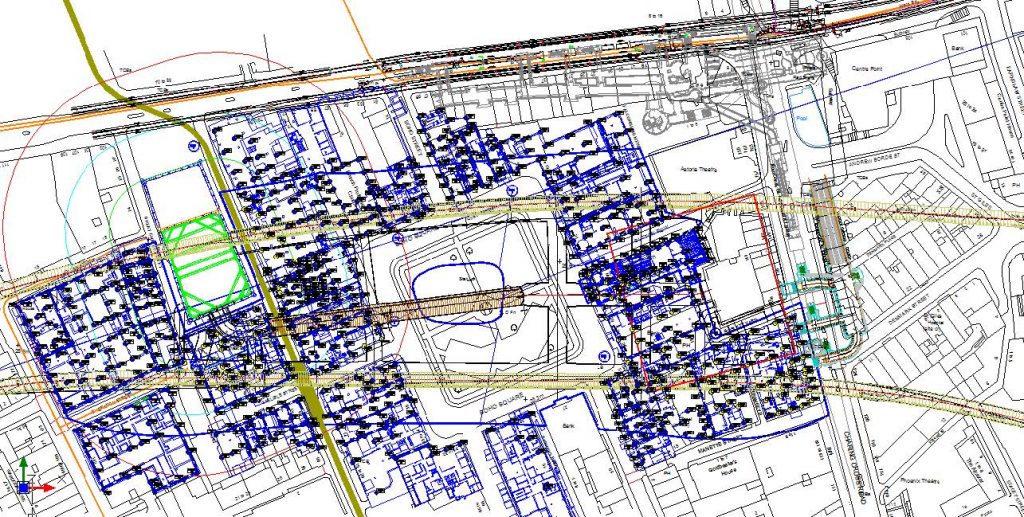
Figure 3 – View of Tottenham Court Road Station showing HLC positions
When considering the different delivery methods there are two options which can be used. That of a web-based service or a software based system. Generally data demands during a projects life cycle can reach high levels, coupled with a requirement to load a vast quantity of data through a connection shared with, in some cases, several thousand other users, this can impact on the performance of the system. It is for this reason that a software based system is much better suited for larger projects especially where users exceed ten.
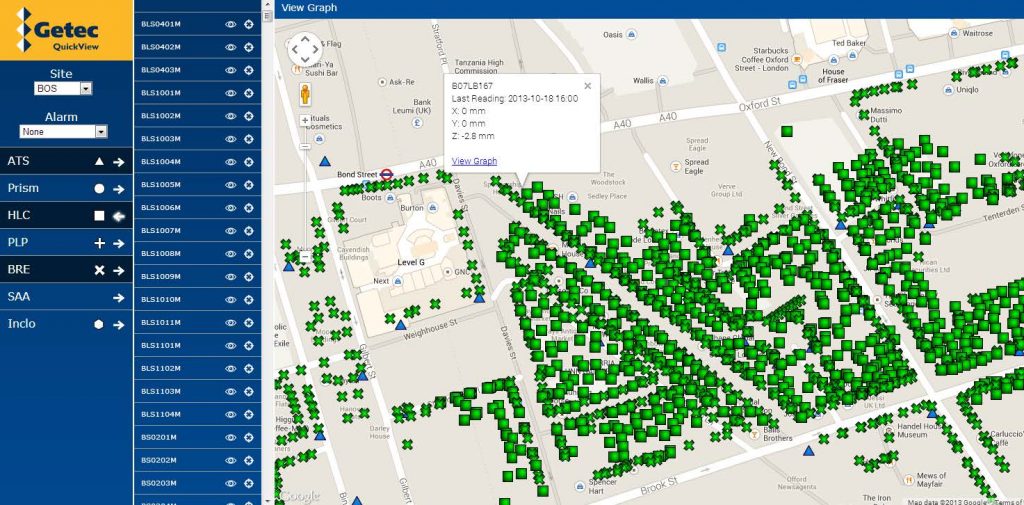
Figure 4 -Web based monitoring system used in parallel to main monitoring software
With software based systems some of the processing power is handled by the computer itself and the internet connection is only used for loading measurement data. This reduces the amount of traffic on a network and thus provides a better performance. Web-based systems are generally better suited for short time data access and where a limited number of users are involved.
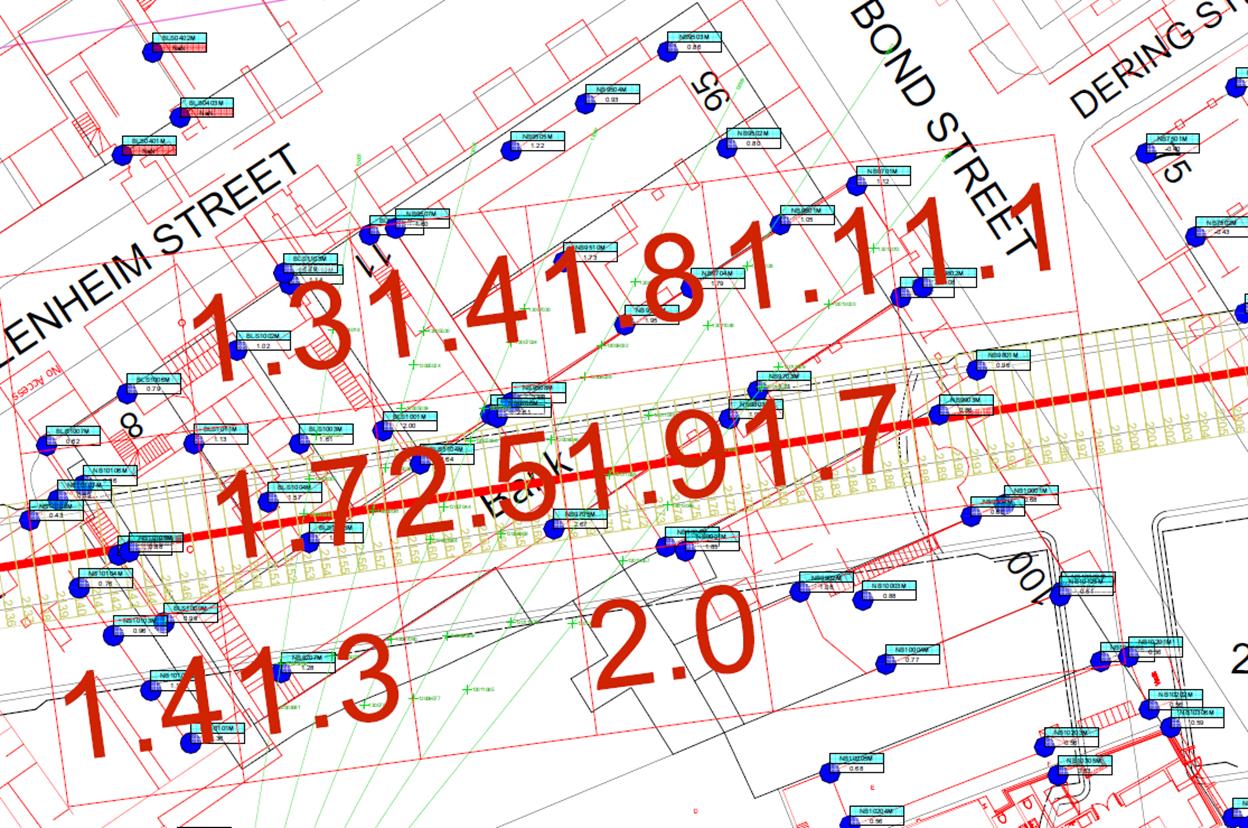
The speed of the monitoring system is paramount when dealing with construction activities such as TBM passage and compensation grouting. As the majority of users were concentrating on viewing their particular work area only and not the whole project, provision was made to allow partial areas of the site to be available, making the software fit for purpose.
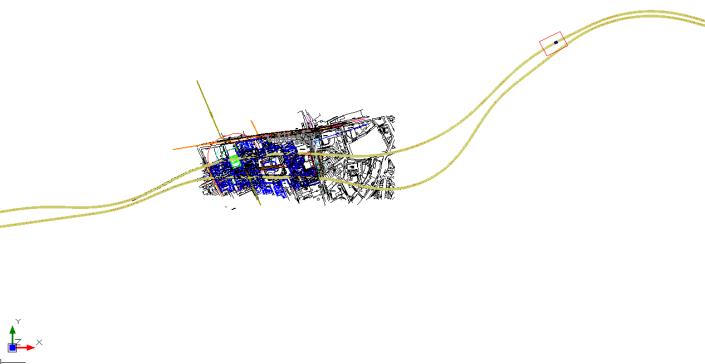
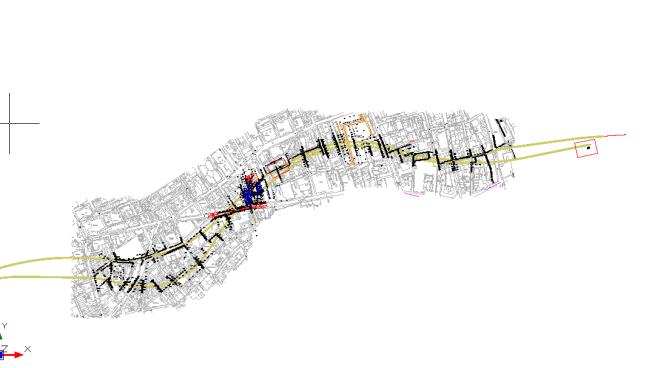
Figure 5 – Expanded and local views of works sites
The use of preset graphical presentations involving multiple points that were particular to specific buildings or assets were pre- set at the beginning of the project to ensure continuity within the site team. This also allowed for third parties to receive the same data in formats that were easy to read. This is a much more efficient way of analysing data instead of looking at each point in turn. From viewing the data in this way clear trends in deformations could be identified.
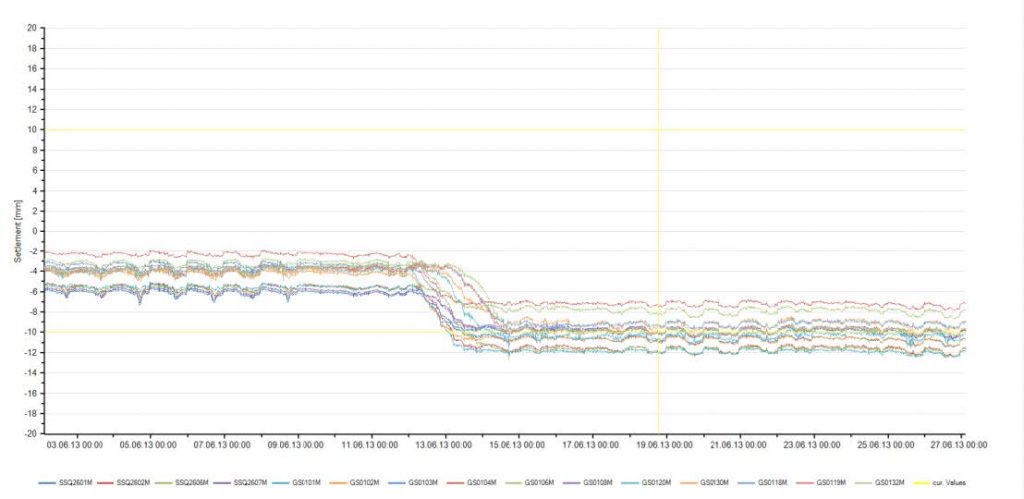
Figure 6 – Trend analysis using multiple point data
Loading data can slow down server resources and therefore consideration was given to provide facilities to show data from various time stamps or data formats on loading, to speed up operations. Averaging of the available data over a user defined time period is an example of this.
The storage capacity of servers and the backup procedures for data were also important factors to consider on this project. There needed to be sufficient capacity that expansion could easily take place if and when the works scope changed. Further to this there is also the consideration that measurement rates increase and decrease during a projects lifecycle according to the works taking place. For example during TBM passage the monitoring frequency is higher than that of when it has passed.
When data for automated instrumentation is measured it is then stored on a local logger or PC where it awaits uploading to a cloud storage facility such as an FTP site. Generally this will be to a specific folder on the FTP itself to improve functionality. Any new data files are then downloaded at regular intervals of 10 minutes. Once downloaded the new data files are directed to a specific location on the server where the file contents are read and recognised by the gtcVisual software and then added to the database. The data is then available to be viewed by anyone with access to the software. All of this means that the time from the data being measured to it arriving on a user’s screen is less than 15 minutes. As the primary idea of the Observational method is to react upon observing deformations and recognising developing trends this quick turnaround is crucial. Combined with an easy to use export feature data can be downloaded for importing into specialist analytical software for further design checks and analysis, giving maximum flexibility to a user.
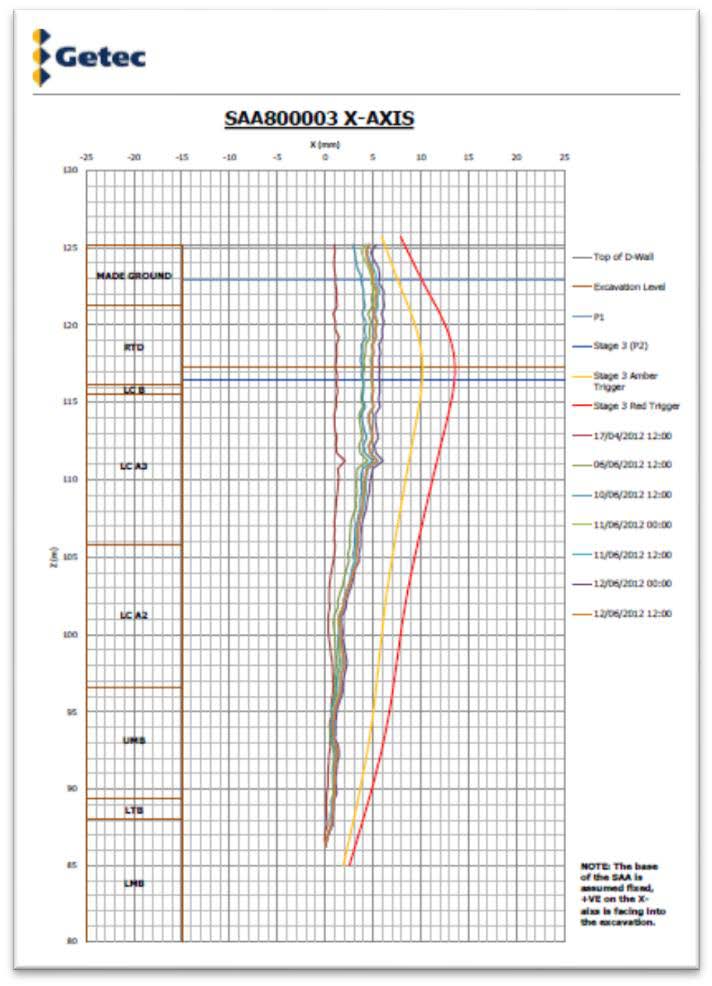
Figure 7 – Inclinometer data with design lines, excavation and propping levels
Further to the site loggers recording data there was also a large amount of data being received from other contractors along the route who were specifically involved with station boxes for example or LU running tunnels which the TBM would need to pass in close proximity to. This data was handled in much the same way in that a file format was discussed and agreed with the contractor and a download protocol set up on the FTP site and SQL server so that when a file was received it would be recognised and downloaded into the correct location on the server.
To ensure that all data is mapped correctly within the database each measurement sensor is assigned its own unique ID, its own unique point name, an alias name which in the case of Crossrail was its UCIMS name and its geodetic co-ordinates in Crossrail Grid. This information is used by the software to position the sensors on the user’s screen in a precise way and also make each sensor identifiable for ease of use.
Analysis and Data Visualisation
Given the delicate nature of the works being carried out it was of critical importance to carefully monitor how deformations being measured on site compared to anticipated movements by assigning alerts and trigger values to each sensor, these were broken into three categories, Green, Amber and Red with a forth trigger threshold of Black being used in extreme circumstances. All charts which are plotted have the ability to also plot their associated trigger values so that appropriate safety checks can be carried out. When considering the method of presentation there are a few options which can be used;
– Individual or Collective measurement point charts
– ‘Cut Profile’ plots
– Contour plotsAll of these could be plotted to not only show deformations since the instruments were first switched on but also from a specific moment in time, known as a time reference plot. This is especially useful when target grouting works are being carried out or the triggers assigned to a particular asset are only concerned with construction impacts and not previously observed movements.
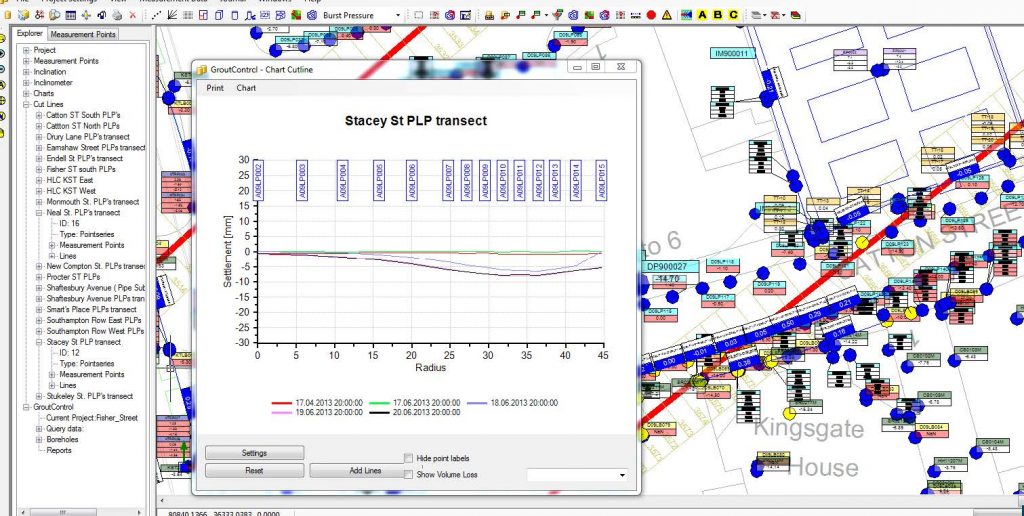
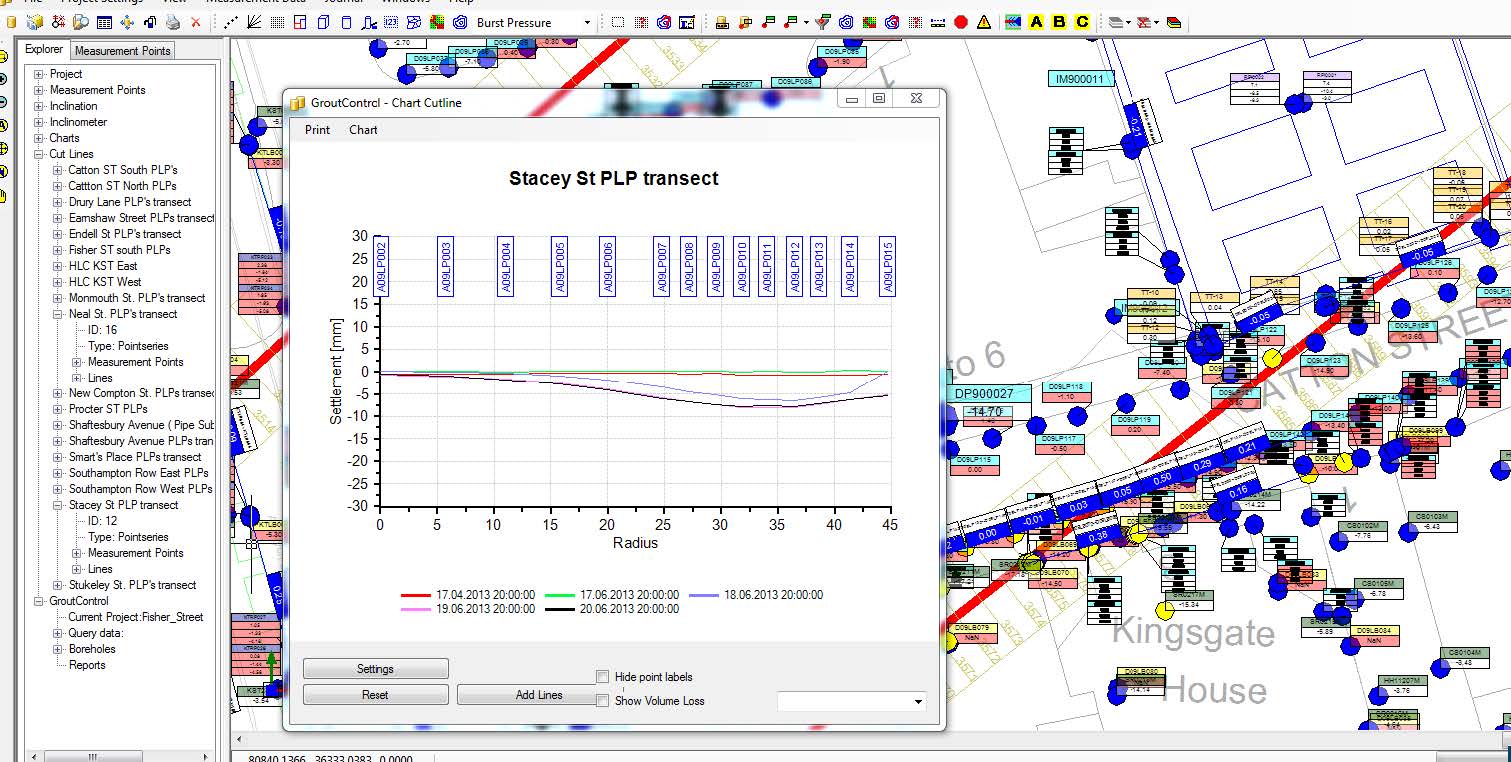
Figure 8 – Visualisation of cut lines for precise level points . Not the cut and slope have alarm triggers shown on screen
Whilst viewing data for multiple points is a useful tool to have when monitoring it cannot always give a good indication as to what that means in relation to surrounding measurements and an overall view of what is happening across a site. In this instance virtual sensors are used to calculate parameters such as slopes and deflection ratios between select sensors either along a highway or public footpath. Track cant and twist were also calculated for rail specific assets were the condition of pairs of running rails was required to ensure the safety of the general public who would be travelling along these routes each day. In the event triggers were breached on these calculations the relevant parties would be notified and control measures put in place. However it never came to this as the combination of fast and reliable data ensured that construction methods during passage of the TBMs could be altered as they went before excessive deformations were caused.
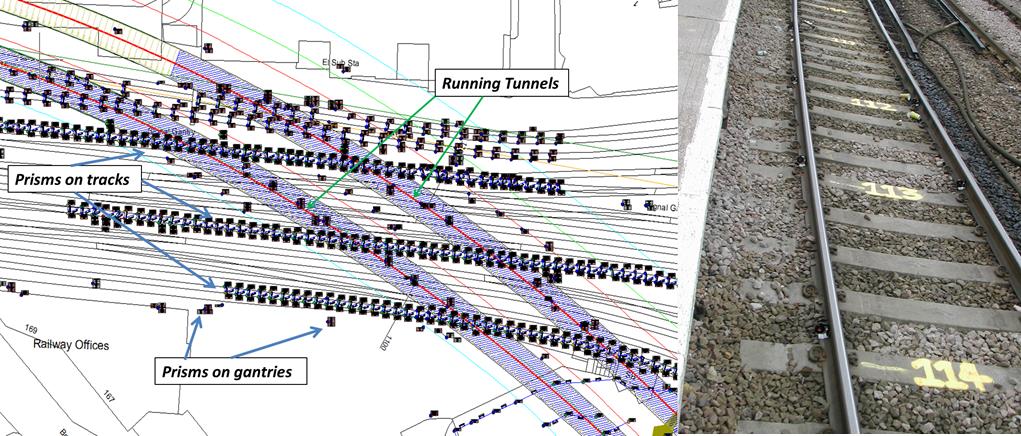
Figure 9 – Track Monitoring
Prisms shown on existing tracks display the most current geospatial data which is then in-turn used to calculate the rail specific parameters. The result of which is displayed as a virtual sensor between the prisms.
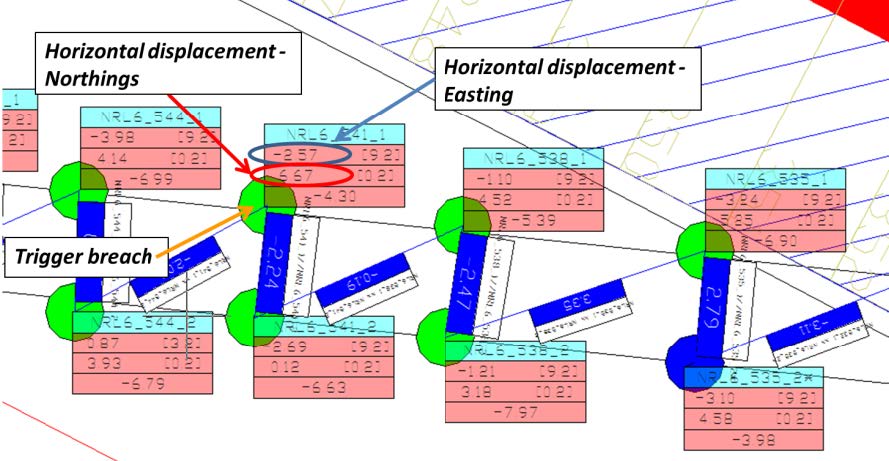
Figure 10 – Twist and Cant between measurement points
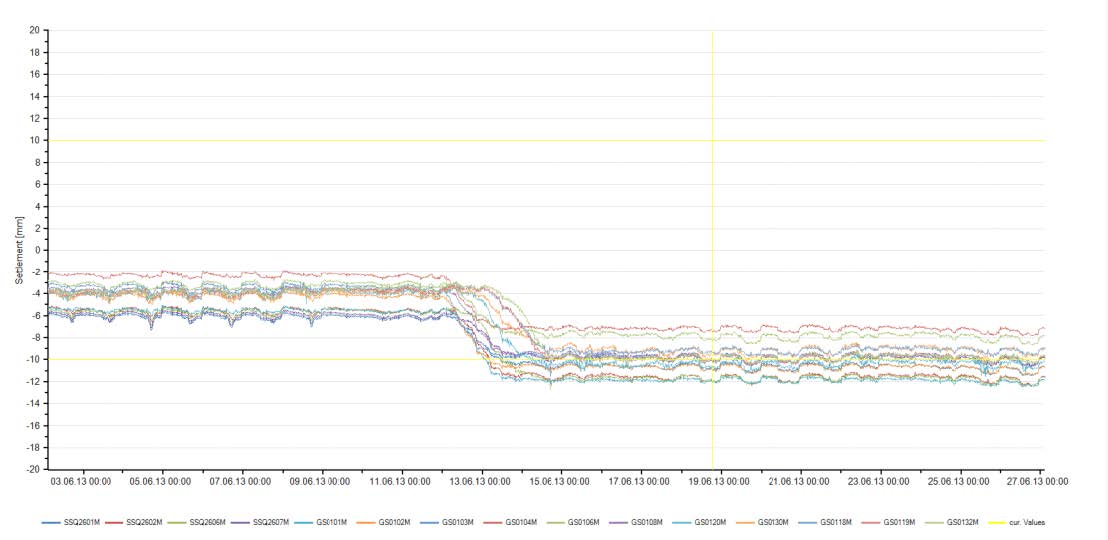
Figure 11 shows an example of the charts which were produced for the different site works. By viewing data in this collective manner it is easy to recognise that a common trend was occurring at this specific location, by checking the construction parameters adverse settlement was avoided and following TBM passage no further excessive settlement has been measured.
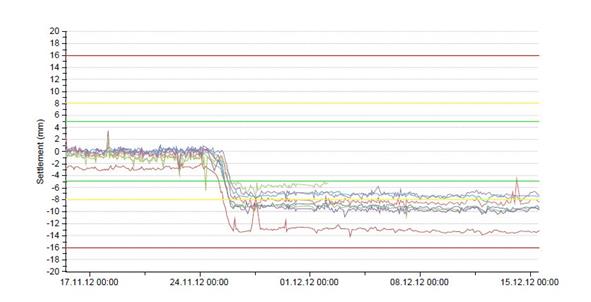
Figure 11 – Prism data showing settlement as TBM crossed railway tracks
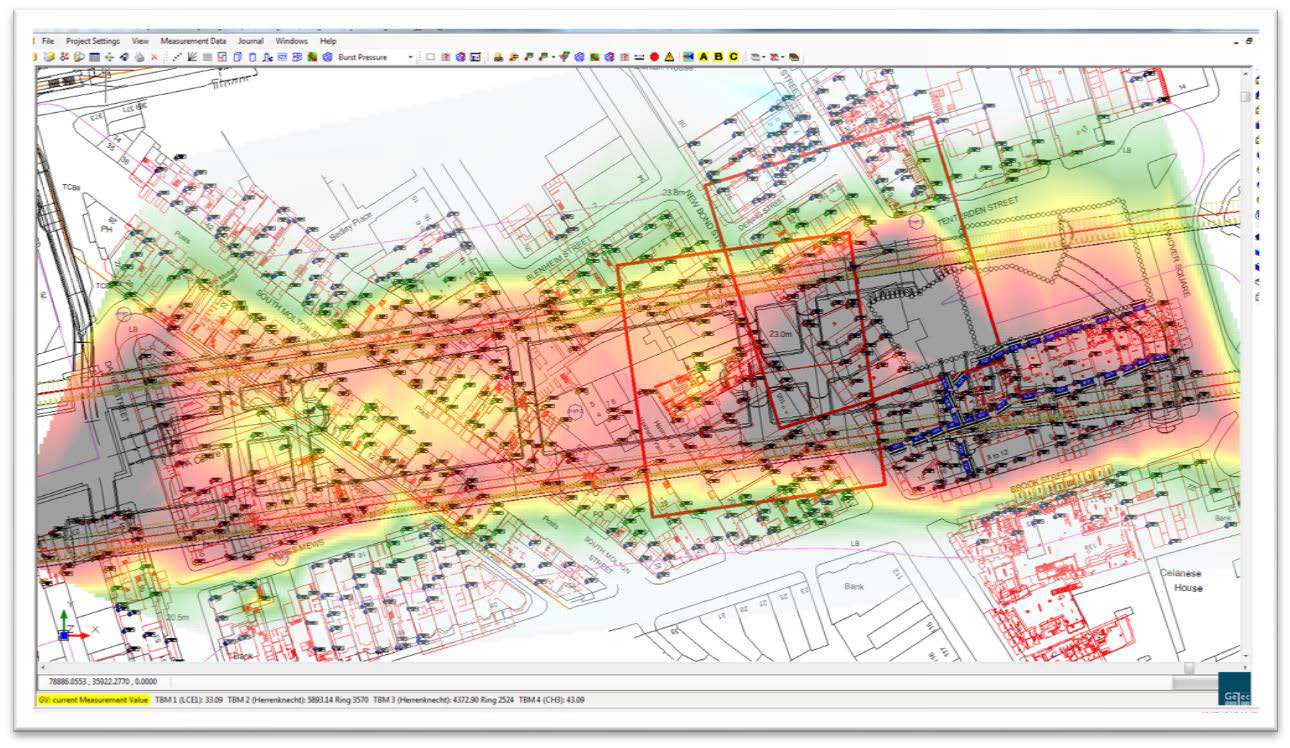
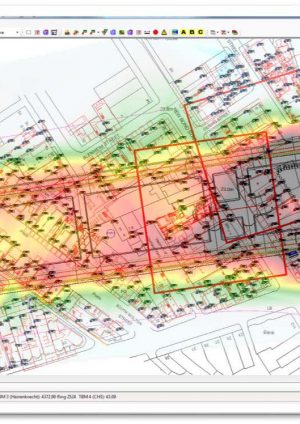
By combining data within the monitoring database it was possible to interpolate between different measurement points and create contour mapping diagrams. This was then used to identify areas of heave and settlement which was then utilised by the site teams carrying out both the construction and the grouting works so that they could either alter their work methodology or focus their remediation techniques.
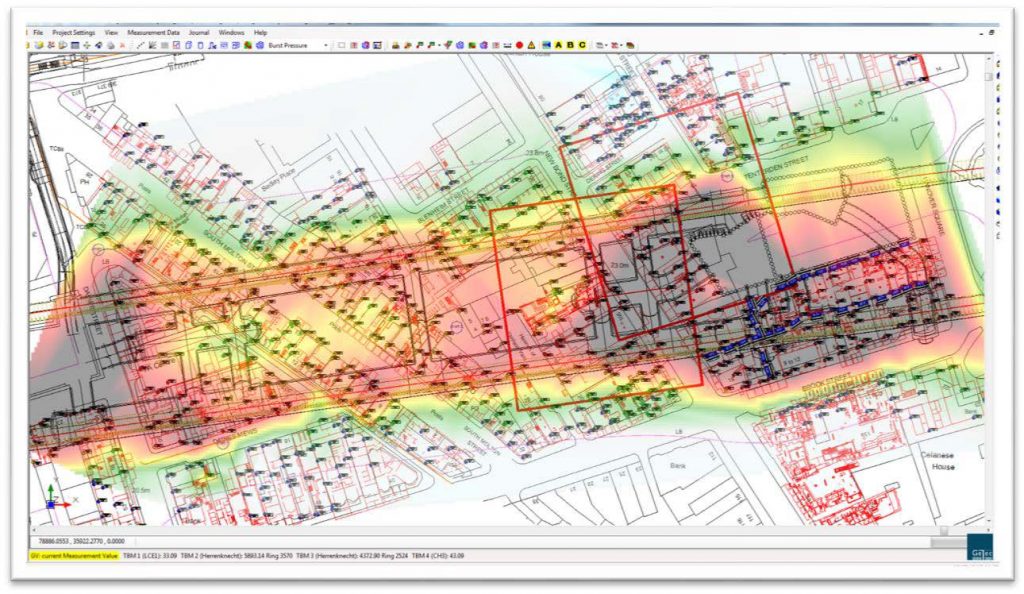
Figure 12 – Interpolation of data to create a site contour plot
This information could then be used in conjunction with the “time reference” feature to see the same results but with regard to a specific date and time. This allows the user to then monitor construction induced settlements attributed to one specific section of works instead of the absolute settlement created during the life cycle of the project.
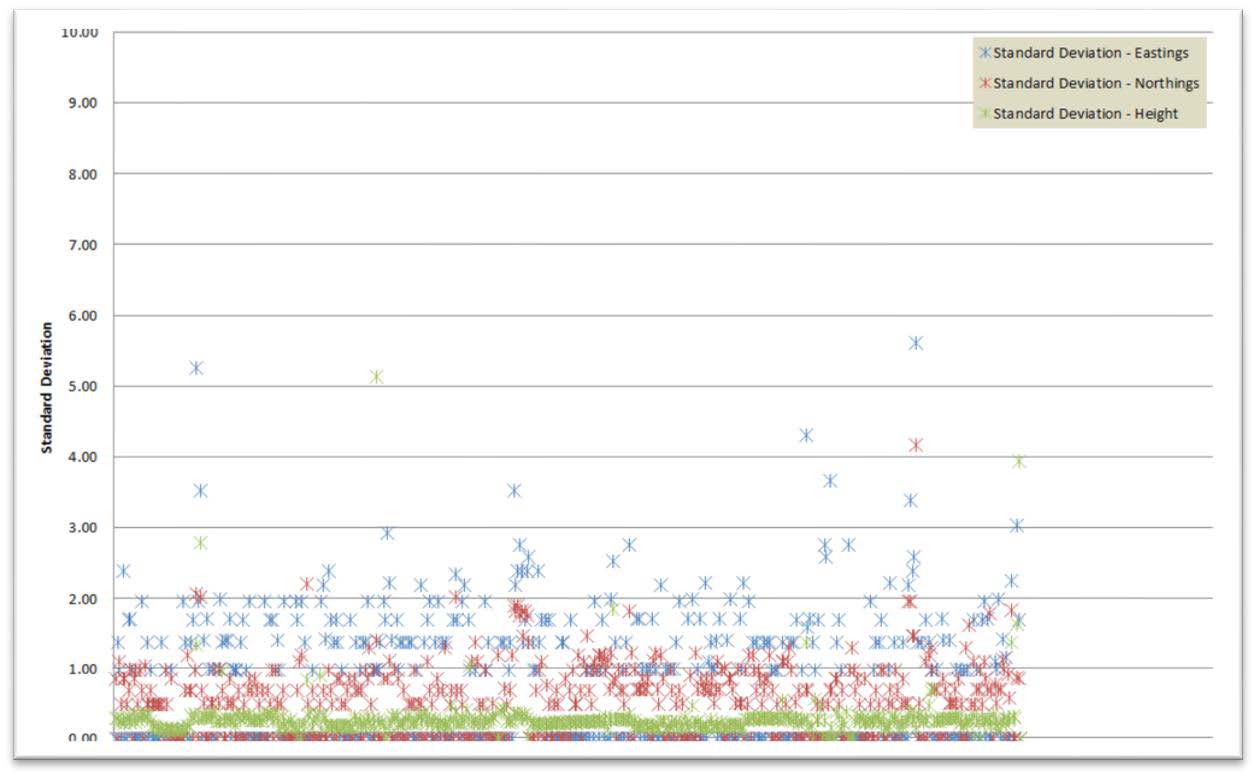
To ensure that the quality of data produced was to a high standard regular quality control checks were carried out on data on aspects such as the standard deviation which was checked over a defined time period. The risk in doing this was that the standard deviation equation does not distinguish between actual deformation and instrument noise or erroneous measurements. As the measurement points are nearly always moving it becomes difficult to determine a quality parameter. Therefore as deformations generally occurred gradually time periods of 24, 48 hours were chosen and the results plotted over a scatter graph to give an indication of data spread.
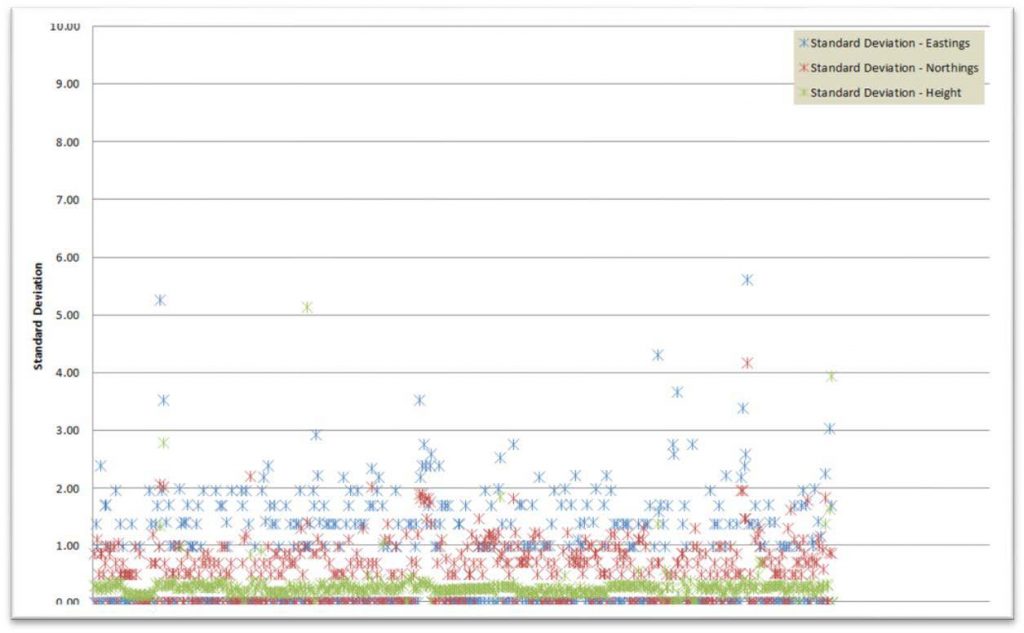
Figure 13 – Standard Deviation Checks on Data
As construction works advance the influence zone generated by these works also advances and changes in size. It was especially important that during these works the exact location of any construction activities be known in as close to real time as possible. To this end the monitoring software used allows for multiple TBM and SCL faces to be tracked at any one time. Each of these uses a complex system of analytical queries to calculate the depth below ground level of an excavation and then from that extrapolate the zone of influence and visualise that on screen.
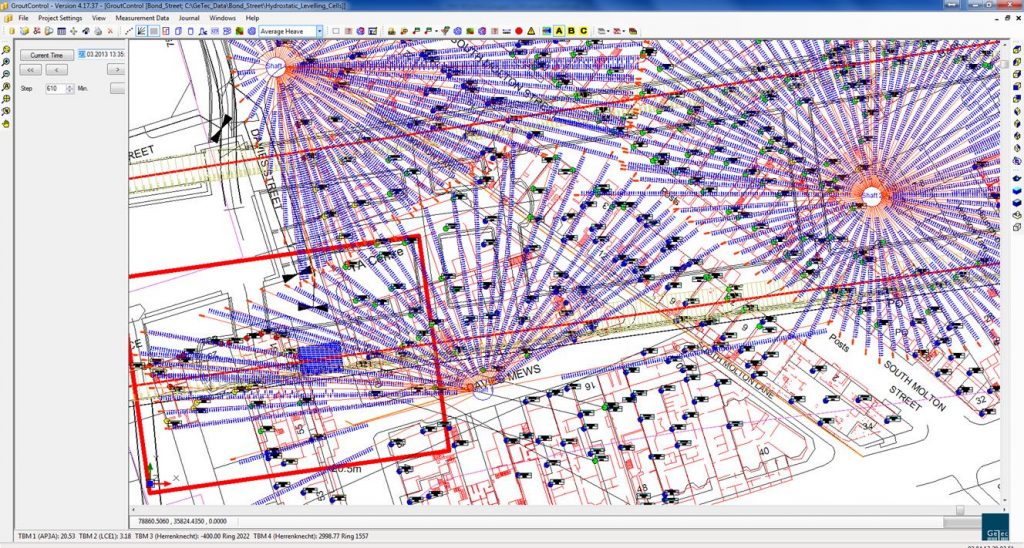
Figure 14 – Visualisation of zone of influence marker for TBM with monitoring points and compensation grouting tubes
The benefit of this is that the site engineers can then prioritise manual surveying teams to the areas of critical interest for a given shift. It also allows for on-site deformations to be correlated to site works, eliminating any question of erroneous data being measured. This process happens automatically each time a new construction advance takes place. Face loss at the tunnel head is also monitored through use of the volume loss calculation where predicted settlement troughs are compared against actual recorded settlements to determine if predicts behaviours are being observed.
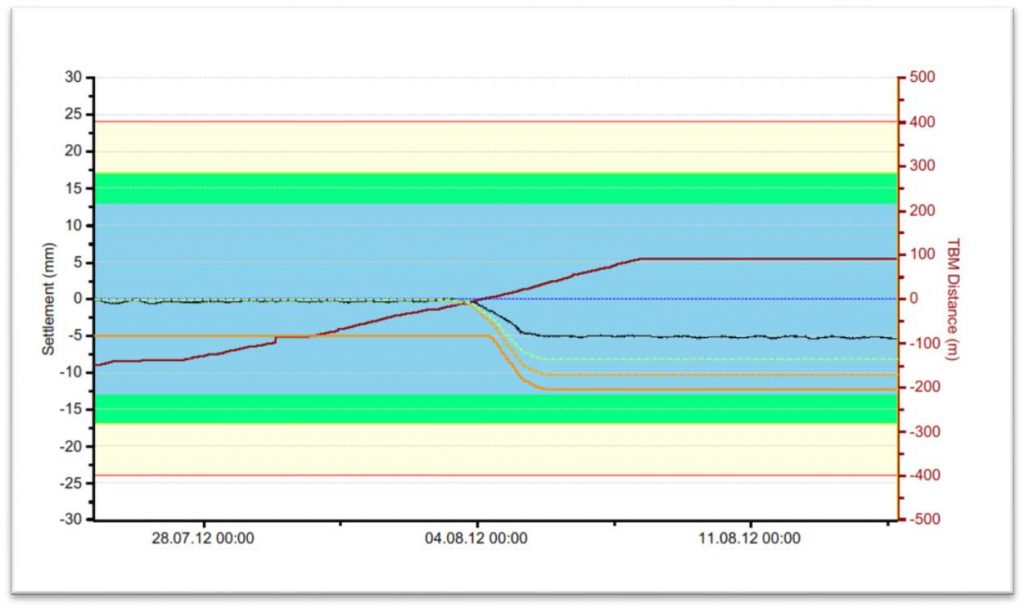
Figure 15 – Volume loss curves
The chart shown in figure 15 is an example of the volume loss curve which can be generated for a given point. The chart shows the predicted settlement curve which will result from construction works in relation to the horizontal and vertical distance the point is from the tunnel.
Asset Protection
With urban tunnelling projects there is nearly always a risk of interface between construction works and existing third party assets. These can be anything from buried water or telecommunication utilities to public transport links such as tube lines. In every case there will be an asset protection engineer (APE) somewhere who is interested in what monitoring is showing around and within that asset. Following the early success of the gtcVisual monitoring software many of these engineers bought into to the system giving them 24 hour access to data which they could then analyse and export to carry out further detailed calculations and checks.

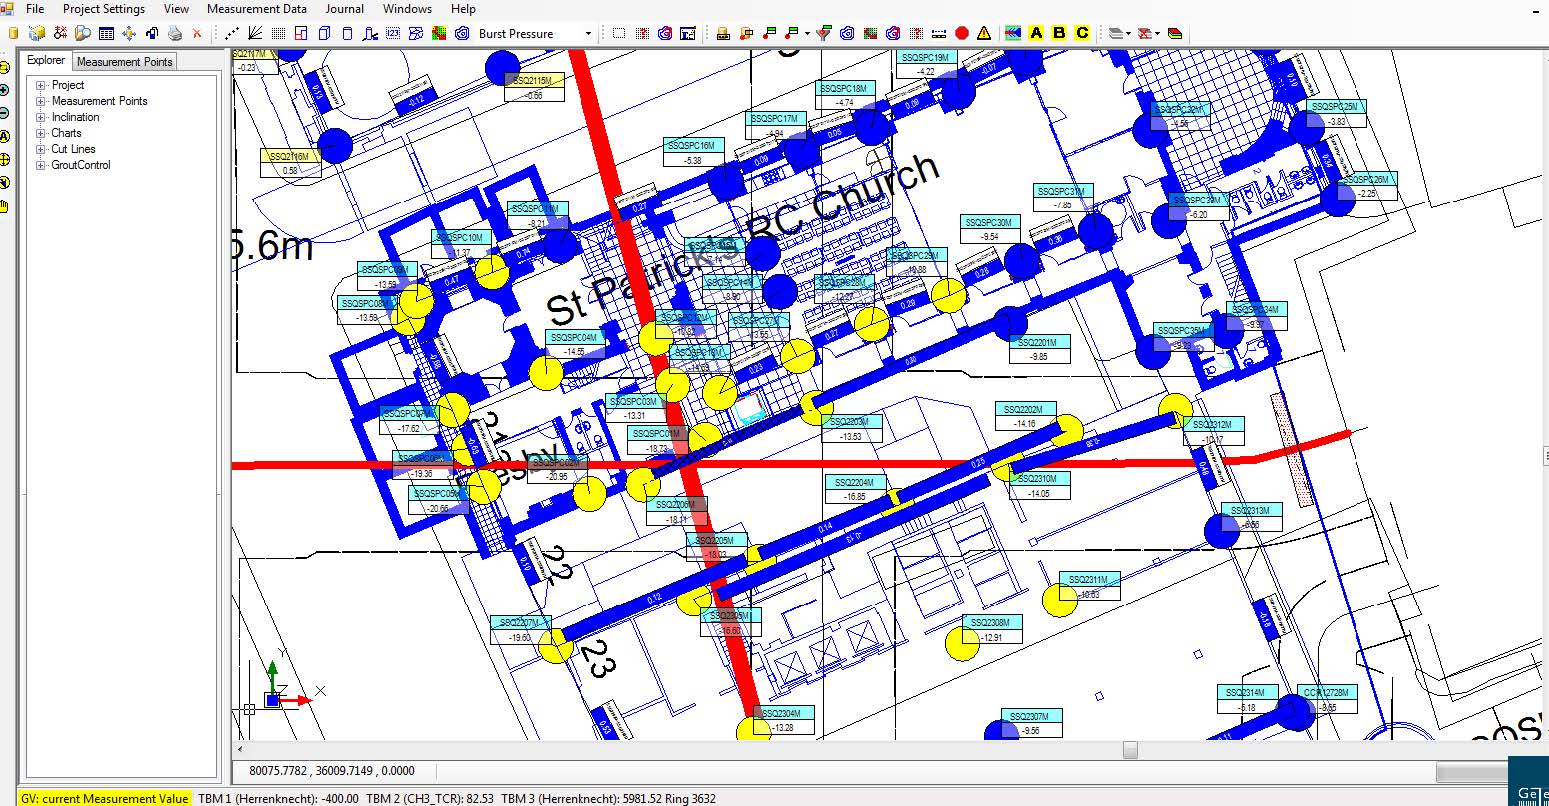
Figure 16 – St Patricks Church View. Asset Protection Engineers were able to follow tilt and slope values easily
This information was also used by stakeholders from whom permission was required before works could pass over or near to their assets. These LONOs (Letter of No Objection) were issued in a timely fashion because of the reliable and readily available data which could be accessed by the different engineers. Without this works would have progressed at a much slower rate and that was not acceptable.
Data on the move
There is a growing demand for data on the move. With the ability to view data on portable tablet devices engineers can reach new realms of control on site. This is especially critical where fast review and control is needed on site. Before the use of such applications the engineer would need to access data from an office away from the site and then spend time travelling between the two to investigate further. Now with the use of monitoring apps the latest data can be accessed and displayed in a clear and concise way whilst standing next to the asset .This not only improves the efficiency of those working on site but also improves response times if a problem is identified.
An example would be viewing inclinometer data which is being used for monitoring a station box excavation. Viewer applications can be fully customised to show excavation levels and different design curves all based around specific dates. The benefit with this being that the user can look back at historical data and the graphs will update to show the state of works at the time. This means that there is never a combination of new and old data being displayed at the same time, giving the user the most accurate display.
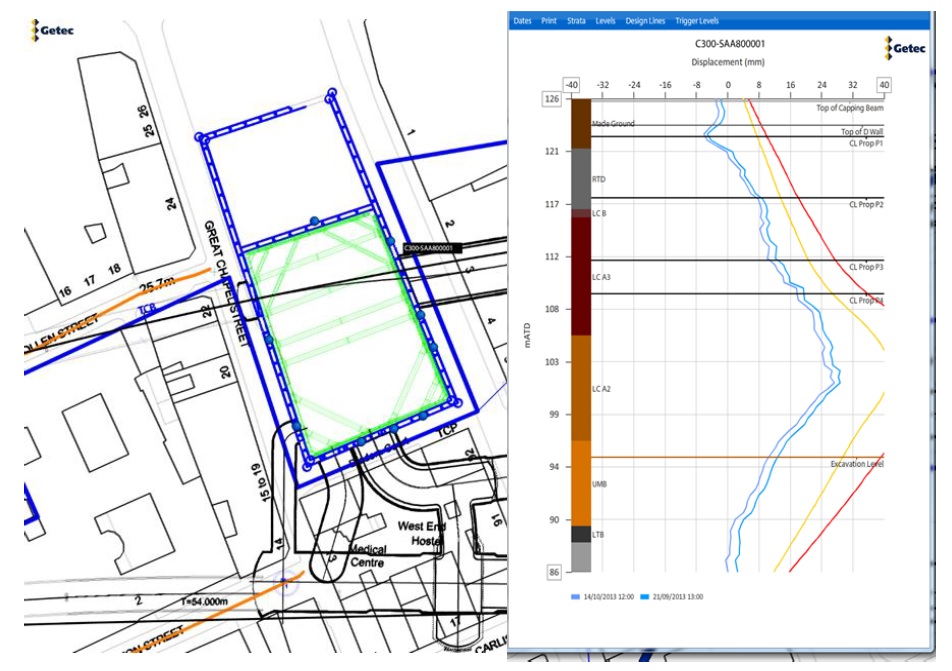
Figure 17 – Data Views on Smart Devices
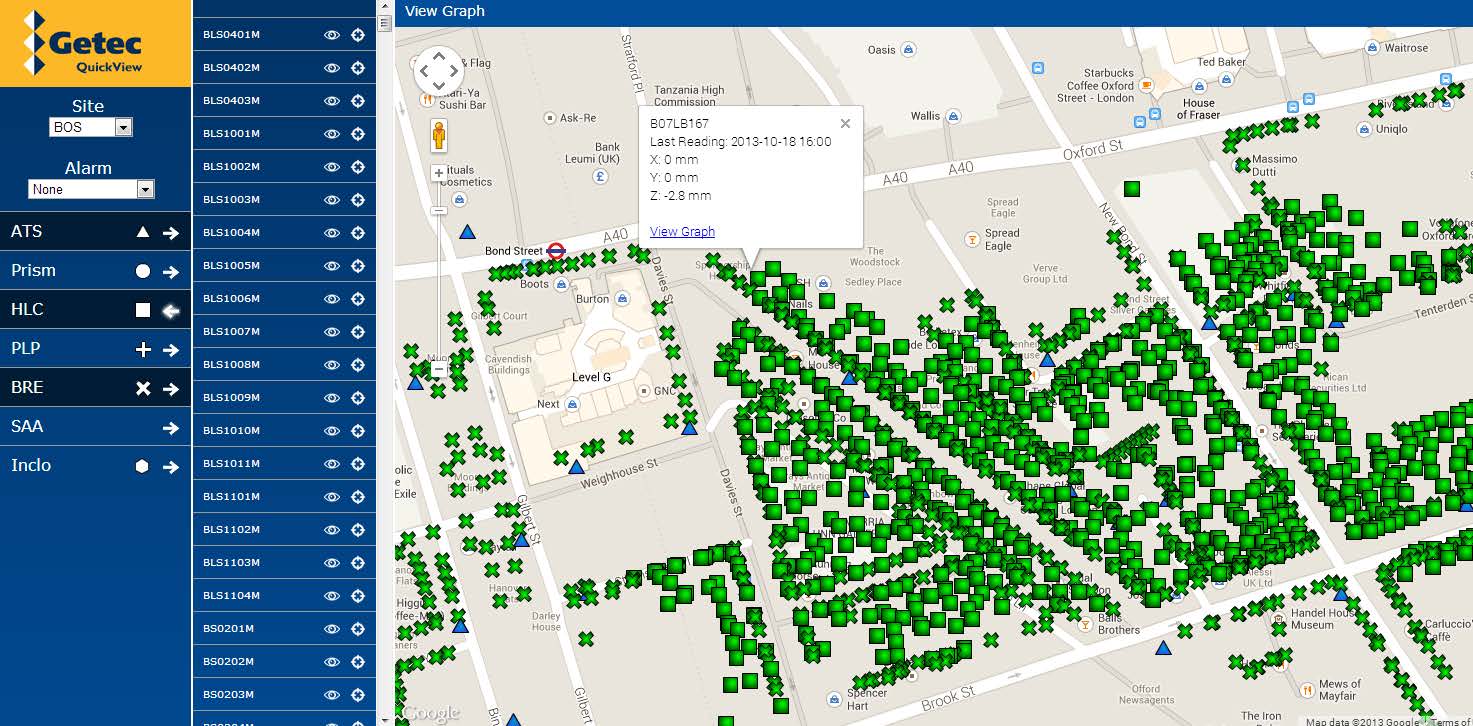
Another technology which is being utilised is the use of web-based applications. As the number of Another technology which is being utilised is the use of web-based applications. As the number of users is restricted and the pull on data targeted specifically to what is required the performance from such a system is not affected. Getec QuickView is the application which is being used to display simple data in the form of charts whilst also working in conjunction with a web based mapping tool. Providing detailed and reliable background mapping onto which monitoring data can be displayed. State of the art encryption and user logins ensures that all data is secure and only accessible by authorised persons.
The combination of technological advancements with hand held devices brings monitoring into a new field which is highly sought after, especially as more and more major construction projects are being carried out within the urban environment.
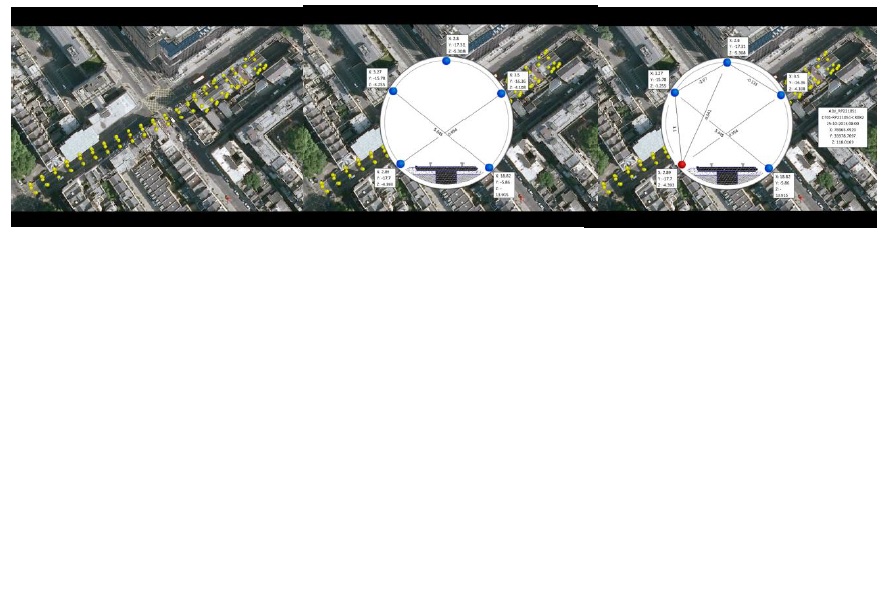
Figure 18 – Smart phone application showing tunnel ring deformation in true 3d using prism data
Monitoring compensation grouting
As well as monitoring the deformations created from constructing twin bore tunnels between Royal Oak Portal and Farringdon there are also station box excavations and sprayed concrete lining works which require mitigation measures such as compensation grouting. The compensation grouting specialist Keller Bam Richies used the gtcVisual software and one of its bolt on systems Grout Control to control the site works. The same database is used as for the monitoring data and the management of the data, drawings and measuring points is controlled by the I& M contractor. The grouting instructions are compiled on the grout control interface and sent directly to grouting containers on site. The operators sit in front of two screens, one of which is the gtcVisual project that is being used for the works.
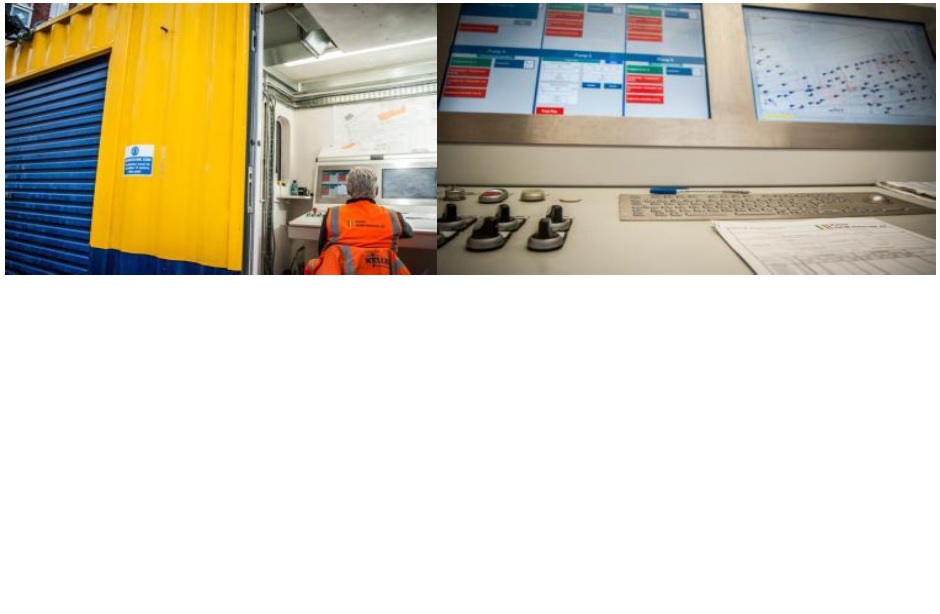
Figure 19 – Grouting container and gtcVisual display
The operators select the shift information for the day and oversee the site operations. Details of the grout volume, pressure and flow are stored and sent back to the central database. The operator can view real time data and its change as a result of the injection.
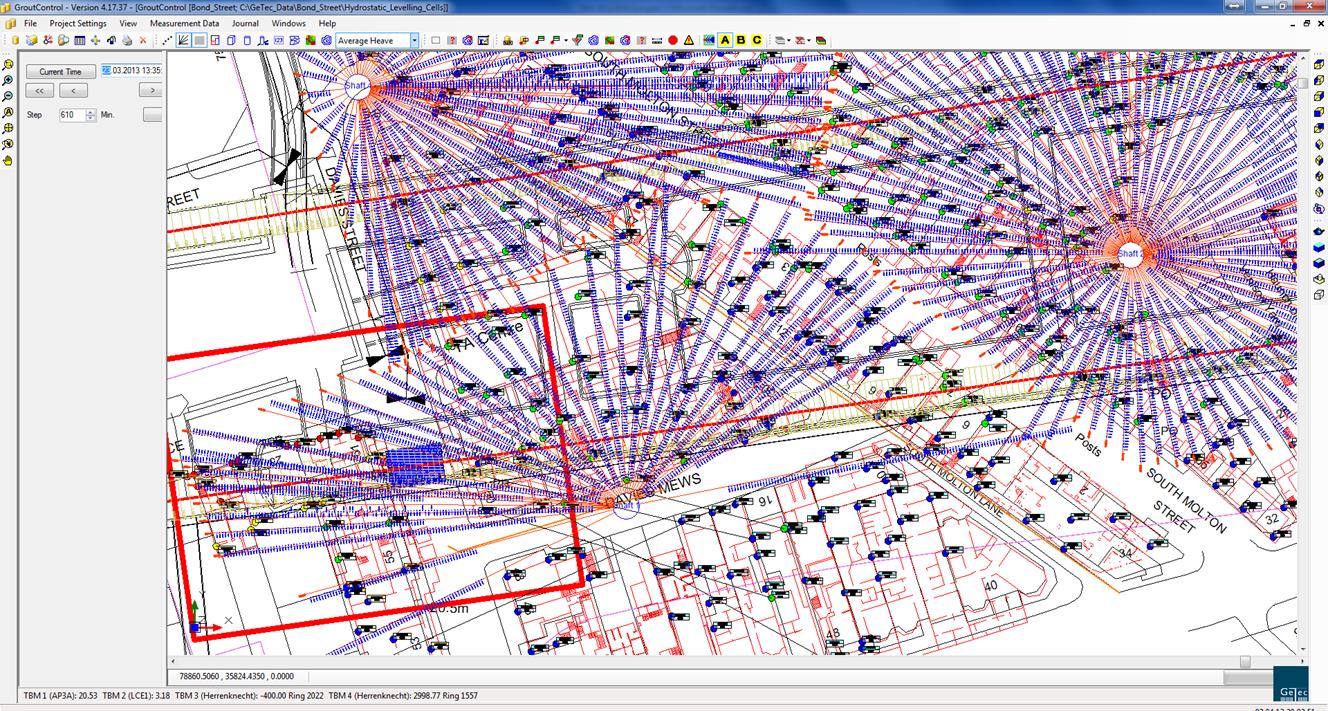
The site engineer at the end of the shift can review visually the amount of grout injected, location and heave induced.
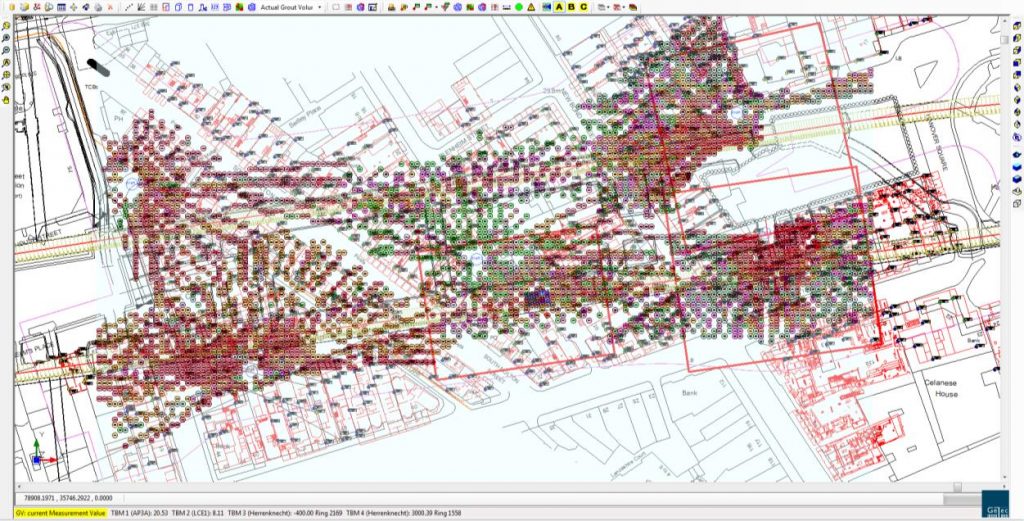
Figure 20 – Visualisation of grouting activities over a series of days. Monitoring data, TBM and SCL face areas are also shown
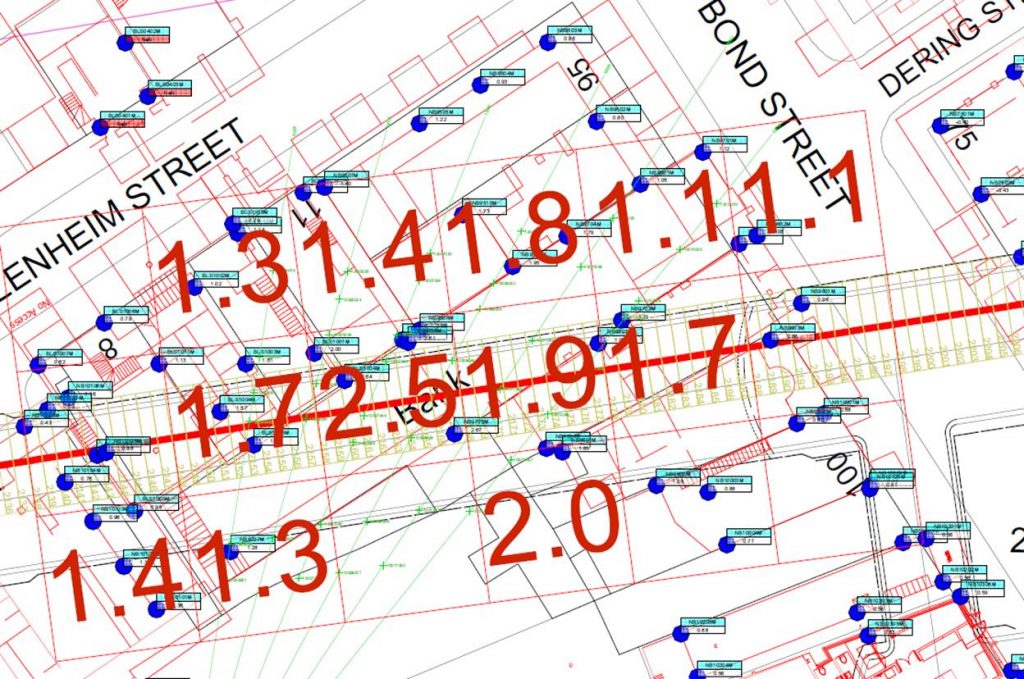
Figure 21 – Heave values in mm for a grouting shift
Conclusion
By maximising the available monitoring software technology and expanding it beyond its user end requirements it is not only possible to deliver a high class product which keeps both the client and site engineers well informed of all on-going geotechnical and structural deformations but also ensures that asset protection engineers and third party stake holders are provided with sufficient information to demonstrate the safety and security of their assets. By separating the available data into separate sites users are able to only view that which is important to them improving reaction times.
Integrating critical activities such as Compensation Grouting, which requires a high degree of control and data feedback provides the end user with confidence. The adaptability of software to meet the end user needs and provide more mobile data opportunities is crucial for future projects that contain Instrumentation and Monitoring.
Abbreviations
TBM – Tunnel Boring Machine
SCL – Sprayed Concrete Lining
I&M – Instrumentation and Monitoring
SRG – Shift Review Group
CTC – Contractors technical committee.
UCIMS – Underground Construction Information Monitoring Systems
AGS – Association of Geotechnical and Geoenvironmental Specialists
BIM – Building Information Modelling
FTP – File Transfer Protocol
TaMs – Tubes-à-Manchettes -
Authors

Daniel Rendell - Getec UK
Civil Engineering Contracts Engineer, Getec UK
Paul Thurlow - Getec UK, Keller Getec ITMSoil JV
General Manager, Getec UK