Depressurisation and surface settlement at Vallance Road Garden, Whitechapel
Document
type: Technical Paper
Author:
Alessandra Colace, Dr Alfred Stärk Dipl Ing Dr Ing, ICE Publishing
Publication
Date: 07/09/2015
-
Read the full document
Geology and Depressurisation System
Site investigation
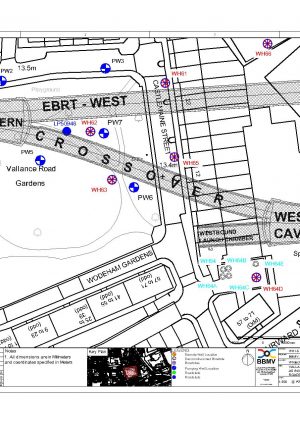
In 2011 BBMV C510 Joint Venture was awarded the contract for the construction of the Vallance Garden Crossover tunnel. Originally the Crossover was located in Fisher Street, but in 2011 it was relocated to the Vallance Garden area. Due to a lack of geological information a total of 9 bore holes were drilled during summer 2012 (WH58 to WH66). Figure 2 shows the plan view of Vallance Garden Site investigation. Bore hole WH59 had to be drilled twice (WH59a) due to design change of the Cavern Eastbound clashing with the originally drilled WH59. At the location of borehole WH64 an obstruction was encountered at 2.6mbgl which necessitated multiple drill attempts.
The site investigation led to a surface depressurisation scheme for the SCL tunnelling works which is described in detail within this paper. A further purpose of this paper was to investigate any relation between surface settlement and depressurisation in the Vallance Garden area.
Geology
Particular attention was given to Sand Channels within the Lambeth Group Formation. These were encountered at or immediately below the Eastbound Running Tunnel West (EBRT-W), Crossover tunnel and the Eastbound Cavern. The Sand can contain confined water. To investigate the water pressure a vibrating wire piezometer was installed in each sand layer which confirmed the presence of water within granular horizons in Lambeth Group Formation. Ground water readings were taken since September 2012.
Geological Strata Average Depth Range (mATD) Average Depth Range (mbgl) Made Ground 113.40 – 108.30 0.00 – 5.10 River Terrace Deposit 110.60 – 104.40 2.80 – 9.00 London Clay Formation 107.00 – 77.48 6.40 – 35.92 Harwich Formation 80.77 – 78.68 32.63 – 34.72 Lambeth Group Formation 80.75 – 60.90 32.65 – 52.50 Thanet Sand Formation 60.90 – 57.90 52.50 – 55.50 Table 1 – Geology 1
Table 1 highlights a depth range of all geological strata encountered during site investigation.
The Crossover tunnel extends from 78.2 to 92.3 m above Tunnel Datum (m ATD) by the side of the Eastbound Cavern and from 80.6 to 94.8 mATD at the Westbound Cavern. The Eastbound Cavern extends from 92.2 and 78.6m ATD. In this area sand channels were encountered between circa 80.35 and 72.64m ATD.
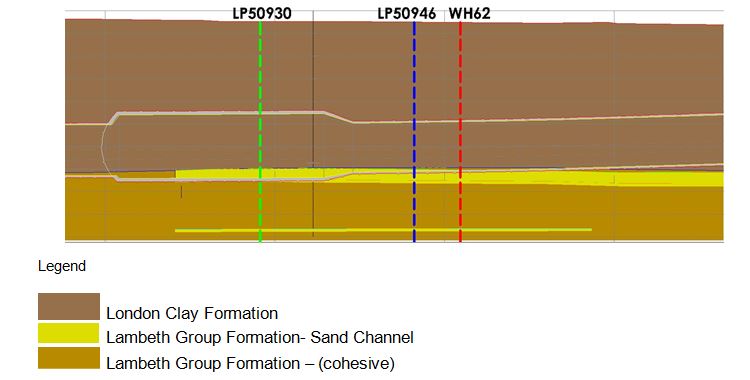
Figure 1 – Eastbound Running Tunnel geological cross section with projections of bore hole WH62 and roadstuds LP50930 and LP50946

Figure 2 – Location of bore holes and wells in Vallance Garden area
Pumping test and Commissioning tests
Following the site investigation a provisional depressurisation scheme was designed and as a result well PW7 was drilled. PW7 was constructed between 3rd and 11th of December 2012 and a three-day pumping test was performed between the 14th and 17th of December 2012. (See table 2 for details of the test).
The pumping test revealed a considerable flow rate of 2.6 to 2.4 l/s during the last two days, and a drawdown of nearly 5m.
The pumping test also confirmed the effectiveness of a surface depressurisation system. A further 7 wells (PW1 to PW6 and PW9) were drilled between the 21st of January and 6th of March 2013 covering the area of the Crossover tunnel.
A series of commissioning tests were performed in order to investigate the performance of the depressurisation system.
PW8 was located within the construction site of Durward Street Shaft of contract C512 which was not accessible at that time. During the commission tests the depressurisation system proved to be successful without PW8, therefore its construction never occurred. Due to the change of design of the Cavern Eastbound PW4 had to be redrilled, becoming PW4a.
Duration of test Pumping period Wells pumped Flow rate Average Drawdown Average 3 days 14 – 17.12.2012 PW7 0.24 l/s (-0.8 bar vacuum) 4.93 m 7 hours 07.05.2013 PW1 to PW7 1.7 l/s (-0.5 bar vacuum) 11.13 m 10 hours 21.05.2013 PW1 to PW7 and PW9 2.2 l/s (-0.7 bar vacuum) 5.82 m 3 days 22 – 25.07.2013 PW1 to PW7 and PW9 2.01 l/s, (-0.7 bar vacuum) 1.74 m Table 2 – Pumping test and Commissioning tests
A general pre-pumping standing water level in the Lambeth Group Formation was observed to be approximately 87.1 to 89 mATD. All pumping tests showed a rapid falling of the water level within a few hours. At the end of each test, the water level rose quickly but never completely recovered, remaining below initial level.
This statement is with the exception of WH60. Its data appeared to be erroneous and unreliable; therefore its readings were not taken in consideration. Table 2 shows details of both pumping and commissioning tests.
Depressurisation due to tunnelling
As tunnelling excavation was approaching the Vallance Garden area the depressurisation system was switched on. Tables 3 and 4 show details of pumping periods and flow rate average.
Tunnel Pumping period Flow rate average Bypass Enlargement 16.10.2013 – 02.11.2013 1.13 l/s EBRT-East Enlargement 10.12.2013 – 13.12.2013 1.29 l/s EBRT-West Enlargement 28.01.2014 – 03.04.2014 0.82 l/s EBRT-West Enlargement
Crossover
Eastbound Cavern
30.04.2014 – 17.09.2014 0.71 l/s Table 3 – Pumping due to tunnelling
Tunnel Excavation period Flow rate average EBRT-West Pilot Tunnel
(Adv 1 to 24)
06. – 19.12.2013 0.33 l/s EBRT-West Enlargement
(Adv 1 to 29)
07. – 17.01.2014 0.01 l/s EBRT-West Pilot Tunnel (Adv 25 to 98), (zone of influence: Adv 67 on 27.01.2014 and Adv 98 on 04.02.2014) 18.01.2014 to 04.02.2014 0.30 l/s EBRT-West Enlargement
(Adv 30 to 134)
05. – 24.02.2014 1.03 l/s EBRT-West Pilot Tunnel
(Adv 99 to 200 end)
24.02.2014 to 26.03.2014 0.78 l/s EBRT-West Enlargement
(Adv 135 to 273 end)
06.05.2014 to 19.06.2014 0.78 l/s Crossover Pilot Tunnel 16.05.2014 to 07.06.2014 0.71 l/s Eastbound Cavern 21.06.2014 to 25.08.2014 0.65 l/s Crossover Enlargement 12.07.2014 to 09.09.2014 0.63 l/s Table 4 – Periods of tunnel excavation
Surface Settlement
General
Sixty four road studs were installed in the Vallance Garden area and were monitored commencing in November 2011.
The first stage of this work was to analyse the surface settlement for specific behaviour. It turned out that the roadstuds in comparable areas, i.e. close to excavation or far away from it, showed a similar behaviour. For further investigation two representative roadstuds have been chosen: LP50930, in the far south-east corner of Vallance Road Gardens furthest away from excavation and depressurisation, and LP50946, in the “heart” of excavation and depressurisation. Location of these two road studs is shown on figure 2.
Further, all piezometer readings have been compared against each other. With exception of WH60 all piezometers showed a similar trend. The upper piezometer in borehole WH62, located in the centre of the depressurisation, appeared to be representative for further analysis.
The second stage was a detailed analysis of the surface settlement of the two roadstuds against depressurisation periods and the development of the water level in bore hole WH62 which is discussed below.
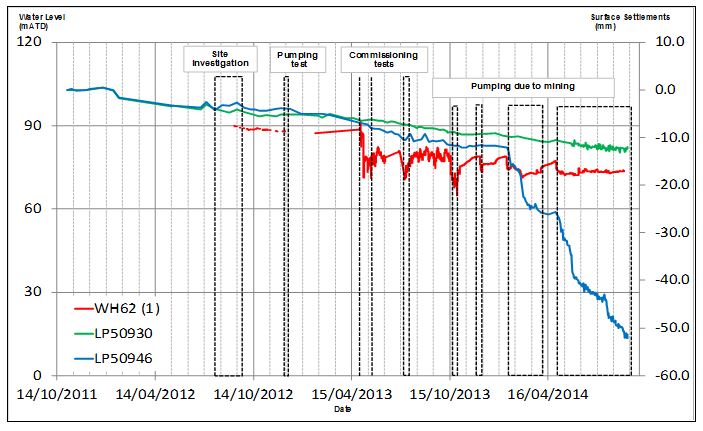 Figure 3 – Ground water readings Vs surface settlement
 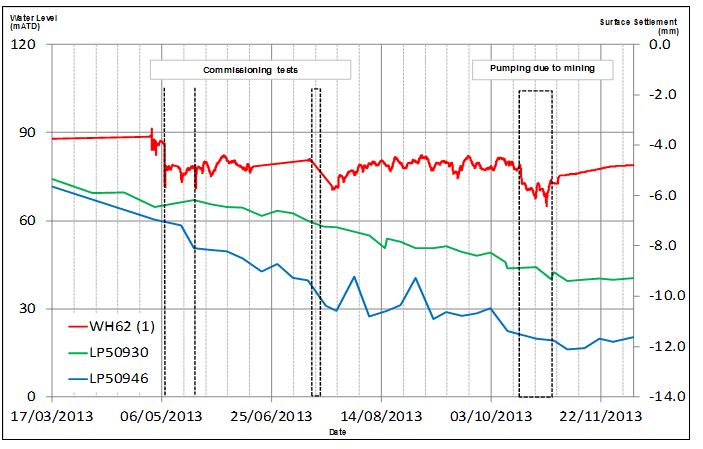 Figure 4 – Details of ground water readings Vs Surface Settlement
 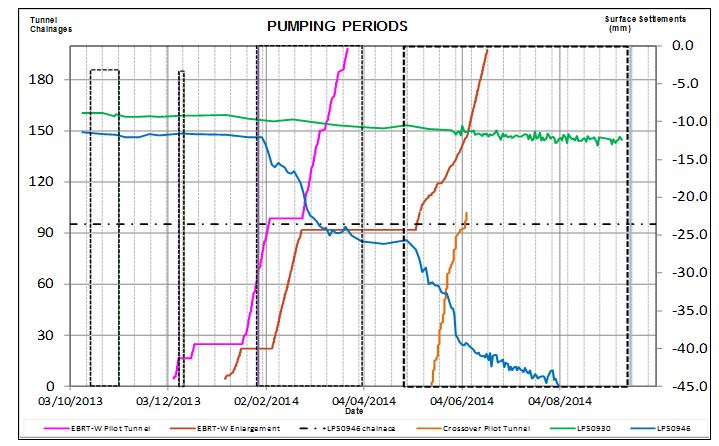 Figure 5 – Details of surface settlement Vs tunnelling excavation
Comparing surface settlement with periods of depressurisation
In figure 3 the horizontal axis represents the time and the vertical axis represents the water level in mATD. The secondary vertical axis represents surface settlements in millimetres. The vibrating wire piezometer installed in the shallowest sand layer in bore hole WH62 is shown in red. Roadstud LP50946 (which is the closest to WH62) is blue in colour and LP50930 (which is the furthest to WH62) is shown as green.
Periods of site investigation, pumping test, construction of wells, commissioning tests and pumping due to mining are highlighted with dashed lines or dashed squares.
Interestingly both of the roadstuds show a general and similar trend of settlement from the outset. Moreover, this trend continued in the distant roadstud LP50930 over the entire observation period of nearly three years, from early November 2011 to early September 2014; no end or fading is visible. This trend is almost perfectly linear; it is not disturbed by site investigation or pumping, neither by the excavation of the adjacent Crossover Tunnel or the huge Eastbound Cavern (one of the biggest excavations ever built in London Clay). Initially LP50946 also shows a linear trend, not unduly influenced by site investigation; however this linear settlement lasted until beginning of May 2013.
This initial settlement appeared to be a regional feature, considering that it could be observed nearly everywhere at the Whitechapel Station which Vallance Crossover is part of. However, the cause of this initial settlement occurred in May 2013, remains unknown for the time being. Though unsatisfactory in terms of analysis, at present, there is little more we can say.
A deviation of these two points is visible from the beginning of May 2013, roughly 10 days before the beginning of the commissioning tests (Figure 4). The settlement at that time is in the order of 6.2mm and 7mm respectively for road studs LP50930 and LP50946. This deviation increases after the first commissioning test but the difference in settlements, between the two road studs, remains constant from the last commissioning test until the influence of the excavation. There was no other activity in the Vallance Gardens at that time except for the commissioning tests. Therefore, this difference in settlements of roughly 2.0mm to 2.5mm could be associated to pumping influence.
A look at the water level shows that a drawdown of some meter was achieved within hours after pumps were switched on. On the other hand, the water level recovered within the same time. After the first commissioning test the water did not recover to the original level, but thereafter each previous level was almost reached after some time. This indicates that a good recharge of water was available all the time; hence not much space for empty voids and pores to be compressed by settlement. This is supported by the flow, which remained fairly stable during pumping (not shown on the graphs).
Comparing surface settlement with periods of pumping
In order to identify any anomalies in settlement during excavation, which may have been caused by depressurisation, surface settlement against progress of excavation have been plotted in Figure 5. In Figure 5 the horizontal axis represents the time and the vertical axis represents the tunnel chainage of the excavation face. The excavation progress for the EBRT-West Pilot Tunnel is shown in red; the one for EBRT-West Enlargement is shown in brown. The secondary vertical axis represents surface settlements in millimetres. Road stud LP50946 (which is the closest to WH62) is blue in colour and LP50930 (which is the furthest to WH62) is shown as green. The location of LP50946 is shown as a horizontal dashed line at Chainage (Ch.) 95.
Periods of depressurisation due to tunnel excavation are also shown by black coloured dashed boxes. Depressurisation was active for about 3 weeks from mid-October 2013 to early November 2013, for 4 days in mid-December 2013, from end of January 2014 to early April 2014 and from end of April 2014 to mid-September 2014 (see also Table 3). During the two periods of depressurisation in 2013 no influence is visible on the settlement of the road studs.
From experience at Whitechapel Station and Liverpool Street Station (the other BBMV C510 construction site) it is known that surface settlement will start approximately 15m to 20m ahead of an approaching excavation face. The influence of excavation fades out after the excavation face has moved approximately 15m to 20m away from the monitoring point and it lasts for another approximately 10m until it turns into a constant long term settlement. In essence, the zone of influence reaches roughly from +20m to -30m ahead and behind the monitoring point. This influence has been observed in areas without any depressurisation at all.
The magnitude of surface settlement was expected to be in the order of ca. 10mm for the Pilot Tunnels and of ca. 20mm for the Enlargements. The measured displacements confirmed these figures at both stations, Whitechapel and Liverpool Street.
Both excavations of the Bypass Enlargement and the EBRT-East tunnels were at least 90m away from LP50946, too far to have any influence. Remarkably, the three-week period from mid-October 2013 to early November 2013 (the longest pumping period to that time) had no influence on the settlement.
A significant increase of settlement is noticeable for LP50946 since the end of January 2014 which relates to the approaching face of ERBT-West Pilot Tunnel. Settlement starts with the excavation face at round chainage. 75, nearly exactly 20m ahead of LP50946. The excavation of the Pilot Tunnel stopped temporarily at chainage. 99, just 4m after it had passed LP50946. LP50946 showed an increase of settlement by ca. 5mm. The Pilot Tunnel excavation was followed by the Enlargement up to chainage. 92, 3m ahead of LP50496. The Enlargement contributed to another 5mm of settlement. Following the Enlargement the second stage of EBRT-West Pilot Tunnel excavation was done to the end, with 4mm of additional settlement. Finally, the second stage of Enlargement was completed adding another 15mm (see table 4 for details). During that time the Crossover Pilot Tunnel also started, which entered the zone of influence in mid-May. At this time the influence of the EBRT-West Enlargement was already fading out, mid to end of May (visible in Figure 5). The second stage of EBRT-West Enlargement added another ca. 7mm. The exact impact of the EBRT-West Enlargement cannot be numbered due to the interfering Crossover Pilot Tunnel. However, it can be expected that the influence of the second stage of EBRT-West Enlargement has not exceeded 10mm. The total settlement due to both stages of EBRT-West Pilot Tunnel is 9mm and ca. 15mm due to the two stages of Enlargement. Both values are in line or even less with settlements in other no depressurised areas.
All following excavations, Cavern Eastbound and Crossover Enlargement, have been done simultaneously, so that the settlement of the individual tunnel cannot be determined.
However, up to mid-May 2014 no influence due to long lasting depressurisation (since end of January 2014) can be identified.
Summary and conclusion
The surface settlement has been compared with depressurised and non-depressurised zones within the Vallance Road Garden area. The comparison has been made with remote monitoring points close to the Vallance Garden as well as with overall experience of settlement in the Whitechapel Station and Liverpool Street Station areas.
Vallance Road Garden showed the same regional steady settlement occurring before the start of any site investigation and any construction activities.
The response to excavation of both, EBRT-West Pilot Tunnel and Enlargement, is in line with non-depressurised areas elsewhere on this project.
The only influence from depressurisation could be observed after the initial commissioning test in May 2013. The monitoring data suggest this influence to the order of 2.0mm to 2.5mm. This seems to be a fairly minor effect considering a total settlement after completion of all excavations in the order of 50mm.
The authors believe that these findings can be transferred to other areas of depressurisation given a similar geology.
References
[1] BBMV C510 Joint Venture (2011 – 2014). Monitoring data for surface settlements and vibrating wire piezometers.
-
Authors


Dr Alfred Stärk Dipl Ing Dr Ing - BeMo Tunnelling
Dr Alfred Stärk is Chief Geotechnical Engineer and Engineering Manager at BBMV for Crossrail Contract 510 ‘Whitechapel and Liverpool Street Station Tunnels’ since March of 2011. He started his career at the University of Hanover, Germany, where he worked as assistant professor and consultant for 10 years. In 2002 he joined BeMo Tunnelling, Innsbruck, Austria. He now has 25 years of experience in large-scale tunnelling, mainly with sprayed concrete lining in soft ground.
