Digitisation of Signalling and Train Test Log Observations
Document
type: Micro-report
Author:
Bernard Fanning MAPM
Publication
Date: 05/10/2020
-
Read the full document
Introduction and Industry Context
Often system integration and engineering outputs on major projects are vast and it is difficult to decipher the impact on the programme or project quickly. Crossrail is no exception as it is a complex programme which requires breaking down into more manageable pieces in order to achieve effective programme and project management. System integration testing involves bringing together multiple moving parts and it can be confusing to know where and how to start. The programme collects vast amounts of data throughout the testing phases and has had to develop processes and systems to quickly and effectively organise and prioritise the right information to ensure it gets to the right people at the right time.
Implementing the Testing Information Management System
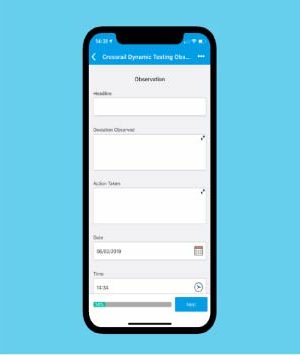
At the beginning of the Testing and Commissioning phase of Crossrail it was initially anticipated there would be six months of Dynamic Testing with test trains running five days a week. The engineering management and testing teams required quick insights from the testing observations on site. Existing processes were archaic and it wasn’t easy to get visibility of testing observations from site to office in a timely manner. The solution developed and implemented was an app for the testers to log observations live from site/train using their mobile or tablet. The form captured data whilst offline, which was key when testing in the tunnel prior to the Wi-Fi set up, and once connected to the internet, fed the data into an online visualisation tool where the data was displayed as information on various dashboards. It was known as the Testing Information Management System (TIMS).
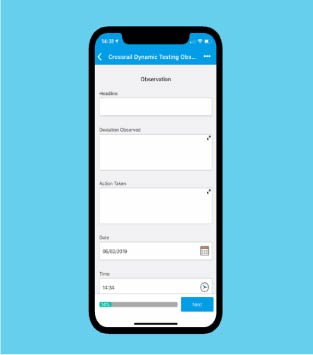
Figure 1 – Image of the Testing Information System (TIMS) input form (Mobile/Tablet app)
Both the app and dashboards could be configured to meet the end user requirements. The TIMS took 4 weeks to implement and enabled;
- More efficient test logging which was less costly as test engineers were reviewing logs not processing data for reporting
- Improved quality and integrity of information captured
- Identification of headlines suitable for management attention
- Timely management intervention.
The Chief Engineer had identified the requirement for a more effective triage process and was investigating a solution which involved bringing all defect management in house. We developed a remit in collaboration with the testing team, engineering department and signalling teams to determine what was required within the 6 months of Dynamic Testing that was anticipated. Of the 3 requests for proposals the 2 companies that provided tender returns were vastly different. The first was the entire defect resolution system with a team to manage the data, clean it and input which would have taken c. 3 – 6 months development prior to implementation. The other solution was the TIMS which as described was a less intrusive solution which integrated the suppliers existing proprietary systems and had minimal upkeep costs. The first proposal was almost 4 times more expensive and anticipated to take four to six months longer. The speed of implementation was achieved through using licenced systems where no coding was required. Both the app and dashboards were highly configurable and the supplier integrated one solution with the other to ensure they worked seamlessly.
Lessons learned
1. Create a common form
Prior to the TIMS each team had their own version of a test log some of which were hand written and others captured on Word or Excel. The teams would transfer the data to a spreadsheet for analysis and then to PowerPoint for reporting. This transfer of data incurred delays between the time an observation occurred and management getting visibility of it. There was more likely for there to be error in the data if there is misinterpretation or a mistake made in the transfer of data from the logs to the spreadsheet. The TIMS created a single Crossrail Observation Log form (App) which was consistent in look and feel and contained reference data for the teams to select reducing the possibility of error in data entry. Once completed the logs were pushed to the online dashboard.
All logs allocated in less than 24 hours
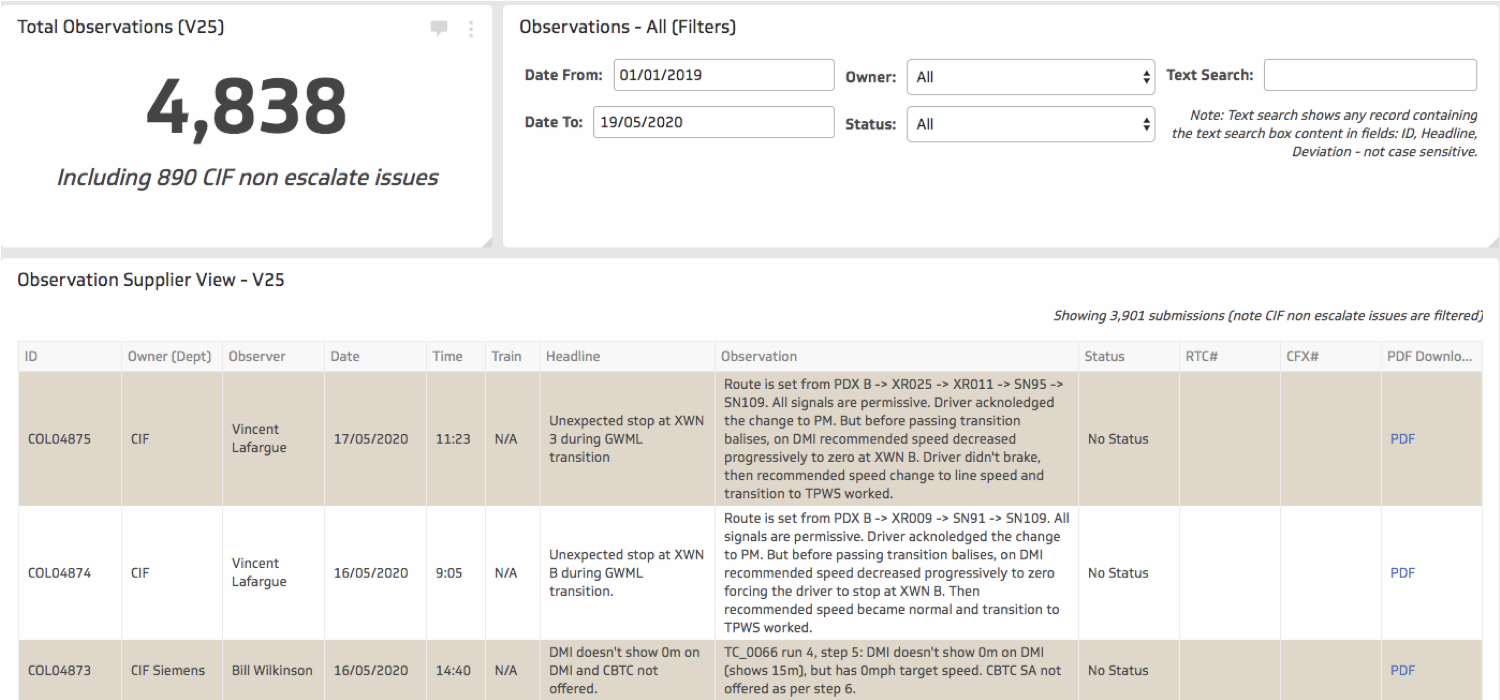
This gave the engineering teams reviewing the observations immediate visibility of the testing observations as they were submitted in a way they had not had previously. Through this the team were able to allocate every test log to a supplier for resolution in less than 24 hours.
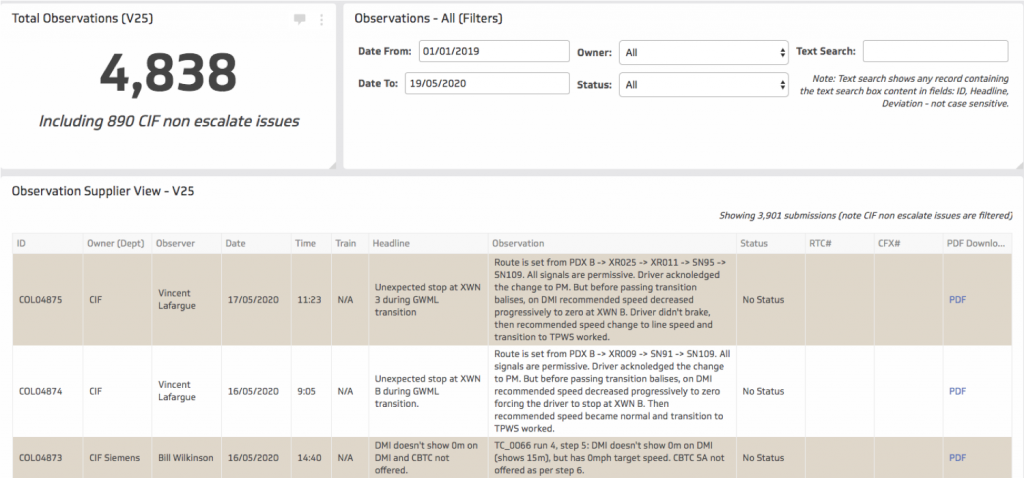
Figure 2 – Online dashboard showing data logged from on-site and off-site testing immediately which can be accessed from anywhere
2. Use reference data
By implementing a consistent observation form with reference data across the suppliers, it significantly enhanced the integrity of the data collected from site. The possibility of data transfer errors was significantly reduced. An example of this would be that previous entries for the testing location Abbey Wood could have been entered or written as; ABW, ABX or Abbey Wood making it difficult and time-consuming to analyse the number of logs raised at that location. By creating drop down menus with consistent nomenclature across all testing teams the integrity of the data was improved allowing for better, quicker reporting and real-time analysis of issues. The dashboards were highly configurable to provide the testing teams with the insight they required.
Train the end users in the use of dashboards
However, as the management teams were not entirely comfortable or necessarily used to online dashboards for reports there was a lack of trust in using them. Therefore, quite often the test log data was downloaded directly from the cloud storage area and pulled into various spreadsheets to provide the teams with the feeling of control for reporting purposes. Because of this the full efficiencies through automated reporting were not realised.
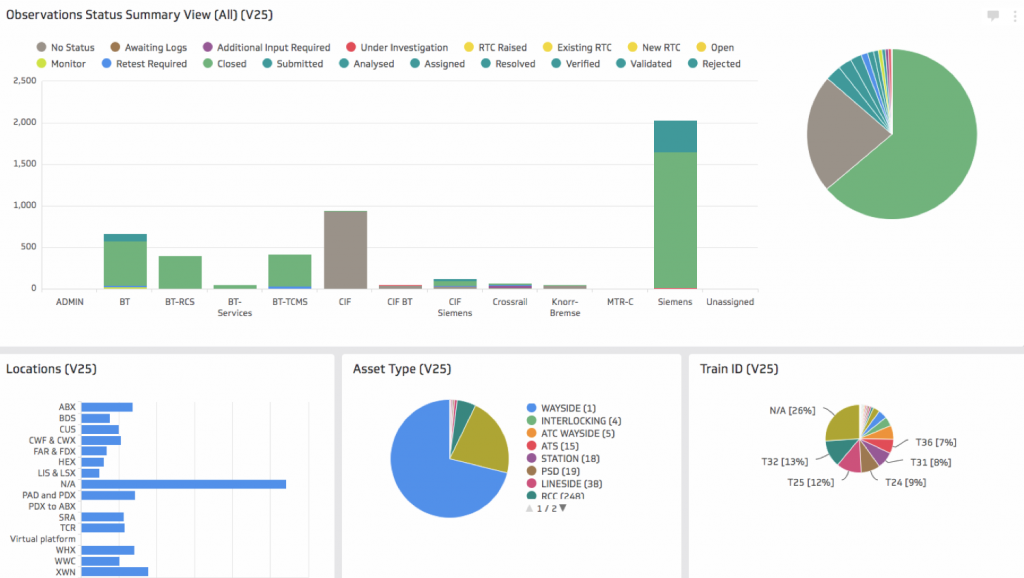
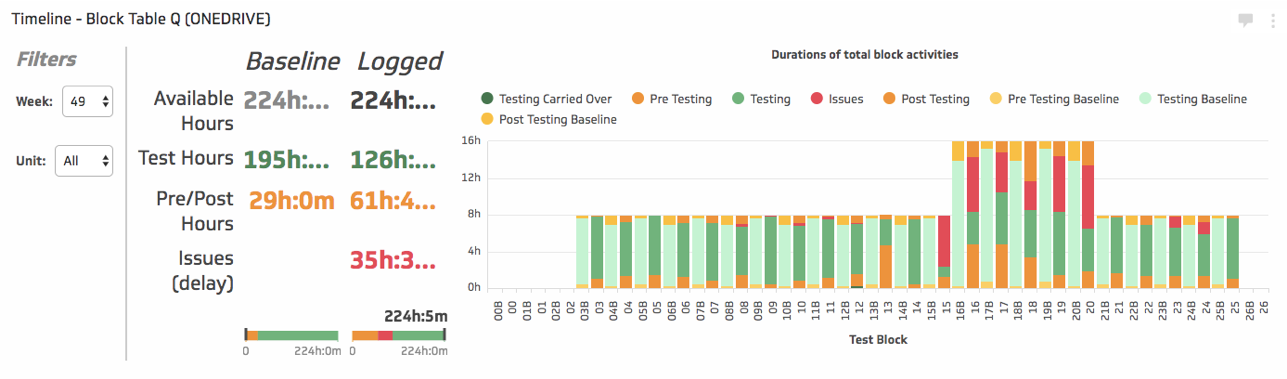
Figure 3 -instant online dashboards produced from the app data
3. Flexibility
Even though licenced products often have a higher cost base using licenced products as a short to medium term solution means that the implementation and flexibility in the style, layout and configuration of the app user interface and outputs is quick to implement and highly configurable which in turn builds confidence in the app among the testing teams. They felt that they could influence the structure of the TIMS therefore improving the speed in which the TIMS was adopted for testing purposes.
Consider whether the solution could be developed in house
Having a 3rd party supplier own the licence relationships and managing the interface between the app and dashboard did also bring constraints for the testing team. They felt that without the 3rd party supplier controlling the app and dashboards they could have got more efficiency out of the TIMS.
4. Quick wins
Allowing the suppliers to retain their own defect resolution software facilitated a quick implementation and didn’t have significant contract implications. It also avoided the requirement for a large-scale IT project to bring in a “one-stop shop” for testing observations and defect resolution. The TIMS is un-intrusive to proprietary supplier systems as it did not change their existing defect management processes but created a relationship between the TIMS Crossrail Observation Log (COL) unique identifier and the unique identifier that the supplier holds in their defect resolution systems to track their defect through to fixes and then to software releases.
Consider open data sharing between parties
Linking the two provided Crossrail with an oversight of Test Log Resolution progress which was verbally provided prior to the TIMS. The TIMS was implemented in 4 weeks from contract being let.
5. Multiple Uses
Once the concept of app collection and automated, instant online dashboard visualisation was witnessed by other teams there was an appetite in other areas of the business to capitalise on the effectiveness and efficiencies witnessed in the on-site signalling and train on-site testing. Subsequently the off-site simulator team and the testing logistics and management teams developed their own apps and reporting tools.
Continuously review and improve, be creative with your implementation
Once you implement a solution for a fixed purpose consider other areas of the business which would benefit from consistency and automation. This enables teams to be more effective as they are managing based on information rather than chasing data to produce information and reports to enable management.

Figure 4 – The logistics team created a timeline and issue logging app and visualisation to provide information to the business on their testing efficiencies during test windows
Recommendations for Future Projects
- Consider the processes, procedures, systems and tools that the project or programme is using to manage and control the programme. Are they outdated or inconsistent across teams? Consider if there are modern alternatives that could reduce the administrative workload from critical resources.
- For testing and commissioning consider the development of a data repository for all test logs including machines logs to be stored and queried from for reporting purposes. The limitation of the TIMS is that the cloud storage of the observation app doesn’t work like a database and therefore lots of additional spreadsheets were produced to enable teams to configure the information to get the answers they require.
-
Authors

Bernard Fanning MAPM - Crossrail Ltd
Bernard is Programme Manager – Trial Running at Crossrail.
Bernard is an experienced project and programme professional with 10 years’ experience in delivering major rail infrastructure. He has an innovative approach demonstrated in the work he did on Crossrail 2’s Hybrid Bill development in 2015 establishing a robust BIM process and later in Crossrail’s testing and commissioning 2018 – 2020 where he changed the way in which signalling testing observations were captured. He was able to encourage both projects into a more digital and efficient way of working. He has a data-centric approach to work in order to minimise non-value add work.