Ground Settlement Behaviour In Chalk Due To TBM Excavations
Document
type: Technical Paper
Author:
Mark Cheng, Patryk Mikulski, ICE Publishing
Publication
Date: 03/11/2014
-
Read the full document
Introduction
Crossrail is a new high-frequency, high-capacity railway with route running over 100 km from Maidenhead and Heathrow in the west, through central London to Shenfield and Abbey Wood in the east (Figure 1).
The £200 million contract C310 of Crossrail is part of the Crossrail project which will link the east and west London rail routes. The C310 contract is unique for whole Crossrail project as it is the only one using mix-shield tunnelling boring machines (TBMs) with slurry face support. The construction works comprise the construction of the 430m long Plumstead portal, 390m North Woolwich portal and the 2.6 km twin-bore Thames Tunnel between Plumstead and North Woolwich, also known as Tunnel Drive H.
The Thames Tunnel, which will be predominantly constructed through chalk, will use Slurry TBMs. The main tunnelling works started at the beginning of 2013 with the launch of the first slurry TBM Sophia with a diameter of 7.12 m at westbound tunnel on 14th Jan 2013, and the second TBM Mary launched at eastbound tunnel on 22nd May 2013. Westbound and eastbound TBMs arrived at Woolwich box respectively on 15th May 2013 and 12th August 2013. It is anticipated that the tunnelling works will be completed in October 2014.
Assessing tunnelling-induced ground loss is a major issue when predicting ground movements and their effects on adjacent structures. This paper is to study the settlement observed from the monitoring instrumentations between Plumstead portals and Woolwich station, and compared with the settlement values predicted by the Xdisp software, which calculates the tunnelling-induced settlement of assumed volume loss (VL) and trough width parameter (K), primarily under a normal probability (Gaussian) distribution theory.
Tunnel Alignment
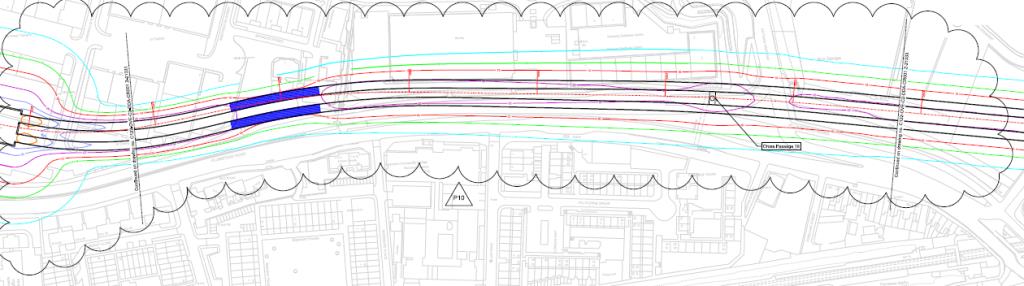
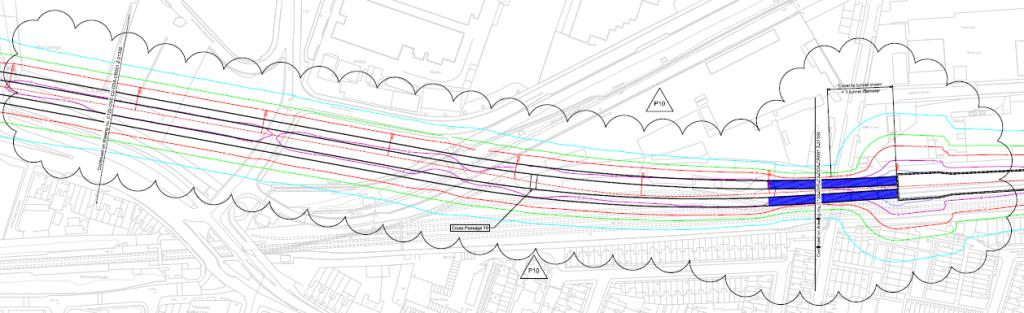
C310 contract relates to Drive H Thames Tunnel located at the east end of the Crossrail alignment (Figure 1). The Thames Tunnel covers the two running tunnels from North Woolwich portal to Plumstead portal, including four cross passages. The total length of two tunnels is about 6 km including the cut and cover sections of North Woolwich and Plumstead portals. Maximum ground overburden along route is 22.8 m and deepest point is 24.1 m below sea level, beneath the river Thames. The alignment is passing through river Thames, Woolwich station box, Southern Outfall Sewer, Dockland Light Railway tunnels and below 12 listed buildings within zone of influence. This paper covers only half of the route from Plumstead portal to Woolwich station (at the time of the paper writing, the TBMs are at Woolwich station box.
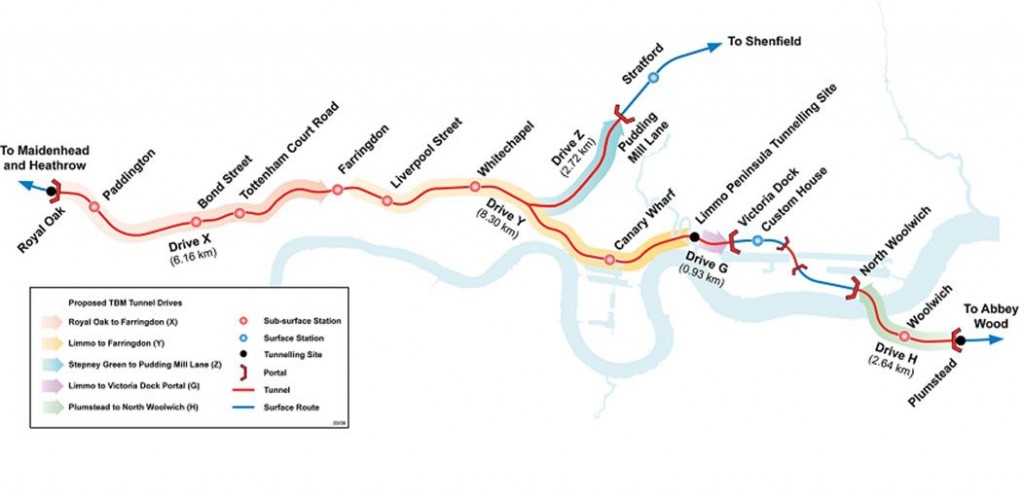
Figure 1 – Crossrail Running Tunnel Alignment and Drives
Tunnel Characteristics
The tunnels are constructed by two identical mixed-shield Slurry TBMs with a cutter head extrados of 7.12 m. The TBMs with slurry face support can partly or completely replace the slurry by compressed air for maintenance work, and it has an outside diameter of 7.12 m and forms a tunnel with an inner diameter of 6.20 m. The slurry, which consists of water and bentonite or clay, is selected depending on the ground conditions. The bentonite-soil mix is hydraulically transported out of the tunnel by pipes to be separated into liquid andsolid parts (Maidl et al, 2011).
The tunnels are designed as segmentally lined with universal ring. One ring consists of eight segments 1.6 m long, 300 mm thick, reinforced with steel fiber concrete. A total of 1,636 rings were installed for two tunnels between Plumstead portal and Woolwich station. Due to technical constraints on site, only one TBM is under operation during the tunnel constructions. The westbound drive has been built first before the eastbound drive. The average advance rate for first drive was 6 to 7 rings per day and for second drive the average was 10 rings per day. The difference between averages is probably due to the learning curve of the first drive where the TBM team gained experience in site specific soil conditions.
Ground Condition
Ground investigations along the route alignment between the Isle of Dogs and Plumstead have been undertaken by Crossrail and the data are summarised in the Crossrail Geotechnical Sectional Interpretative (May 2007). This report is based on borehole investigations, historic boreholes, piezometers analysis, laboratory tests, etc. which were undertaken between 2003 and 2007.
The longitudinal geological ground profile along the running tunnels alignment of Drive H is shown in Figure 2. The general geological stratum sequence from the ground level between Plumstead portal and Woolwich station is: made ground, alluvium, river terrace deposits (RTDs), Thanet sand (TS) formation and chalk.
Tunnelling has started from Plumstead portal at chainage 22556 in the RTDs and the underlying Thanet sands. The chalk horizon will be met after 100 m. The mixed stratum conditions end at chainage 22300. The tunnel is situated completely in the chalk until chainage 21600 where Thanet sands are encountered again. Between this chainage and Woolwich box at chainage 21250, mixed stratum conditions are present. Approximately 100 m before reaching the Woolwich box the tunnel is situated completely in the overlying Thanet sands.
Brief descriptions of the encountered stratum are given below. RTDs are well graded sand and gravel with clayey/silty sand sediments occurring locally as discontinuous beds, and cobble sized gravel may be present. Thanet sand maximum thickness is 15 m. Generally comprises of two main beds: homogenous silty fine to medium sand with increasing clay/silt content in lower part of the formation and bullhead beds, discontinuous thin layer of rounded course flint gravels with cobbles in sandy clay matrix. Chalk is the major strata present along whole C310 route. The chalk group in England is divided into two sub-groups, grey and white chalk, which in turn are divided into a number of formations. Along the drives, the chalk belongs to the Seaford chalk formation of the white chalk. The Seaford chalk formation comprises three distinct beds: the Tout beds, the Cuckmere beds and the Haven Brow beds. All three beds were encountered within boreholes. However the Tout beds are not along tunnel alignment. Encountered chalk is described as white, off-white or cream coloured, medium density, weak to moderately weak fractured chalk with flint bands, occasional marl seams.
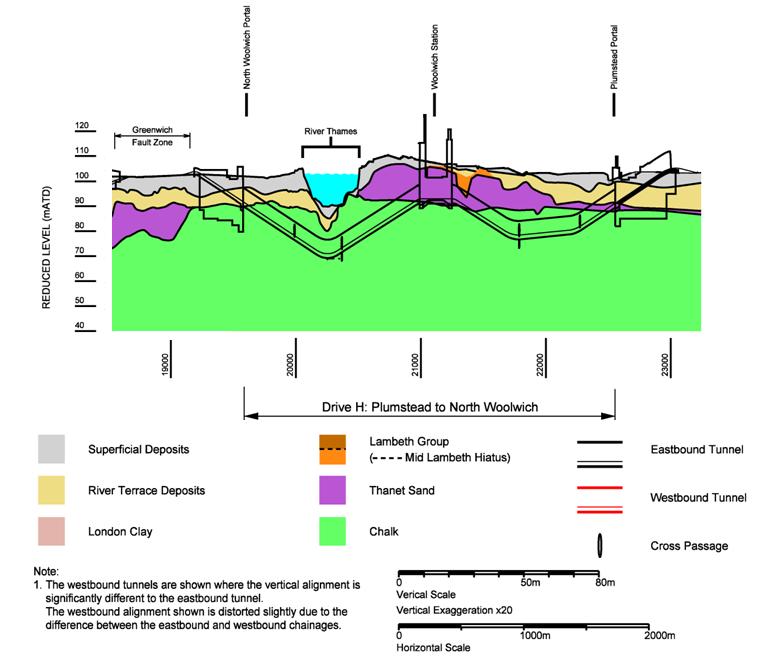
Figure 2 – Longitudinal Geological Section along the C310 Tunnel Drives
Empirical Ground Movement Prediction
For the prediction of the tunnelling-induced ground vertical movements, the methodology described in Crossrail Civil Engineering Design Standard (CEDS) Part 7 Ground Movement Prediction (2010) is adopted. The report states two empirical methods for the ground vertical settlements:
- O’Reilly and New (1982) appropriate for predicting the surface movements where the ground overburden is greater than one tunnel diameter above the crown of the tunnel;
- New and Bowers (1994) appropriate for predicting surface and sub-surface movements where the ground overburden is within one diameter of the crown of the tunnel.
It is noted that the locations where the tunnel with ground cover less than one diameter of the tunnel are close to the portal and station, and the ground movements have been highly affected by the TBM launching and landing at these locations. The first method is therefore adopted and discussed in this paper. Based on the O’Reilly and New (1982) method, the shape of the surface vertical settlement can be represented by a Gaussian error equation:
S=Smaxexp(-y^2/2i^2) (1)
where
S is the surface settlement at a distance y from the tunnel centre line,
Smax is the maximum settlement at y=0,
i is the standard deviation of the curve.The value of i defines the trough width and corresponds to the value of y at the point of inflexion of the settlement curve. For practical reasons it can be defined as product of trough width parameter (K) and depth of the tunnel.
In this project, Oasys software Xdisp V19.1 has been used to analyse the ground movement induced by tunnelling and portal/box excavations, complying with the empirical method by O’Reilly and New (1982). Ground modelling in Xdisp has been developed in accordance with the requirements of CEDS part 7 and 8. The user is required to define the estimated volume loss (VL) above the tunnel due to deformation, as well as the trough width parameter and tunnel geometry. Xdisp will then use this to define the settlement profile at the surface or specified depth. The input parameters for the generic settlement assessments of the Drive H are:
- Running tunnel (excavated) diameter = 7.18 m
- Trough width parameter, K = 0.5
- Volume loss for running tunnels, VL = 1%
- Homogenous ground conditions
Volume loss is the ratio between volume of excavated material and theoretical tunnel volume. It causes settlements at the ground surface with the same volume. For the Crossrail project, CEDS Part 7 states that the default moderately conservative assumption of volume loss for running tunnels (ii) is 1% along the entire route of Drive H. For the areas designated as ‘controlled tunnel drive zones’, the target volume loss is specified as at a reduced rate of 0.5%. There are two areas along H drive defined as controlled zone. The first area is located between chainage 22600 and 22500, where the ground cover to tunnel crown is less than one tunnel diameter, and critical assets – Cathedral Substation and White Hart Road Bridge are located. The second area is between chainage 21520 and 21450, where critical assets – Middlegate House (supported by combination of shallow and piled foundations), Southern Outfall Sewer and Docklands Light Railway tunnels. It is noted that both Cathedral Substation and Middlegate House have been strengthened by grouting compensation before and during the TBM arrivals, and they are not studied in this paper as their settlement behaviour has been affected by the grouting.
The results of the predicted tunnel included surface movement (with 1% VL and 0.5% VL at the controlled zone) over the H drive alignment are shown in Figures 4 and 5. The maximum predicted surface settlement contour are up to 20 mm for tunnelling excavations and 50 mm for both tunnelling and portal excavations.
Observed Ground Movements and Back Analyses of Volume Loss
For measuring the tunnelling-induced ground vertical movement, and addressing corresponding volume loss, numerous geotechnical monitoring instrumentations have been installed on/under the ground and at the structures (e.g. buildings and bridges).
For monitoring the ground surface and shallow sewer drainage pipes, manual levelling studs with an accuracy of 1-2 mm are adopted and installed typically in 5 m spacing crossing about the two tunnels.
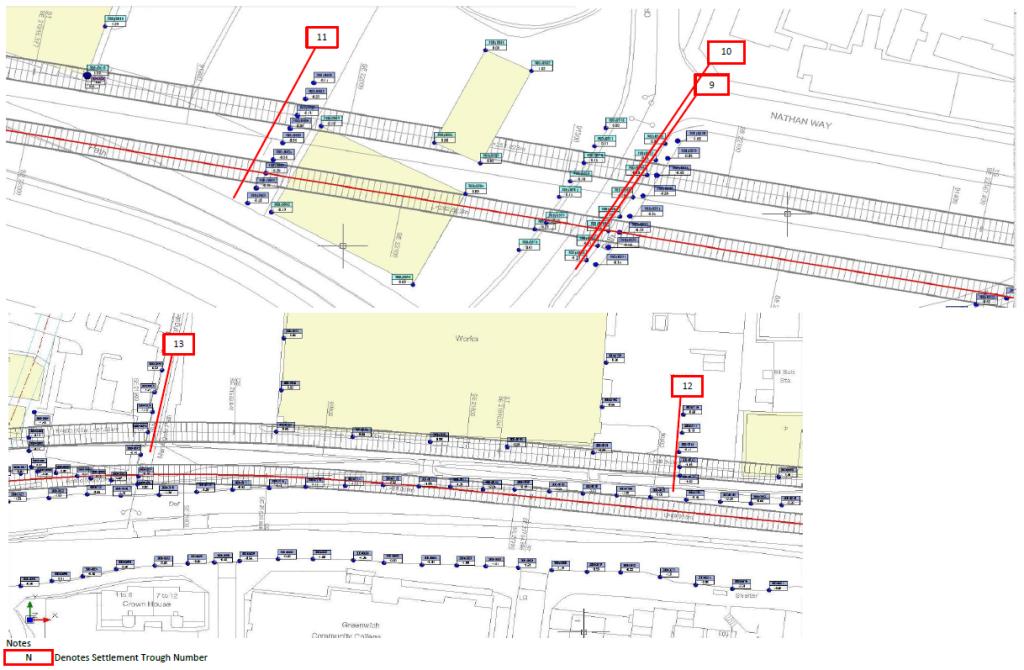
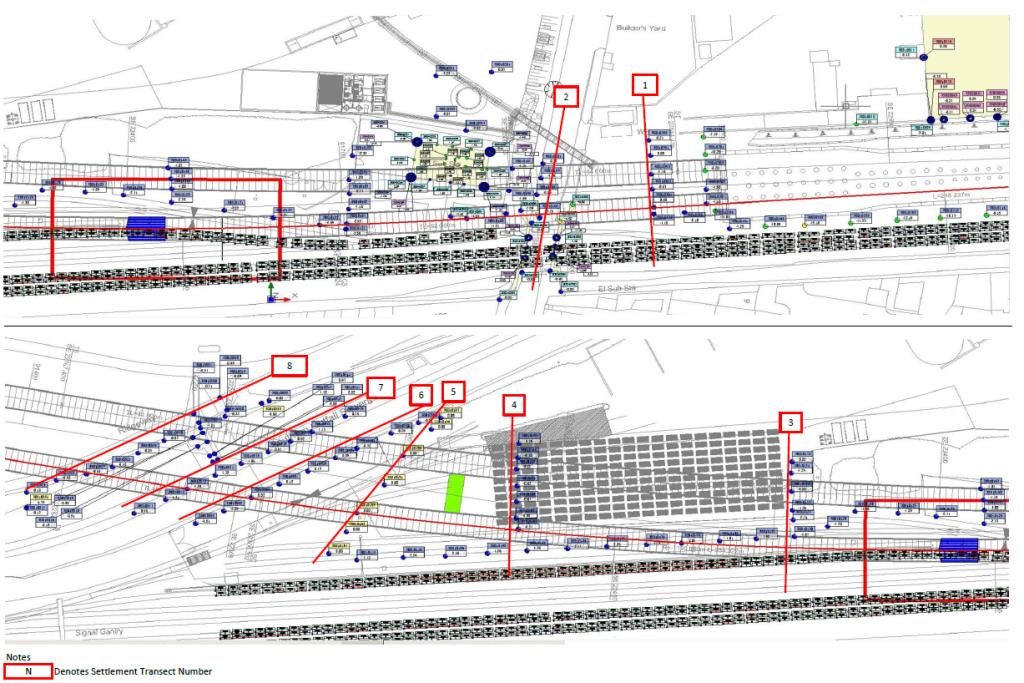
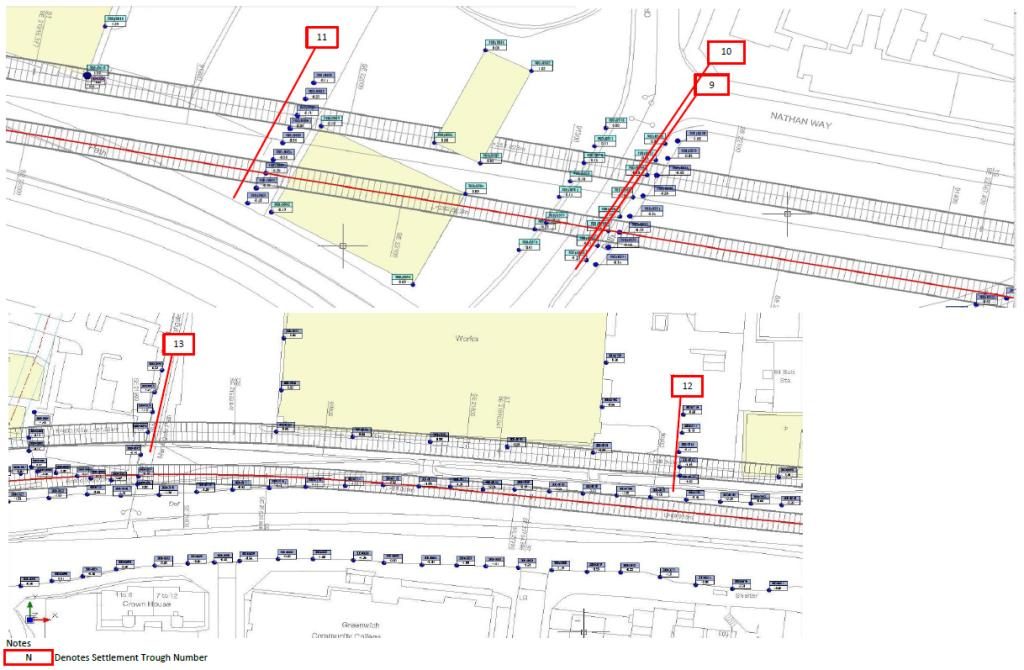
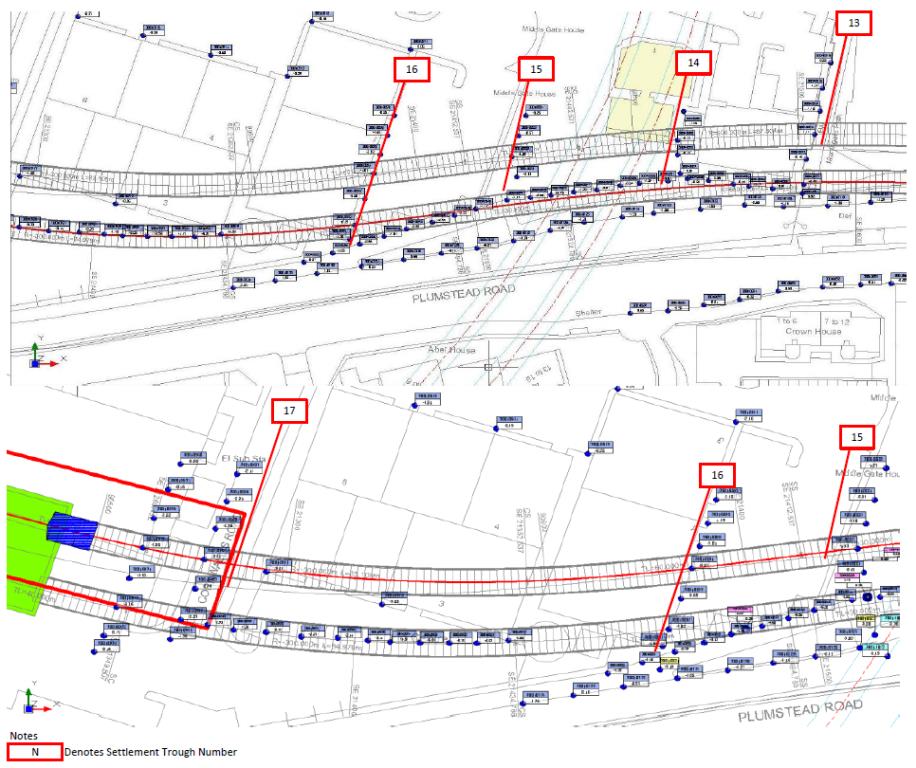
For the buildings and bridges, automated hydrostatic levelling cells (HLCs) with an accuracy of 0.1 mm are used. As for the sub-surface monitoring, extensometers are installed and adopted. Figures 6-8 show the locations and arrangements of the monitoring instrumentation at 17 cross sections (across two tunnels) over the tunnel alignment up to Woolwich station.
Readings were taken daily when the areas within TBM monitoring zone of influence (ZOI). When outside the ZOI the monitoring would be carried out weekly for 4 weeks, and subsequently monthly for 3 months. Long-term monitoring will be taken quarterly until the settlement rate is equal or less than 2 mm per annum. Figure 3 illustrates the definition of TBM ZOI, which is defined as one total depth (D) from the TBM base forwards and 2D backward.
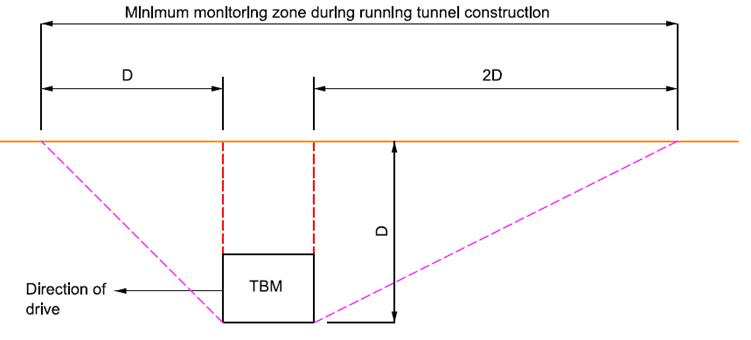
Figure 3 – Zone of Influence of the TBM
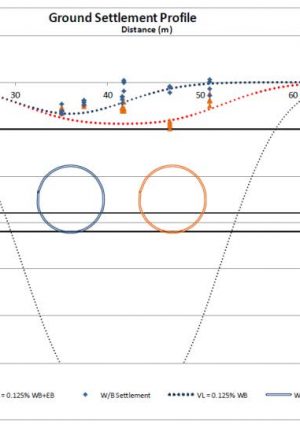
17 cross sections are selected to examine the observed actual ground surface settlement and re-assess the actual volume loss due to the tunnel excavation. The locations of 17 cross sections are shown in Figures 6-8. The re-assessment (back analyses) of the actual volume loss is performed by Xdisp as discussed earlier. K value of 0.5 is adopted. Figures 9-25 graphically present the monitoring data and the best-fit settlement curves generated by Xdisp for the 17 sections.
Table 1 summaries the two-tunnel geometry of westbound (WB) and eastbound (EB), maximum observed actual settlement, the re-assessed VL of the sections. The maximum ground surface settlement of 10 mm is recorded for the tunnelling at the mixed stratum of RTD/TS, and 9 mm at chalk. The maximum back-calculated volume loss is 0.35% at either RTD/TS or chalk, which is much less than the required volume loss of 1% in CEDS Part 7, and below 0.5% specified for the controlled tunnel drive zones.
Section Tunnel Depth [m] Distance between Two Tunnels along the Sections
[m]
Maximum
Settlement
[mm]
Volume Loss (VL)
[%]
Stratum
Encountered
WB WB & EB 1 -12.0 10 -5 0.125 0.125 RTD 2* -12.5 11 -5 0.125 0.125 RTD 3 -16.0 16 -6 0.125 0.150 TS/Chalk 4 -18.0 18 -6 0.125 0.125 Chalk 5* -18.0 20 -7 0.250 0.350 Chalk 6* -18.5 32.5 -9 0.250 0.300 Chalk 7* -24.0 30 -9 0.250 0.300 Chalk 8* -19.6 37 -4 0.125 0.125 Chalk 9 -20.8 19 -6 0.125 0.125 Chalk 10 -21.3 19 -2 0.125 0.125 Chalk 11 -22.0 18 -6 0.250 0.300 Chalk 12 -23.0 14 -5 0.125 0.250 Chalk 13 -18.0 15.5 -3 0.100 0.125 TS/Chalk 14* -17.0 14 -5 0.100 0.250 TS/Chalk 15 -13.0 17 -7 0.250 0.250 TS 16 -13.0 14 -10 0.250 0.350 RTD/TS 17 -12.0 15 -3 0.100 0.100 TS Note: * – sections within the controlled tunnel drive zones where VL of 0.5% is specified.
Table 1 – Summary table for the actual tunnelling-induced settlements and volume loss
Discussion
Settlements and Volume Loss in Chalk
The observed settlements induced by two tunnels are in the range between 3 mm and 10 mm, whereas the predicted maximum settlement is of 20 mm. The actual volume losses derived from the observed settlements in Table 1 range from 0.1% to 0.35% for the tunnelling in different strata. The actual volume losses are calculated by the back analyses using the settlement curve generated by Xdisp showing a good agreement with the actual monitoring data. They are all below the required volume losses of 1% and 0.5% for the controlled zone, with the same trough width parameter (K) of 0.5.
Settlements occurred in the chalk, where is defined as weak to moderately weak fractured chalk in this project, is less than 10 mm and the actual volume loss associated with this settlement is 0.35%. Available study in chalk tunnelling is limited. The actual volume loss obtained in this project could be considered to be relatively small, compared with the volume loss obtained from other published case studies for tunnelling in soft soils.
The small observed settlement and volume loss is likely to be attributed to both the application of the slurry TBMs and the discrepancy on the assumption of the strength and stiffness of the chalk encountered in tunnelling.
Trough Width Parameter K
There is no suggested design value for the trough width parameter for the chalk in the CEDS Part 7 (2010). For the design purpose, the chalk is considered to have the same K value as cohesive soils (0.5). Based on various projects Jones (2010) has proposed the logarithmic relationship between the parameter K and the overburden height above the tunnel in clays. However there is no such relationship developed for the chalk. The tunnel depth in the chalk on C310 drive is within a narrow zone between 18 m to 24 m. By applying Jones’ (2010) logarithmic relationship K values of 0.43-0.5 are found. Based on the back analysis results discussed earlier, K value of 0.5 has been obtained with best-fit curves generated by Xdisp to match with the actual settlement data. This implies that, due to the rock nature of the chalk, the width of the surface settlement trough over the chalk is slightly narrower than those over the clays in the published studies.
Interferences of Twin Tunnels
In the twin tunnels, pillar width (distance between two tunnels) is the most decisive factor for both tunnel stability and ground movement, because of the interference between them. With two parallel identical tunnels in this project, due to construction of the second EB tunnel, the first WB tunnel and the surrounding soil may move as a rigid body causing interference. Fang et al. (1994) considered the displacements and strains associated with twin-tunnelling. Their study shows that if the second tunnel construction generates stresses within the zone created by the first construction a ‘large and irregular’ volume loss could be expected.
In C310 drive, two tunnels are apart from the distance in the range of 2 to 5 tunnel diameter. Clear interferences between two tunnels are established for the sections with the pillar width up to 3 tunnel diameter (i.e., all sections except Sections 6-8), as shown in Figures 9-13 and 17-25. Sections 6-8 (in Figures 14 to 16) where two tunnel distances are more than 4.5 tunnel diameter show the no twin tunnel interference effect.
Conclusion
Total length of 2.6 km of twin bore tunnels was constructed by the slurry TBM in chalk at C310 contract between Plumstead portal and Woolwich station. The comparison of the observed ground surface settlements with the predicted values has been addressed. Very low values of tunnelling-induced settlements have indicated a successful slurry TBM operation, which delivered safe tunnelling experience for the future tunnelling projects. Volume loss values achieved are far below required 1%. The purpose of this paper is to share this case study of the slurry TBM excavations in the chalk and provide a reference for designers and contractors what the ground is behaving and what amount of volume loss can be expected during tunnelling in the chalk. TBMs are on the way to build the twin tunnels between Woolwich station and North Woolwich portal, and the ground movement behaviour would be worth studying to provide more valuable information on the tunnelling in chalk.
Figures
Figure 4 C122-OVE-C2-DDA-CR001_Z-21332 Settlement contours, final stage. Routewide Plan Sheet 32 of 38
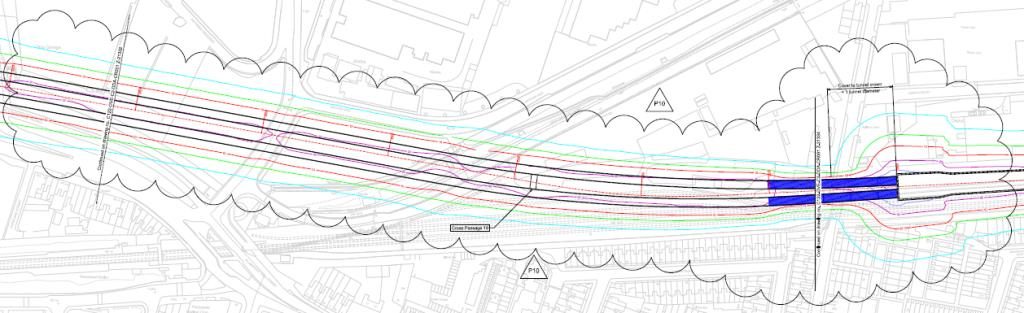
Figure 5 C122-OVE-C2-DDA-CR001_Z-21333 Settlement contours, final stage. Routewide Plan Sheet 33 of 38
Figures 6 C310 Instrumentation and monitoring sensor layout 1
Figures 7 C310 Instrumentation and monitoring sensor layout 2
Figures 8 C310 Instrumentation and monitoring sensor layout 3
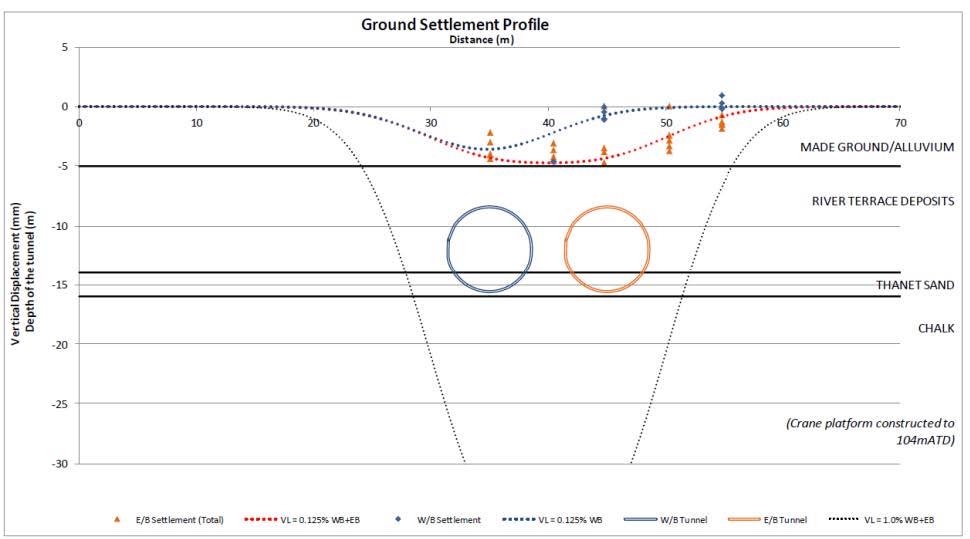
Figure 9 Section 1 Plumstead portal – crane slab 2
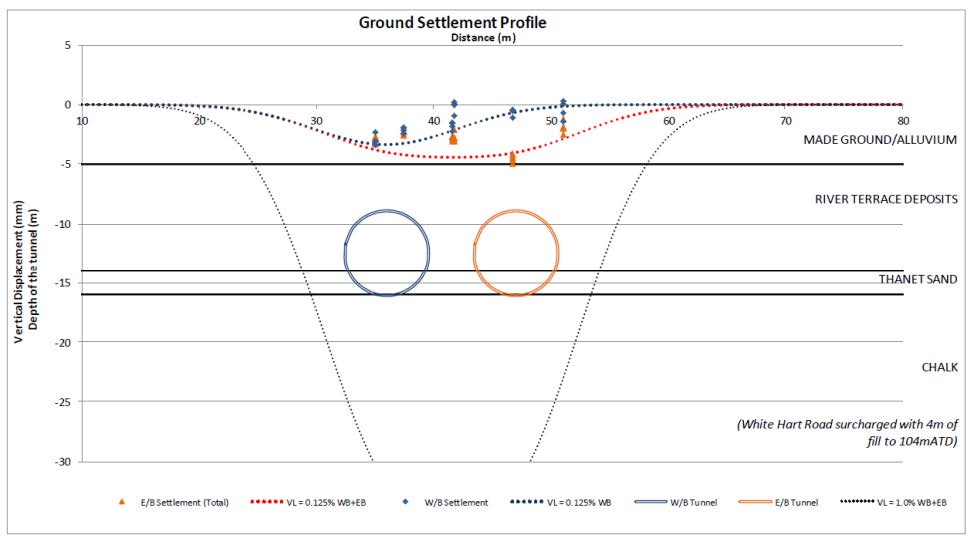
Figure 10 Section 2 White Hart Road
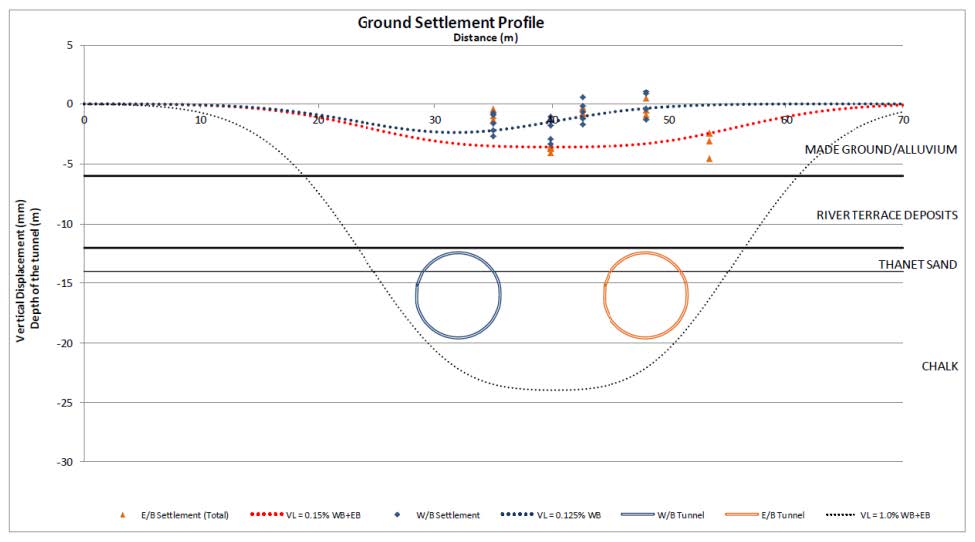
Figure 11 Section 3 STP 02
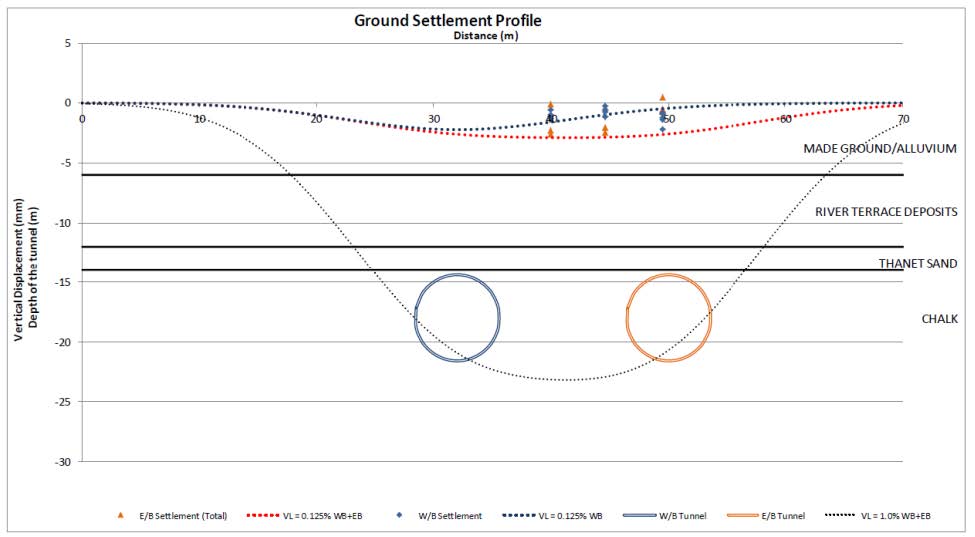
Figure 12 Section 4
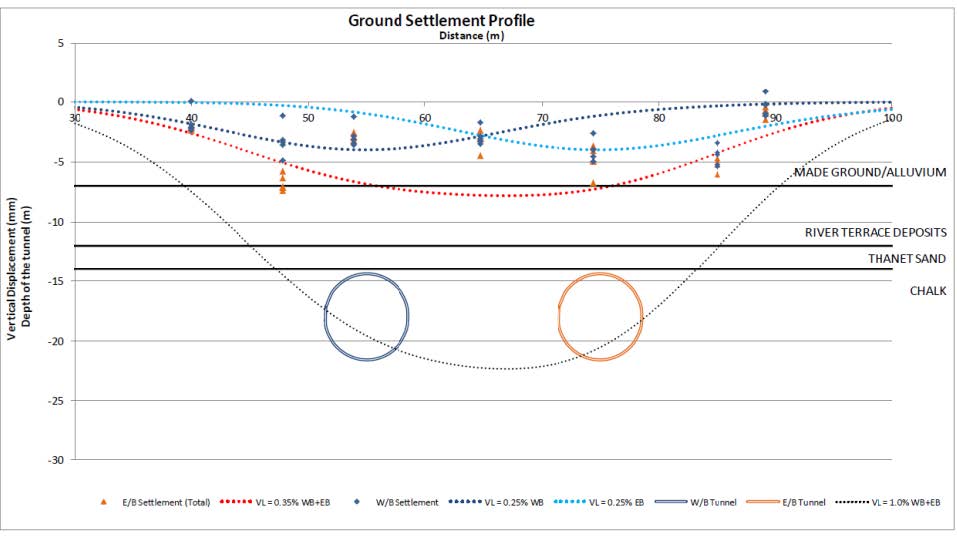
Figure 13 Section 5 Geotechnical cross section 1
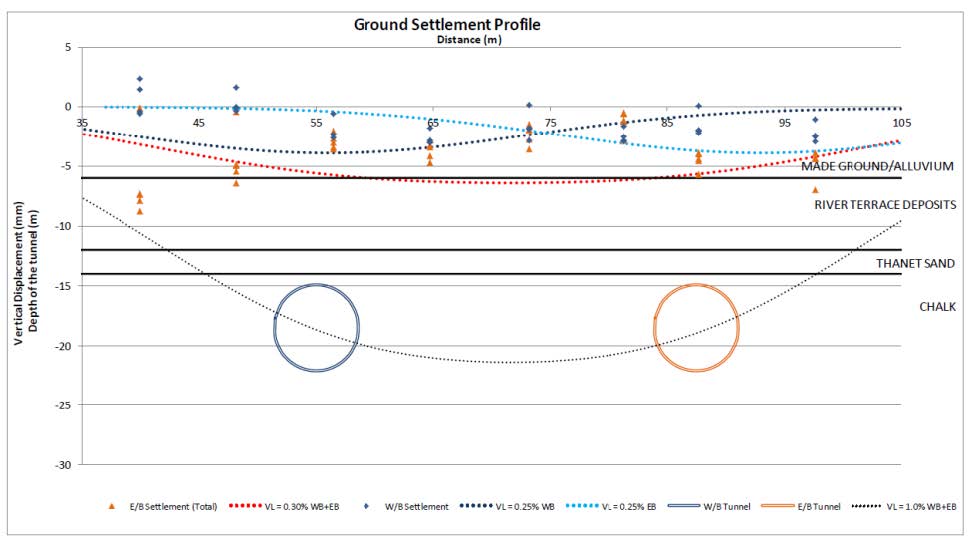
Figure 14 Section 6 Southern Outfall Sewer 1
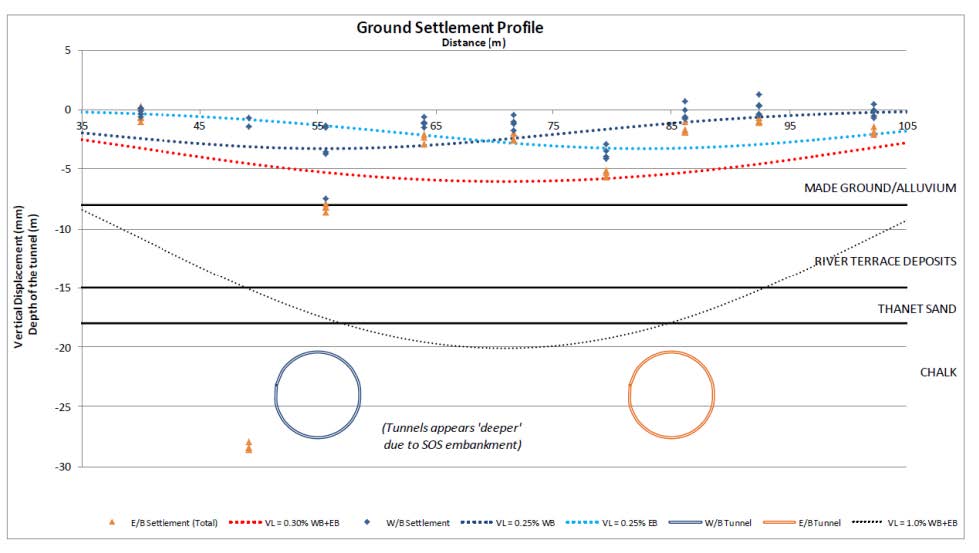
Figure 15 Section 7 Southern Outfall Sewer 2
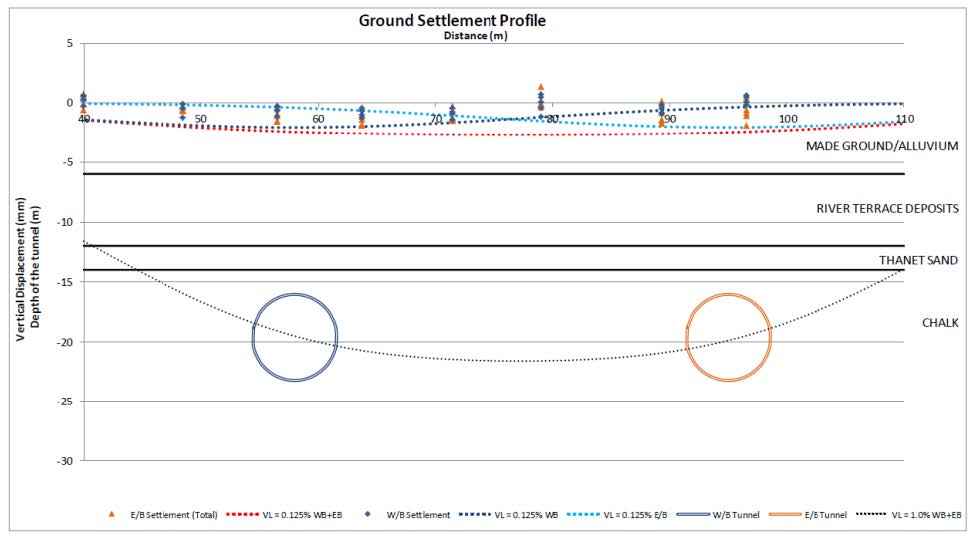
Figure 16 Section 8 Southern Outfall Sewer 3
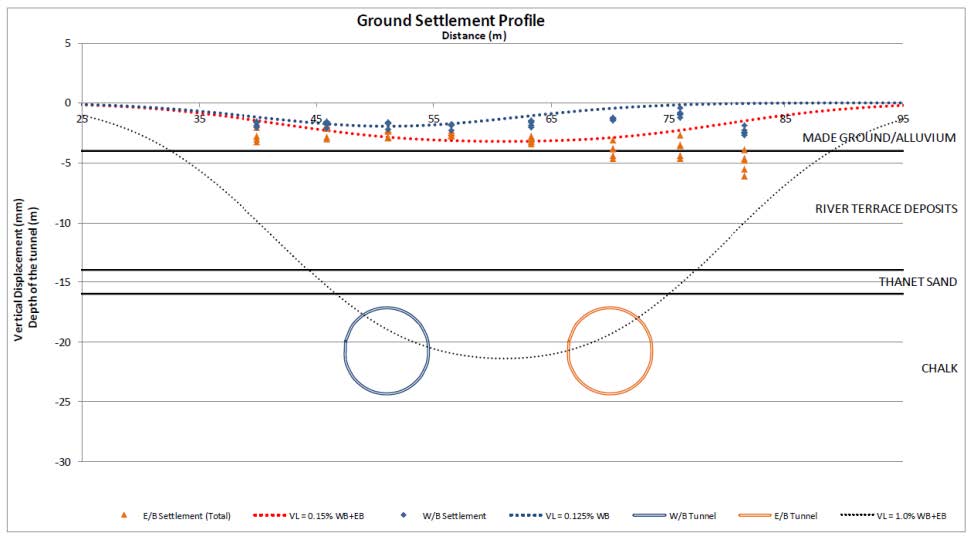
Figure 17 Section 9 Pettman Crescent bridge
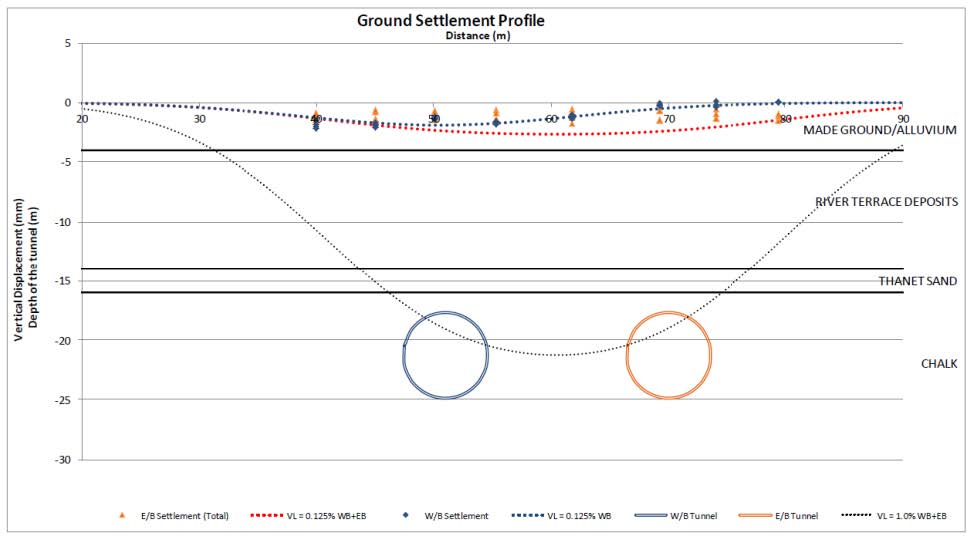
Figure 18 Section 10 Pettman Crescent HLC (E)
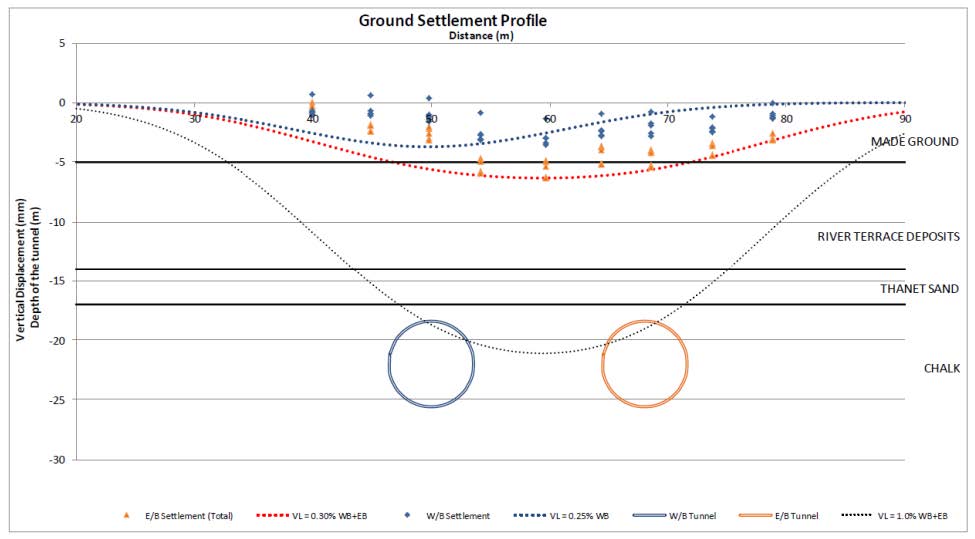
Figure 19 Section 11 Bus garage
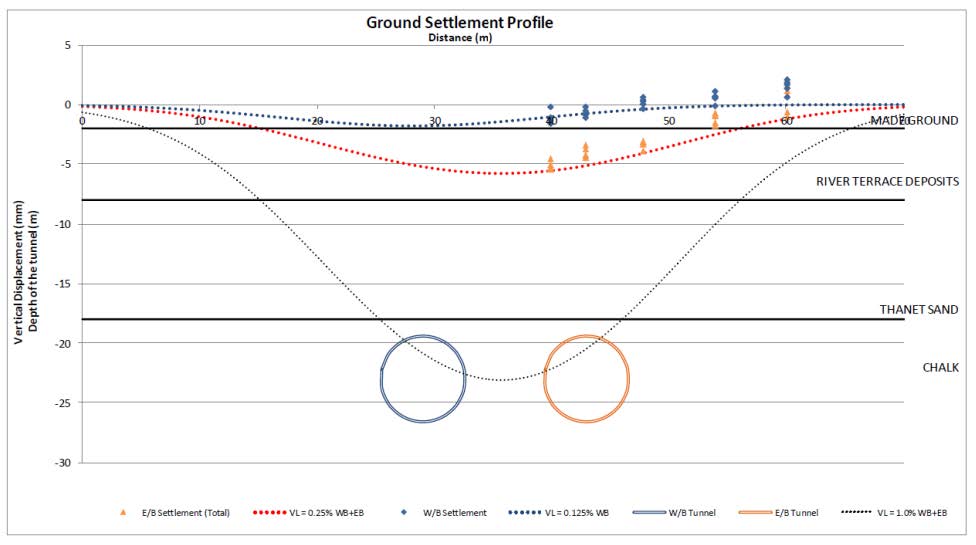
Figure 20 Section 12 Signature industries
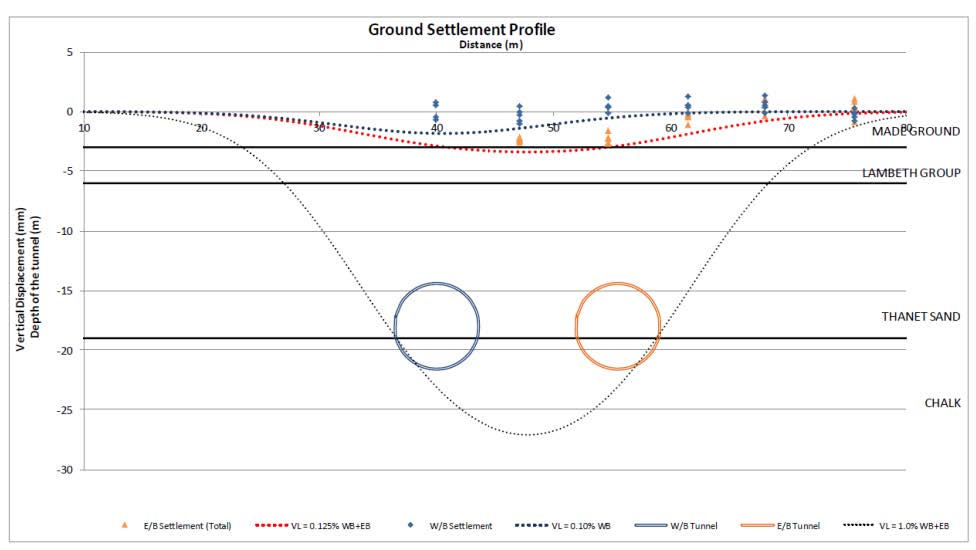
Figure 21 Section 13 Marshgate path
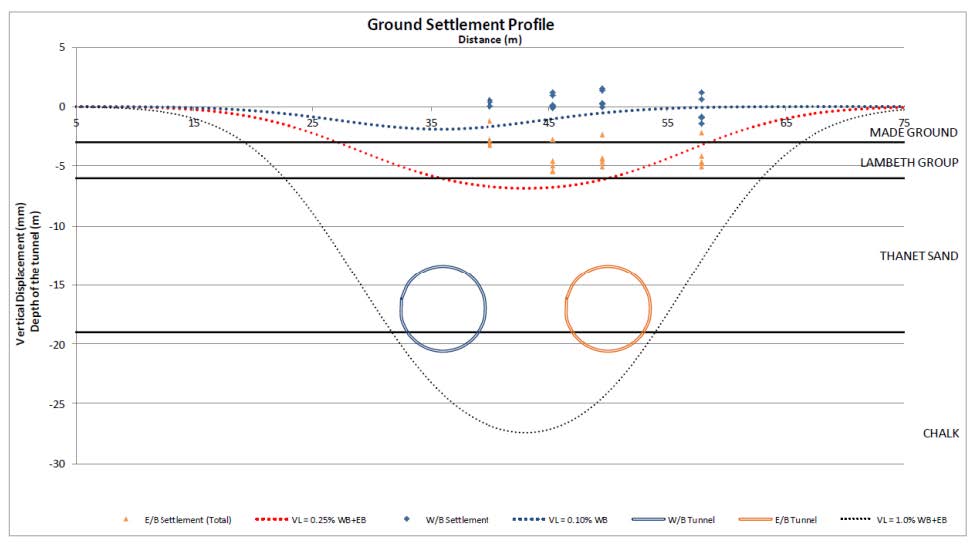
Figure 22 Section 14 MGH wall (E)
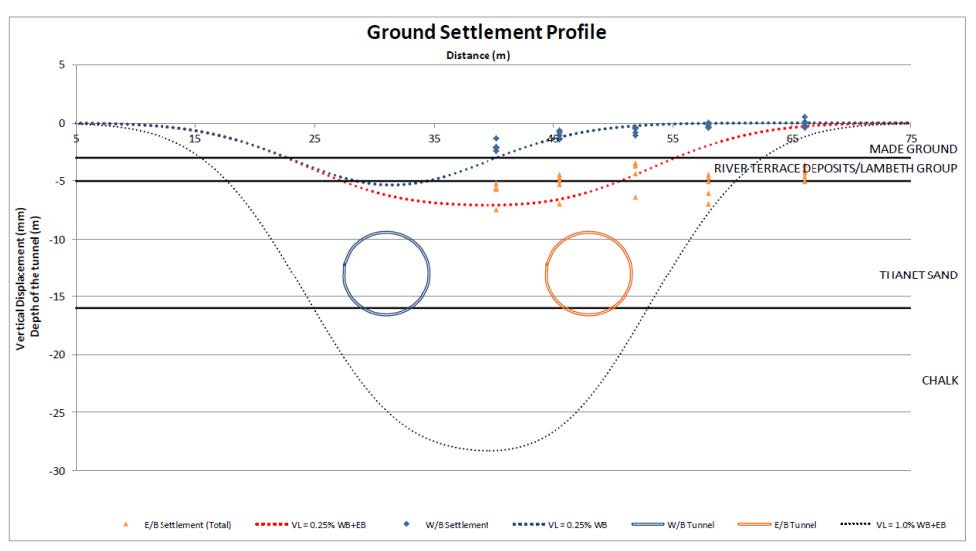
Figure 23 Section 15 MGH footpath
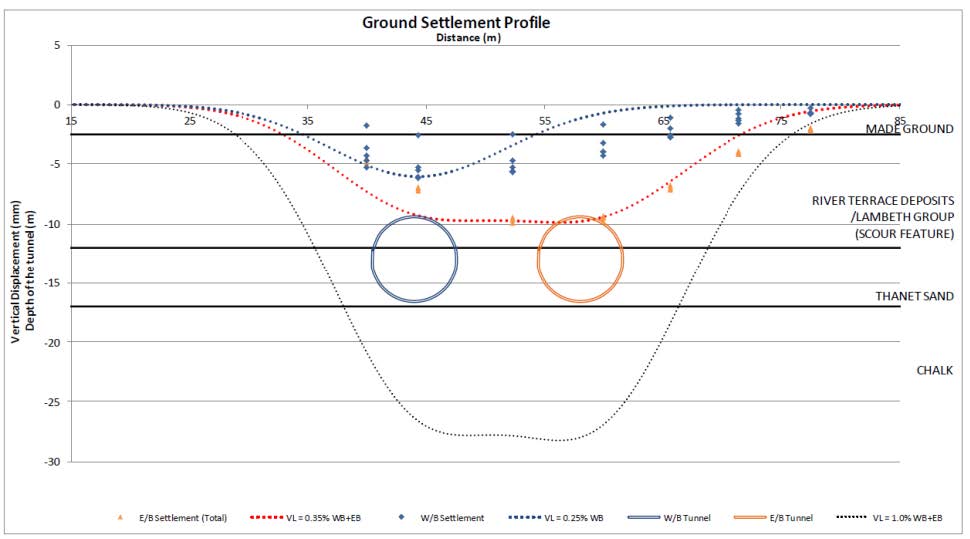
Figure 24 Section 16 IO centre
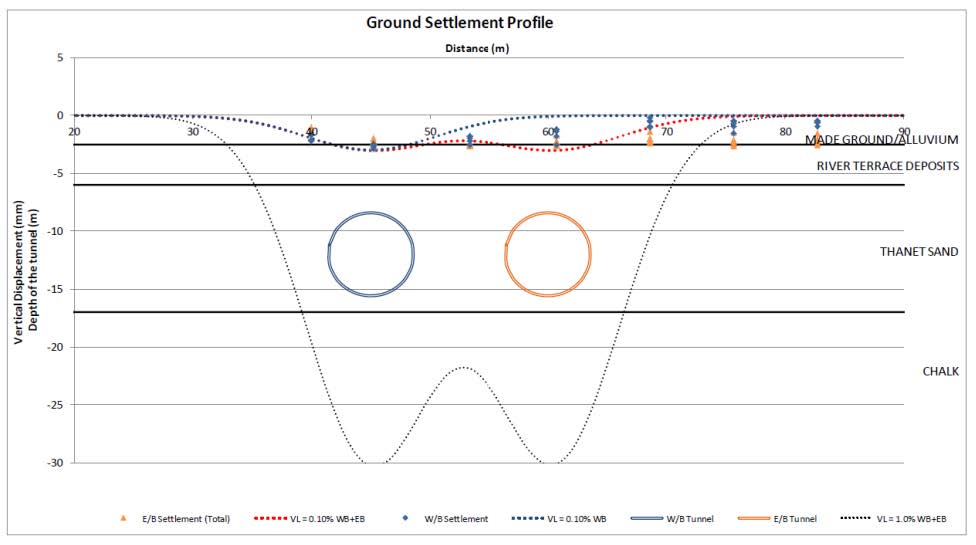
Figure 25 Section 17 Cornwallis Road
References
Crossrail CEDS – Civil Engineering Design Standard Part 7 (2010). Ground movement prediction.
Crossrail Geotechnical Sectional Interpretative Report (May 2007). Isle of Dogs to Plumstead, Volume 1: Text, Report No. 1D0101-G0G00-00520, Rev.B.
Fang, Y. S., Lin, L. S. and Su, C. S. (1994). An estimation of ground settlement due to shield tunnelling by the Peck-Fujita method. Canadian Geotechnical Journal, Vol. 31, No. 3, pp. 431-443.
Jones, B. D. (2010) Low-volume-loss tunnelling for London Ring Main Extension. Proc. Instn. Civ. Engr. Geotechnical Engineering 163, June, Issue GE3, 167-185.
Maidl B, Herrenknecht M, Anheuser L (2011) Maschineller Tunnelbau im Schildvortrieb.
New BM and Bowers KH (1994) Ground movement model validation at the Heathrow Express trial tunnel, 301-329.
O’Reilly MP and New BM (1982) Settlements above tunnels in the United Kingdom – their magnitude and prediction, 173-180. -
Authors