Impact on the Post Office Tunnel from SCL Tunnelling at Liverpool St
Document
type: Technical Paper
Author:
Christopher Wade, Dr Alfred Stärk Dipl Ing Dr Ing
Publication
Date: 07/09/2015
-
Read the full document
KEY WORDS: Post Office Tunnel, Liverpool St, Crossrail, In-tunnel Monitoring, Settlement, Displacement
Notation
AP Access Passage
AS Access Shaft
ATD Above Tunnel Datum
ATS Automatic Total Station
Ch Chainage
CP Cross Passage
D Tunnel Diameter
P Prism
PO Post Office
PT Platform Tunnel
PTE Platform Tunnel Eastbound
PTW Platform Tunnel Westbound
SCL Sprayed Concrete Lining
VD Ventilation DuctIntroduction
Under the umbrella of projects that make up Crossrail, C510 is the construction of tunnels which will form the new Liverpool St and Whitechapel stations. These works include the mining of platform tunnels, access passages, ventilation ducts, cross passages and escalator passages which will go on to make up the new station infrastructure.
At Liverpool St, C510 has constructed a temporary access shaft in the centre of Finsbury Circus gardens, situated west of the Liverpool St National Railway Station. To date, this is where all surface level access to the developing tunnel network has been gained. Due to the complex nature of the tunnel infrastructure, SCL was chosen as the method of tunnel lining, due to the flexibility it enables.
Running from south west to north east of Finsbury Circus is the route of the pre-existing PO tunnel, opened by the Post Office Company in 1927 [1]. Due to how close the tunnel is to C510, preparations undertaken by Crossrail foresaw the works would have affected the PO tunnel [2]. Figure 1 and Figure 4 show where the two networks cross paths underneath Finsbury Circus.
This paper will focus on summarising the observed influence seen within the PO tunnel as a result of C510, between November 2011 and August 2014. This includes comparisons to a pre-designed model calculating the likely ground movements [2] and the understanding as to why these may differ. Figure 1 outlines the excavations which form the main of this discussion.
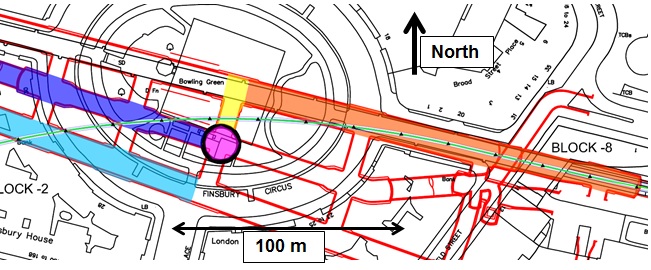
Figure 1 [3] – Map of Finsbury Circus (black), with the overlaid position of C510 works (red) & PO tunnel (green). Highlighted stages of excavation include AS1~ pink, AP7 West~ navy blue, PTW West~ turquoise, PTE East~ Orange and CP6~ yellow.
History of the Post Office Tunnel
At the beginning of 20th century, the PO tunnel was designed as a means to avoid the city wide congestion whilst transferring mail to the various sorting offices between Paddington Whitechapel within central London [4], outlined in Figure 2. After earlier attempts of using pneumatic rail systems, which were prone to leaking, the Post Office decided to build a small gauge electric railway of driverless trains, along a route which would pass beneath the various Post Office delivery & sorting offices [4].
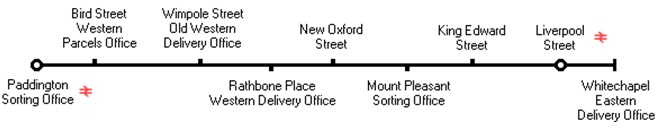
Figure 2 [5] – Tunnel route between Whitechapel Delivery Office and Paddington Sorting Office.
The construction of tunnel, beginning in 1914, was contracted to John Mowlem and Company [5]. On the brink of the First World War, when most materials and labour were needed elsewhere, it was decided tunnelling would be allowed to continue on the grounds of safety [5]. However, upon the completion of mining in 1917, all further work was suspended due to the shortage of available materials [1] [5]. Work finally resumed in 1923, with the line open in time for the Christmas post in 1927 [5].
The railway, commonly referred to as “Mail Rail”, remained operational along its 10km route with relatively little disruption until 2003, when it was finally suspended due to uneconomical running costs after a service of over 75 years [5]. Although the railway is no longer used for the distribution of mail, trains are still often still run through the tunnel for maintenance purposes.
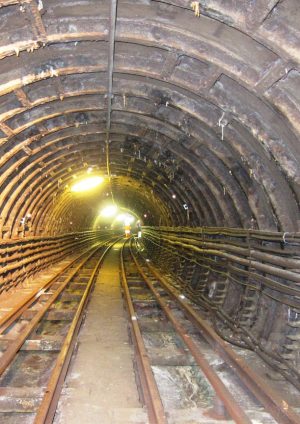
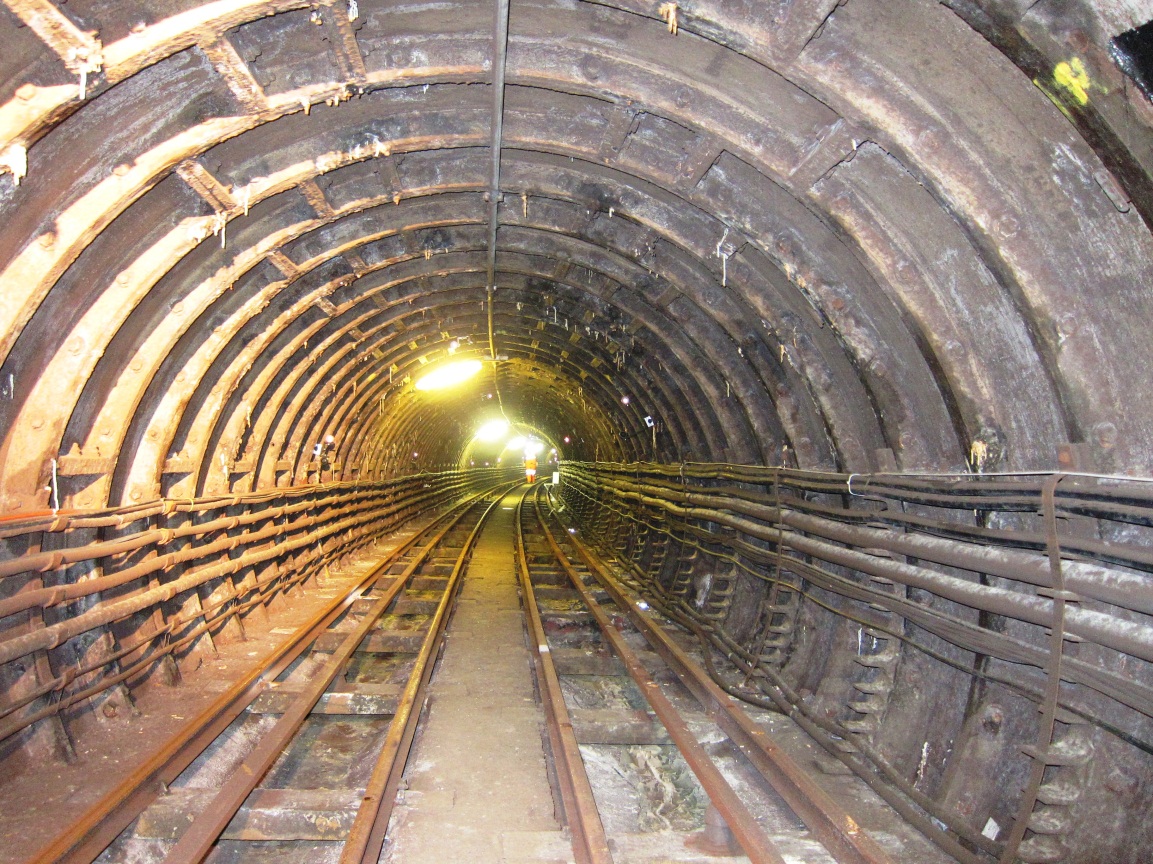 Figure 3 – PO Tunnel at Liverpool St. Photo Credit: Alfred Stärk.
The Tunnel
The PO tunnel is predominantly lined with cast iron segments and a concrete trackbed along the length of the invert, giving the tunnel an inside diameter of 2.7 m [2], seen in Figure 3 across the horizontal width of the tunnel. The Crossrail station works of C510 pass beneath the existing London Underground stations of Moorgate in the west and Liverpool St in the east. For the PO tunnel, the Crossrail Central Referencing chainage for the section running through this area is between 77300 and 78200 [2]. For ease, a separate chainage system of 0 m to 900 m was introduced for this section under the observation of C510.
Ground level across Liverpool St resides at 114 m ATD. Due to the sloped angle of the PO tunnel, increasing in depth towards the east, its invert level is between 85.6 to 92.5 m ATD [2].
Monitoring
An initial assessment of the station works was undertaken to model the likely movement of the PO tunnel caused during the excavation and tunnelling phases of C510. Calculated using the Gaussian curve and methods of Mair at al. [6] and Taylor [7], it was concluded a maximum vertical displacement of 72.1 mm and a maximum horizontal displacement of up to 29.7 mm was to be expected [2].
In cross section of the PO tunnel, as seen in Figure 5, a maximum divergence in the vertical axis of 10 mm and a maximum horizontal divergence of 7 mm are predicted [2]. These relative movements between prisms are not assumed or occur at the same chainage within the PO tunnel, or that they will occur at the chainage with maximum vertical or horizontal displacement.
To monitor the movement resulting from C510, asset protection works recommended positional monitoring to be undertaken from within the PO tunnel [2].
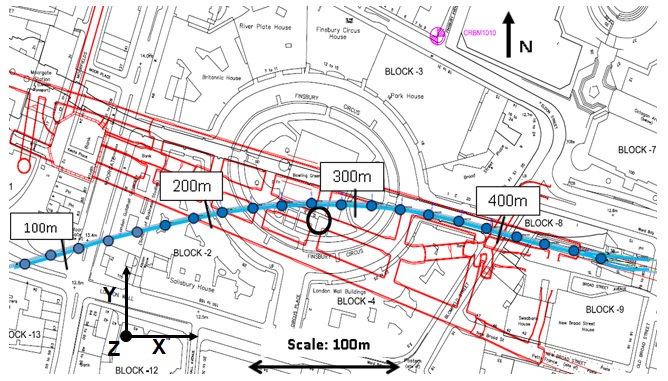
Figure 4 – Map of Finsbury Circus (black), with the overlaid position of C510 works (red) & PO tunnel (blue), with labelled chainages. Position of ATS monitoring arrays shown as blue circles, set at 20m intervals. Labelled axes shows orientation of the automated 3D monitoring arrays.The first monitoring system comprises of prism targets measured by Automated Total Stations in real time. These prism targets have been positioned into arrays around the tunnel lining and placed at regular 20 m intervals, as seen in Figure 5. Prisms 1 to 3 were installed and baselined before tunneling works began on C510. Prisms 4 and 5 along the trackbed were installed at a later date on 6th July 2013. The ATS system records any change in movement from a baseline position in 3 dimensions.
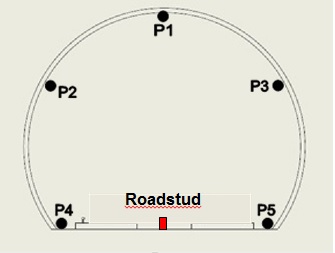
Figure 5 – Cross Section within the PO tunnel, showing the ATS prism locations around each array (black). Manual roadstud position in the centre of the trackbed (red), cross section is looking east towards increasing tunnel chainage.
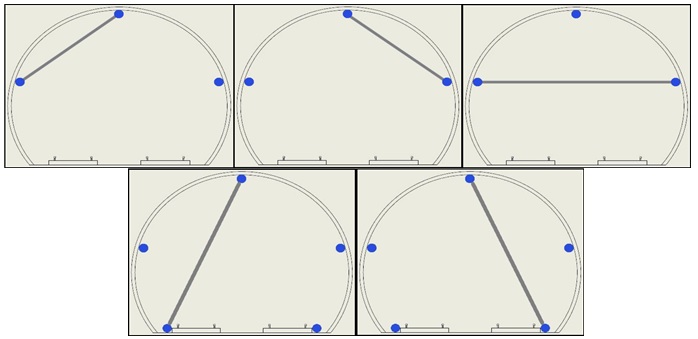 Figure 6 – Cross section through the PO tunnel, showing the calculated relative difference between prism targets.
In addition to absolute positional movement of the ATS prisms, the location of a prism will be calculated to identify relative change to the other prisms in the array, as shown in Figure 6. From these calculated measurements, arrays of increasing squat or elongation can be further assessed for any possible build up in strain on the tunnel lining.
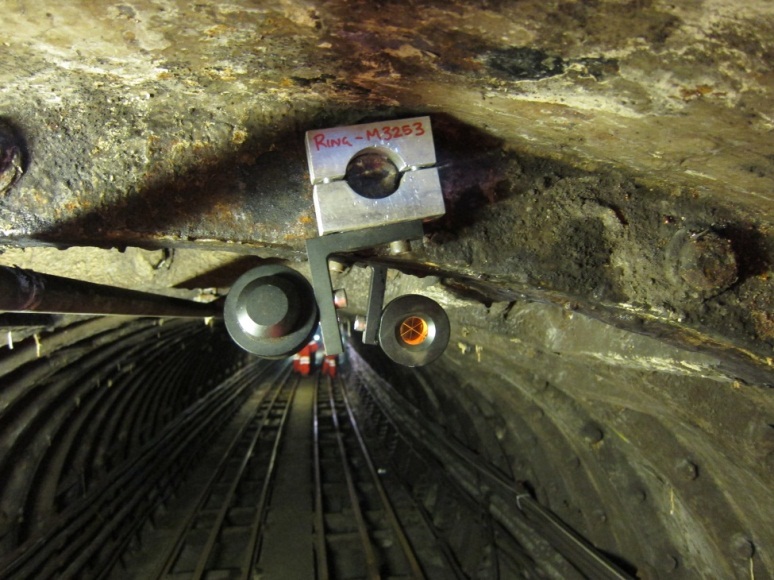 Figure 7 – ATS prism target, positioned in the Crown (P1). Photo Credit: Alfred Stärk.
The second monitoring system installed in the PO tunnel comprises of manually measured roadstuds. The studs are also positioned at 20 m intervals through the length of the tunnel, with a focused area above the excavation of PTW West at 5 m intervals. As the measurement of these roadstuds records only vertical displacement, they aid as a comparison to the ATS system in order to ensure the realibity of the system. During the measuring of roadstuds, survey teams also carry out a visual inspection of the tunnel, including checks along the lining and bolts for any damage, in addition to inspecting any pre-existing damage which may be prone to deteriorate.
Infulence from Access Shaft (AS1)
The excavation of AS1 took place between November 2011 and May 2012. During that period, the first direct influence on the PO tunnel was observed on the 14th April 2012. At this time, the shaft was excavated to a depth of 89.34 m ATD, just above the invert level of the PO tunnel.
Figure 8 shows the position of AS1 relative to the PO Tunnel, which is shown in Figure 9 as a cross section. Chainage 270 can be seen as the nearest monitoring array to the shaft. From AS1, the PO tunnel experienced a maximum vertical displacement of 19.5 mm at chainage 270. This quickly stabilised as the shaft was completed on 12th May 2012, as seen in Figure 10. Within the horizontal axes, a maximum displacement of 3.5 mm, towards the direction of the shaft, was observed at the left shoulder of chainage 270. By comparison, it is seen in Figure 11 that 1.5 mm of displacement towards the shaft occured at both the crown and right shoulder.
Figure 12 displays the positions of the crown and shoulders calculated relative to one another at chainage 270. Across the horizontal axis, 1.5 mm of convergence was observed between the PO shoulders. A 1 mm divergence was observed between the crown and right shoulder, and by contrast, a convergence of 4.5 mm was seen between the crown and left shoulder.
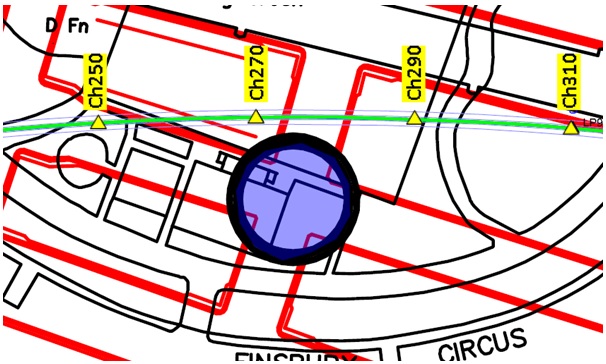
Figure 8 – Map of C510 (red) beneath Finsbury Circus (black). Where the position of AS1 (blue) is within 3 m of the PO tunnel (green). ATS arrays within the PO tunnel have been highlighted (Yellow).
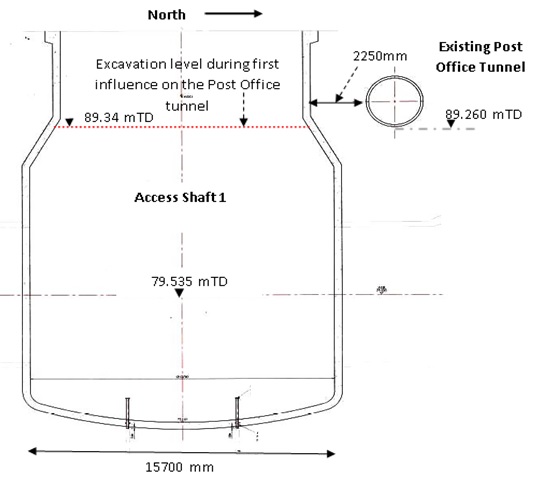 Figure 9 – Vertical cross section showing the proximity between AS1 and the PO tunnel, positioned looking west.
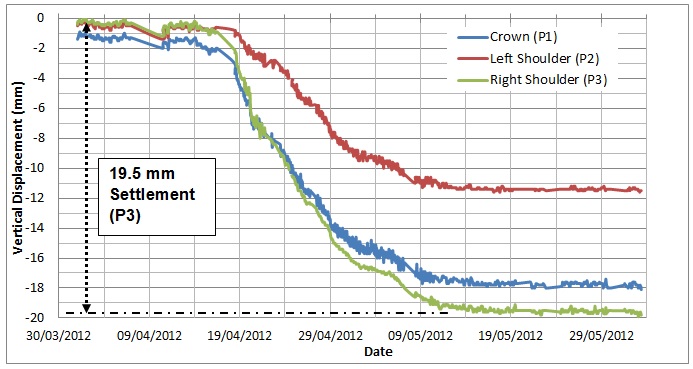 Figure 10 – PO tunnel chainage 270, vertical displacement seen during the excavation of AS1.
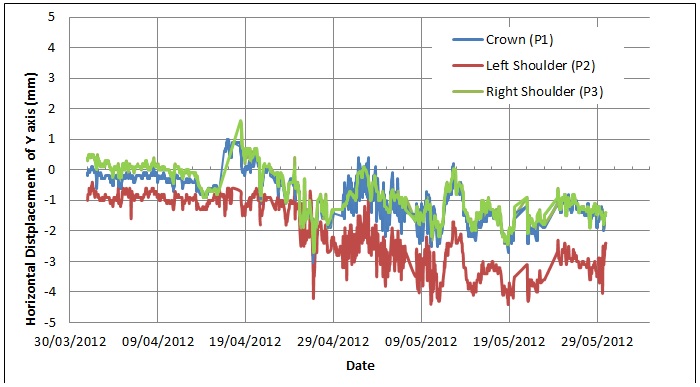
Figure 11 – PO tunnel chainage 270, horizontal movement in the north – south Y axis during the excavation of AS1. Where positive displacement is towards the north.
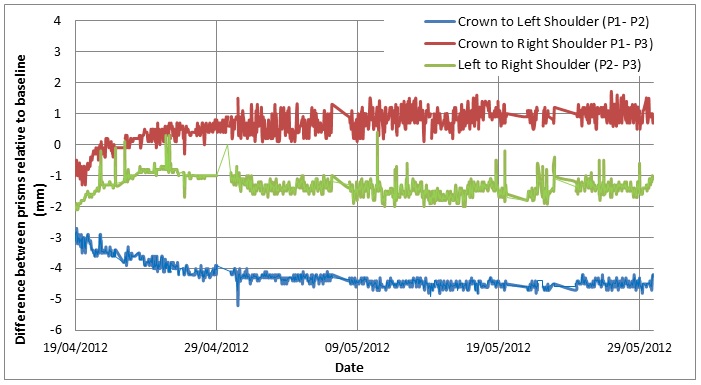 Figure 12 – PO tunnel chainage 270, relative movement calculated between the ATS prisms during the excavation of AS1. Where positive movement indicates divergence and negative movement indicates convergence.
AS1 Summary
During the excavation and construction of AS1, a maximum settlement of 19.5 mm was observed at the right shoulder of PO tunnel chainage 270. In comparison to the model, which predicted a maximum settlement of 11.2 mm at the crown [2], chainage 270 observed settlement of 17.8 mm at the same location. By contrast, the left shoulder saw the least amount of vertical movement, being 11.5 mm. This however is still a greater amount of displacement than predicted by the model.
With horizontal displacement, the maximum movement observed was 3.5 mm south in the direction of AS1, seen at the left shoulder. The model predicted movement of up to 17.9 mm by the right side of the PO tunnel, also towards AS1 [2]. The right shoulder and crown however both saw movement of approximately only 1.5 mm towards AS1. This unpredicted behaviour resulted in a 1.5 mm horizontal convergence across the shoulders, which compared to the model, was predicted to be a divergence of 5.9 mm [2].
The comparison between the model and observed trends resulting from AS1 show that far more settlement, and yet less horizontal movement, actually occurred. Where the left shoulder identified more horizontal displacement than its counterpart on the right, a possible explanation is that the PO tunnel rotated towards the direction of AS1 during its excavation.
Due to the scale of AS1, a large reduction in ground pressure from its excavation will have resulted in horizontal movement of the PO tunnel towards the excavation. As the shaft continued to sink, horizontal movement will have migrated into vertical settlement, allowing the right side of the PO tunnel to settle. Figure 13 shows the observed movement at chainage 270, where the axis of rotation is likely to be close to the left side of the trackbed, as less vertical displacement is seen at the left shoulder. The movement which has occurred was not considered by the calculated model, which mainly focuses on the resulting elongation or squat of individual arrays during an excavation.
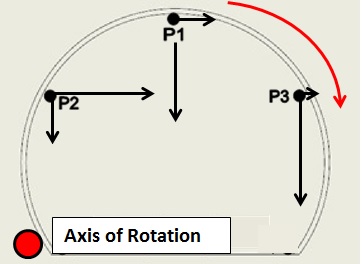 Figure 13 – Cross section of the PO tunnel chainage 270, where crown and shoulders are showing observed vertical and horizontal movement (black arrows). Red arrow shows the resulting direction of rotation, around the axis point (red dot).
Influence from Access Passage 7 West (AP7 W)
AP7 West passes beneath the PO tunnel between chainage 230 and chainage 260. Figure 14 shows the location of the PO tunnel where monitoring arrays are present at chainage 230, 243 and 250. The monitoring array at chainage 243 was an additional installation, in the hope to better understand the reactions caused by the excavation of Chamber 1 directly beneath.
Access Passage 7 West Pilot and Enlargement
The breakout of AP7 West Pilot from AS1 commenced on 3rd November 2013. The first 24 metres were excavated up until the 9th November 2013. During this period, the strongest reaction within the PO tunnel was identified at chainage 250, the closest array to the excavation at the time, where a vertical displacement of 4.5 mm was observed.
After recommencing AP7 West on the 9th February 2013, excavation of both the pilot and the enlargement were alternated in succession. As a result, the influence seen by the PO tunnel is difficult to differentiate which is directly due a particular drive.
By the 28th February 2013 the enlargement of Chamber 1 commenced. This junction, which is the connection between AP7 West and cross passages which lead to the platform tunnels (mined at a later date), was completed on the 27th March 2014.
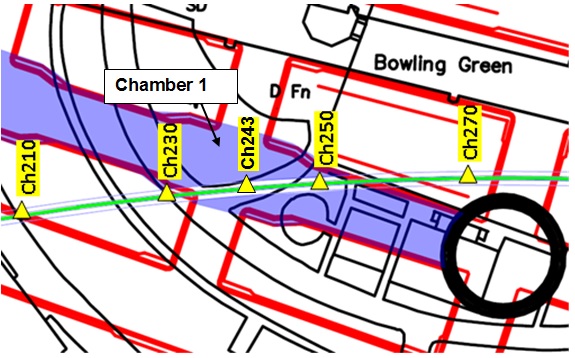 Figure 14 – Map of C510 (red) beneath Finsbury Circus (black). Where AP7 West (blue) passes beneath the PO tunnel (green). Monitoring arrays within the PO tunnel have been highlighted (yellow).
Across the three stages of excavation, a maximum settlement influence of 55 mm was seen within the PO tunnel at chainage 243 on the left shoulder, as shown in Figure 15. Chainage 230 saw the least vertical displacement, as it has the furthest offset from the AP7 West axis. For this reason however, the clearest horizontal displacement was identified at chainage 230. Figure 16 shows the northwards movement of approximately 10 mm, towards the direction of the AP7 West axis. By contrast, chainage 250 saw very little horizontal displacement during this period.
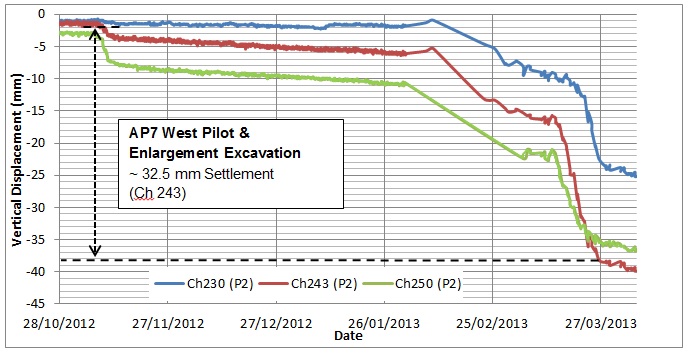 Figure 15 – PO tunnel vertical displacement of the left shoulders, due to the excavation of AP7 West. (Data between 31st January and 5th March 2013 is not available).
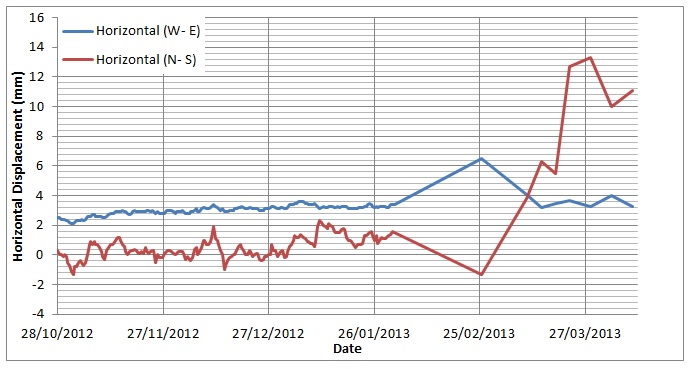
Figure 16 – PO tunnel chainage 230, horizontal displacement of the crown during the excavation of AP7 West. Where positive W-E movement is towards the east and positive N-S movement is towards the north.
Figure 17 shows the calculated relative positions between the monitoring prisms of PO tunnel chainage 230. The most obvious observation during the AP7 West excavation is an increase in convergence up to 3.7 mm between the PO tunnel shoulders. An increase in convergence was also seen between the crown and right shoulder to a maximum difference of 1.7 mm.
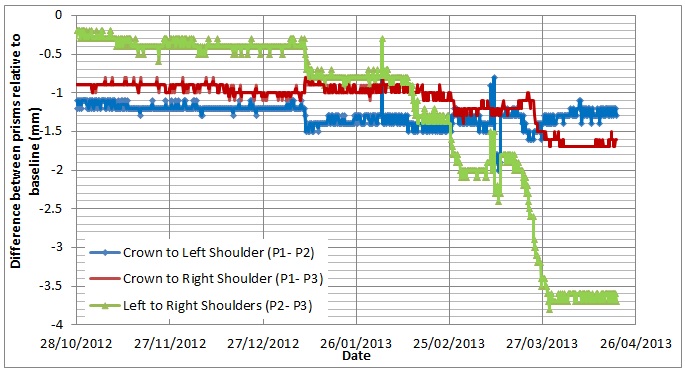
Figure 17 – PO tunnel chainage 230, showing the calculated relative positions between the crown, left and right shoulders during the excavation of AP7 West. Where positive movement indicates divergence and negative movement indicates convergence.
AP7 West Summary
Due to the alternation between pilot and enlargement excavations, a combined vertical displacement of 55 mm was observed within the PO tunnel at chainage 243, directly above the axis of AP7 West. For this location of the PO tunnel, the predicted model anticipated a reaction of 53 mm settlement [2], which approximately matches this observation.
A maximum horizontal displacement of 10 mm was observed at PO tunnel chainage 230, towards the direction of the AP7 West axis. For this same chainage, the model anticipated approximately 6.5 mm also towards the direction of AP7 West axis [2].
Whilst convergence increased across the shoulders of chainage 230, the relative difference between the crown and right shoulder only calculated an increase of 0.8 mm in divergence.
Influence from Cross Passage 6 (CP6)
Due to its large size, CP6 was excavated in 3 stages, as a pilot, enlargement and deep invert. Along with CP5, highlighted in Figure 18, it is the largest mined cross section undertaken by C510 at Liverpool St, being over 12 m vertically and 9.8 m horizontally across, as seen in Figure 19 and Figure 20.
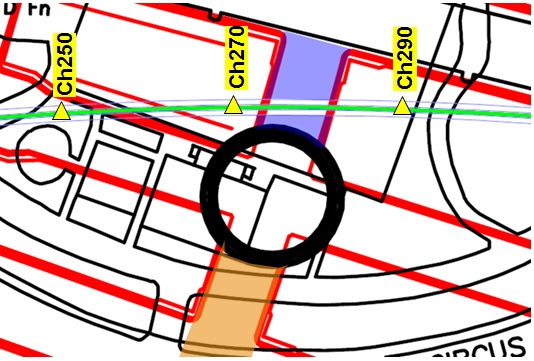
Figure 18 – Map of C510 (red) beneath Finsbury Circus (black). Where CP6 (blue) passes beneath the PO tunnel (green). The location of CP5 is also highlighted (orange). Monitoring arrays within the PO tunnel have been highlighted (yellow).
CP6 Pilot
The excavation of CP6 Pilot, breaking out from AS1, began on 16th November 2012 and was completed along its 29 m length by the 8th December 2012. During excavation, mining passed beneath the PO tunnel between chainage 270 and 290, shown in Figure 18. During this period, chainage 270 saw 5.2 mm settlement and chainage 290, seen in Figure 21, saw 5.8 mm of settlement. Both these observations were seen at the left shoulder of the PO tunnel. The crown and right shoulder of both chainages observed less vertical displacement.
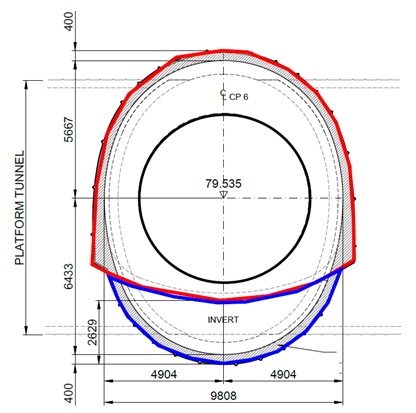
Figure 19 – Cross section of the CP6 “Codsmouth” tunnel. Pilot excavation seen outlined in black, enlargement in red and deep invert in blue.
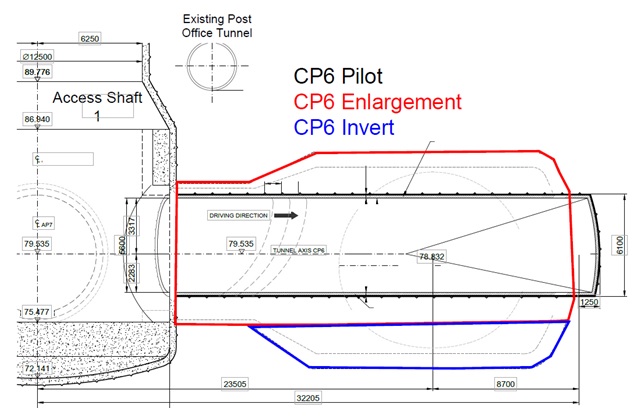 Figure 20 – Long section of CP6, showing the position of the PO tunnel crossing the CP6 axis at a slight offset to perpendicular. Pilot excavation seen outlined in black, enlargement in red and deep invert in blue.
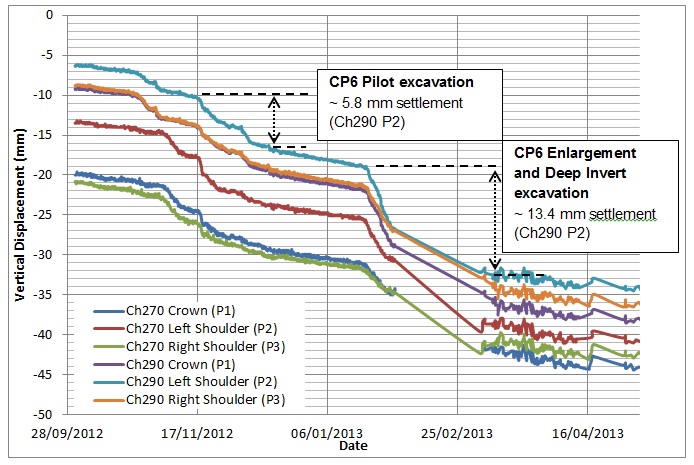 Figure 21 – PO tunnel chainage 270 and 290, vertical displacement observed during the excavation of CP6. (Data between 31st January and 5th March 2013 is not available).
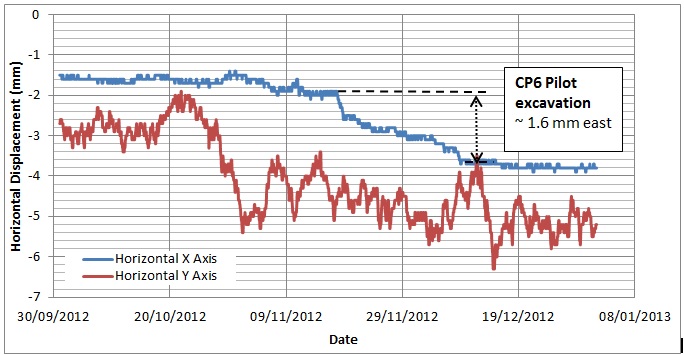
Figure 22 – PO tunnel chainage 290, horizontal displacement of the crown during the excavation of CP6. Where positive X movement is towards the east and positive Y movement is towards the north.
The horizontal movement at chainage 290 saw a displacement of 1.6 mm west, towards the excavation, seen in Figure 22. A slight trend of approximately 1 mm towards the south can also be identified within the limits of monitoring inaccuracy. Chainage 270 by comparison, saw very little horizontal movement during the excavation.
CP6 Enlargement and Deep Invert
The mining of CP6 Enlargement took place from 19th to 31th January 2013, with the excavation of the deep invert between 1st and 6th February 2013. As seen in Figure 21, the ATS data for February 2013 is not available, however, upon its return in March a vertical displacement of 13.4 mm was observed at the left shoulders of both chainage 270 and 290 since the breakout of the enlargement. Chainage 270 and 290 saw very little horizontal movement during excavation, due to a large degree of monitoring inaccuracy present in the north – south horizontal axis.
CP6 Summary
A maximum settlement of 19.2 mm was observed within the PO tunnel on the left shoulder of chainage 290 during the mining of CP6. Almost exactly the same observation was made at chainage 270, where a maximum settlement of 18.6 mm was observed also at the left shoulder. In the calculated model, a maximum settlement of 37 mm was expected to occur above the axis of CP6 during this period [2]. As both chainage 270 and 290 are offset from the axis of CP6, it is expected they would not observe the maximum influence.
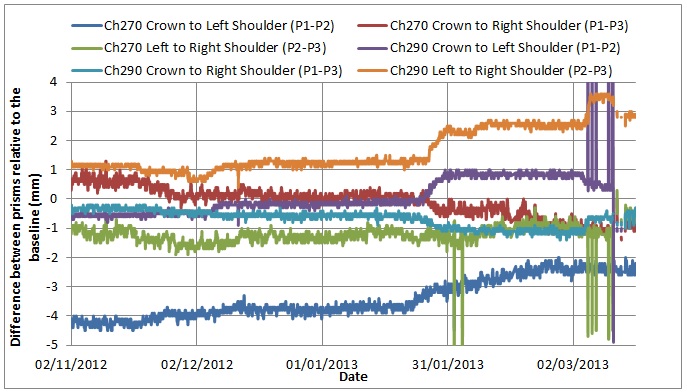
Figure 23 – PO tunnel chainage 270 and 290 showing the calculated relative difference between the crown and shoulders. Where positive movement indicates divergence and negative movement indicates convergence.
Figure 20 shows that in the axis of CP6, the PO tunnel is directly above the smaller diameter section of the full excavation, where the wider cross section of the tunnel is towards the north. Because of this, more movement has been observed in the left shoulder of the PO tunnel where there is more influence from the larger section of excavation. To demonstrate this, Figure 23 shows the calculated difference between the crown and shoulders of chainage 270 and 290. During the enlargement stage of CP6, chainage 270 saw a reduction in pre-existing convergence where the left shoulder settled more than the crown. This was also observed at chainage 290, along with a 1 mm increase in divergence between the shoulders due to the movement seen on the left side.
Influence from Platform Tunnel Westbound West (PTW-W)
Platform Tunnel Westbound West Pilot
PTW West commenced breakout on 2nd July 2013. Figure 24 shows the length of the mining drive passed beneath the PO tunnel between monitoring arrays at chainage 190 and 210. First influence from PTW West Pilot was identified in the PO tunnel at chainage 210 on 17th August 2013, at which point the breakout of PTW West Enlargement began. The pilot tunnel recommenced from 1st October 2013 and continued until completion. First influence at PO tunnel chainage 190 was identified on 4th October 2013.
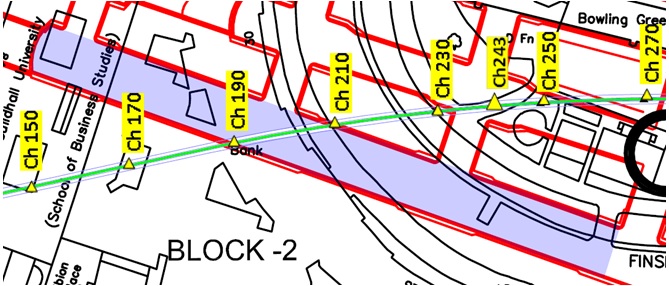 Figure 24 – Map of C510 (red) beneath Finsbury Circus (black). Where PTW West (blue) passes beneath the PO tunnel (green). Monitoring arrays within the PO tunnel have been highlighted (yellow).
Figure 25 and Figure 26 show the vertical displacements observed within the PO tunnel, where chainage 190 observed 14 mm settlement and chainage 210 observed 14.9 mm respectively.
Figure 27 shows the horizontal displacement observed at chainage 210. During pilot mining, movements of 2 mm west and 6 mm south were recorded. Figure 28 displays the calculated relative change between prisms around the array at chainage 210. During the period of pilot excavation, a definite increase in convergence can be seen between the left and right sides of the monitoring array, at both the trackbed and shoulder level of between 1 mm and 1.2 mm. Also during this period, a reduction in convergence of 1 mm was observed between the crown and right trackbed.
At both chainage 190 and 210 within the PO tunnel, the first influence was seen around 2 tunnel diameters ahead of the excavating face of the platform tunnel.
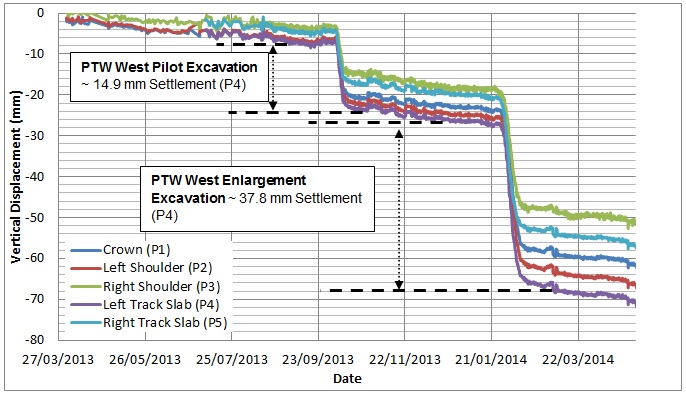 Figure 25 – PO tunnel Chainage 190, vertical displacement due to the excavation of PTW West Pilot and PTW West Enlargement.
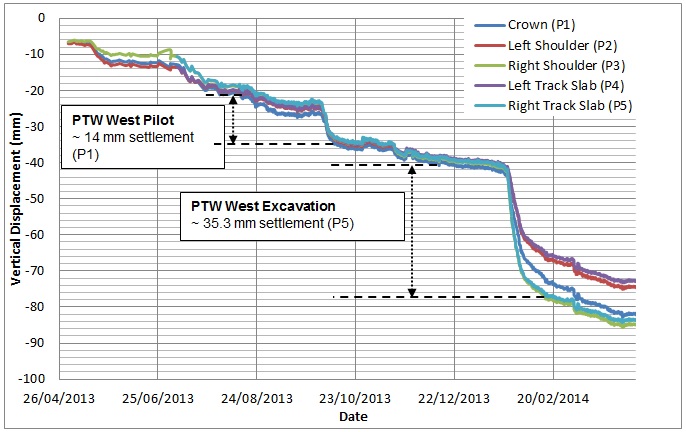
Figure 26 – PO tunnel Chainage 210, vertical displacement due to the excavation of PTW West Pilot and PTW West Enlargement.
Platform Tunnel Westbound West Enlargement
After the initial pilot excavation, the breakout of Platform Tunnel Westbound West Enlargement began from CP5 on the 10th August 2013, advancing until 1st October 2013 at which time the pilot excavation resumed. Upon completing the pilot tunnel towards the end of October 2013, excavation of the enlargement resumed for a small distance in November before being halted for the remainder of 2013.
First influence on the PO tunnel was identified immediately upon recommencing work from the 20th January 2014. PO tunnel chainage 210 saw a direct influence of 35.3 mm (Figure 26) in comparison to chainage 190, which saw a slightly stronger reaction of 37.8 mm (Figure 25).
At chainage 210, a horizontal movement of 8.2 mm west can be seen in Figure 27 before developing into a long term drift. During this period, a northwards drift also begins to occur, however this is possibly related to other excavations in the area.
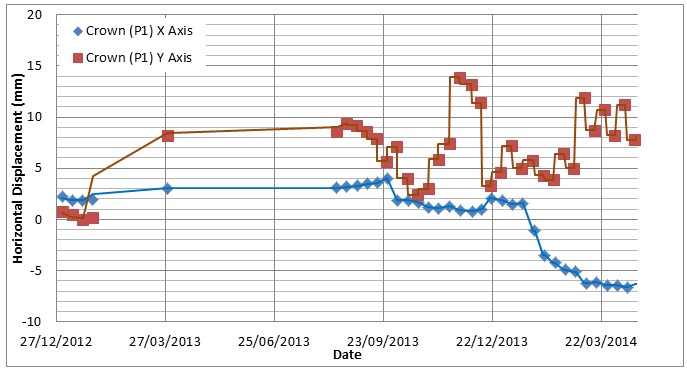
Figure 27 – PO tunnel Chainage 210. Horizontal displacement due to the excavation of PTW West. (Where positive Y indicates movement towards north and positive X indicates movement towards east)
The displacement measured at chainage 210 during the enlargement of PTW West can be seen causing both convergence AND divergence around the array. Figure 28 shows where the left shoulder and trackbed have reacted less than the right side; this has resulted in convergence as the crown itself has settled. By contrast, with the right side of the trackbed seeing the most settlement due to the excavation, this has resulted in divergence from the crown. A similar reaction is also seen between the crown and right shoulder. As would be expected, this definite right side displacement has also resulted in divergence between the east & west shoulders and trackbed prisms, resulting in horizontal elongation.
Summary
During the excavation of PTW West, the PO tunnel recorded a maximum vertical displacement of 49.3 mm at chainage 210 and 52.7 mm at chainage 190. In both cases, the monitoring arrays are positioned above the north and south limits of the platform tunnel. Chainage 200 is where the PO tunnel crosses axes with the platform tunnel. Although this position does not have an ATS monitoring array, it can be assumed that the PO tunnel has likely experienced more displacement over the platform tunnel axis, than the monitoring arrays have observed themselves.
When compared to the displacement anticipated by the model, where 51.9 mm of settlement was expected at the crown [2], chainage 210 measured a total vertical movement of 46.4 mm at P1, with the trackbed showing 56.7 mm of vertical displacement.
For chainage 190, the largest settlement observed was along the left side of the trackbed at position P4. Due to the angle at which the platform tunnel cuts beneath the PO tunnel, as seen in Figure 24, the left side of the trackbed in the PO tunnel is more exposed to settlement influence than the right side, which was further away from the platform tunnel axis. In much the same way, at chainage 210 within the PO tunnel, where the monitoring array is positioned at an opposing angle relative to the platform tunnel, the right side is more exposed to the excavation, and so can be seen to have received the most amount of settlement, being closest to the platform tunnel axis.
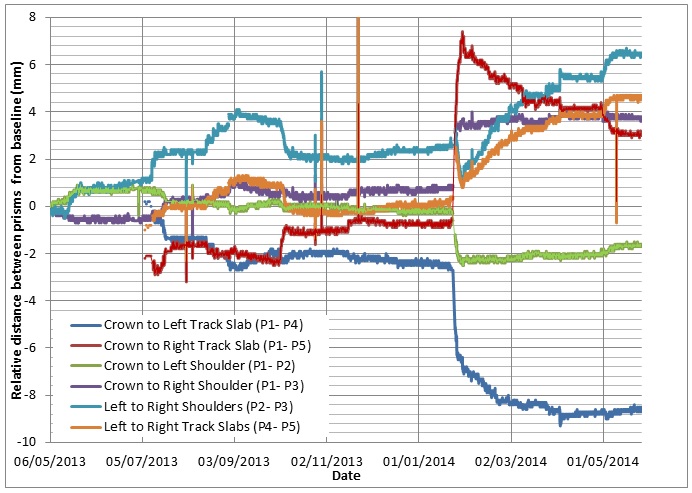
Figure 28 – PO tunnel chainage 210, position of the Crown, Shoulders and Trackbed prisms calculated relative to one another. Where positive movement indicates divergence and negative movement indicates convergence.
This difference in movement, whereby the largest displacement is recorded on opposing sides between conjoining arrays, indicates a likely twist of the tunnel lining has occurred across this section. This is similar to movement previously discussed in the excavation of AS1.
Influence from Platform Tunnel Eastbound East
Platform Eastbound East Pilot
Platform Tunnel Eastbound East Pilot commenced breakout from CP6 on 23rd June 2013. As seen in Figure 29, from PO tunnel chainage 370 to chainage 450, the platform tunnel axis is in aligned with the PO tunnel.
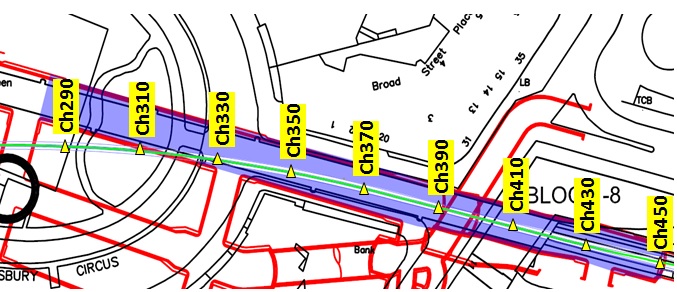 Figure 29 – Map of C510 (red) beneath Finsbury Circus (black). Where PTE East (blue) under passes the PO tunnel (green). Monitoring arrays within the PO tunnel have been highlighted (yellow).
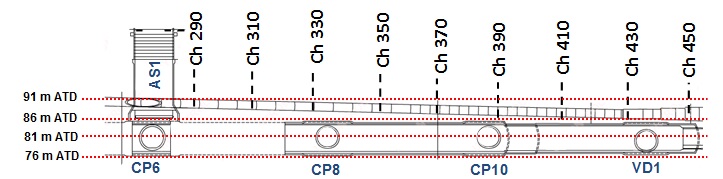
Figure 30 – Long Section of the PO Tunnel (with labelled chainages) and PTE East (with labelled cross sections) showing the vertical distance between the two tunnels, down to as little as 450 mm. Long section is positioned looking north.
Excavation of the pilot tunnel, including the reception chamber (the mined section beneath PO tunnel chainage 390 to 450), were completed on 26th September 2013. Figure 31 shows the vertical displacement resulting from both the pilot and enlargement. To simplify this movement, Table 1 shows the vertical displacement within the PO tunnel during the pilot excavation. From this, a general trend can be identified where increasing displacement can be seen from the opposing ends of the PO tunnel (chainage 310 and 450) towards the maximum seen at chainage 390.
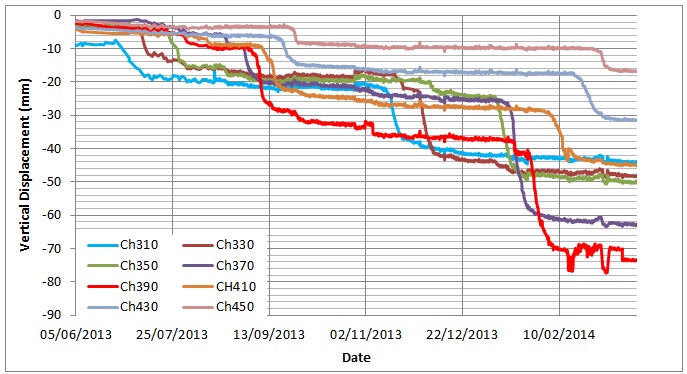
Figure 31 – PO tunnel Chainage 310 to 450 crown prisms showing vertical displacement due to influence from PTE East Pilot and Enlargement excavations.
Chainage Date of First Influence Initial Value (mm) Post Value (mm) Observed Settlement (mm) 310 21.06.2013 8.3 17.6 9.3 330 25.06.2013 2.4 15.8 13.4 350 07.07.2013 3.1 19.5 16.4 370 19.08.2013 5.9 20.7 14.8 390 29.08.2013 9.6 32.0 22.4 410 04.09.2013 8.9 24.6 15.7 430 10.09.2013 6.3 16.7 10.4 450 15.09.2013 3.4 9.3 5.9 Table 1 – Observed settlement within the PO tunnel during the excavation of PTW West Pilot, summarised from Figure 30.
Platform Eastbound East Enlargement
The breakout of Platform Tunnel Eastbound East Enlargement from CP6 began on 19th October 2013. Undertaken across 4 periods of mining, the final excavation of the reception chamber was completed on 5th March 2014.
Figure 30 shows the changing vertical distance between the PO tunnel and PTE East between PO chainage 290 to 450, where the PO tunnel is increasing in depth towards the east. At chainage 440, the PO tunnel invert comes to within approximately 450 mm of the platform tunnel, demonstrating the complexity and care required during excavation.
Chainage Date of First Influence Initial Value (mm) Post Value (mm) Observed Settlement (mm) 310 10.11.2013 21.9 41.5 19.6 330 16.11.2013 17.7 46.4 28.7 350 04.01.2014 24.6 48.5 23.9 370 07.01.2014 25.6 61.1 35.5 390 10.01.2014 37.0 70.8 33.8 410 26.01.2014 28.3 45.4 17.1 430 10.02.2014 17.5 31.3 13.8 450 19.02.2014 9.9 16.7 6.8 Table 2 – Observed settlement within the PO tunnel during the excavation of PTW West Enlargement, Summarised from Figure 30.
Table 2 summarises the vertical displacement seen from PTE East Enlargement along the crown of the PO tunnel between chainage 310 and 450. Similar to the vertical displacement resulting from the platform tunnel pilot, an increasing reaction is observed from chainage 310 towards 390. Above the reception chamber however (PO chainage 410, 430 & 450), the influence from mining is far less.
Figure 32. PO tunnel chainage 330, the calculated relative movement between the crown, shoulders and trackbed. Where positive movement indicates divergence and negative movement indicates convergence.
Summary
During the excavation of PTE East, a maximum influence of 56.2 mm was observed within the PO tunnel in the crown of chainage 390. Observed settlement across earlier chainages, i.e. 310 to 370, were seen gradually increasing in reaction closer to the maximum at chainage 390. It should be remembered that the PO tunnel axis is not aligned with the platform tunnel until PO chainage 370, where chainage 310 to 350 are offset towards the south, away from the expected position of maximum influence. This offset from the platform tunnel axis explains why less settlement is seen at these chainages.
Further east of chainage 390, above the reception chamber, it is observed that a much lower influence is identified from the excavation, during both the pilot and enlargement stages. Across this area, the two tunnels are within as 450 mm of each other. There are two possible explanations for this less than expected reaction.
PO Tunnel Chainage Excavated Distance Beneath PO Tunnel Array Time Period Settlement (mm) 350 1D 4 Days 9 370 1D 4 Days 15.5 390 1D 5 Days 16 410 1D 8 Days 8.5 430 1D 7 Days 6.7 Table 3 – Varying excavation rates of PTE East Enlargement beneath the PO tunnel monitoring arrays and the subsequent total settlement observed.
The first explanation, is the rate of excavation varying along the drive of PTE East. Table 3, displaying the excavation rate of 1 tunnel diameter length beneath PO tunnel, shows a trend of more overall settlement resulting from a faster excavation, with the exception of PO tunnel chainage 350, which is not positioned directly above the axis of PTE East.
Although it appears a faster excavation results in a larger overall settlement, other factors should also take into account. These include any change in SCL quality, thickness or the down time between the excavation of mining advances. As all these factors are difficult to relate back to the PO tunnel settlement, it is unlikely the excavation rate would be the dominating factor involved. PO tunnel chainage 450 has not been included in the discussion due it being close to the platform tunnel headwall, were an infinite tunnel settlement rate does not apply.
The second explanation is the reducing distance between the two tunnels towards the east. As there is a lower volume of ground in between the tunnels in this area, it should mean less consolidation can ultimately take place. This leads to the PO tunnel effectively “sitting” on the platform tunnel, and so the two settle together.
To test this theory, a comparison between the PO tunnel and platform tunnel settlement rates can be made. An early obstacle however is that the monitoring within the platform tunnel cannot be installed until it is sufficiently behind a working face. This means only after excavation has already passed beneath the PO tunnel array can the two be compared.
Within the platform tunnel, a monitoring array was installed in line with the PO tunnel prism array at chainage 430. Measurements of the array first began on 23rd February 2014, a day after it was excavated. Between its base reading and 24th March 2014, a total movement of approximately 7-8 mm were observed in the crown. Within the PO tunnel, the trackbed measured by prisms P4 and P5 (Figure 5), saw a vertical displacement of 9 mm and 11 mm respectively. Whilst the two readings do not appear to completely match, factors such as monitoring accuracy (discussed later) and the precise location of the prisms should be considered, where the platform tunnel installation of the crown prism, may not be precisely in line with the trackbed ATS array of PO tunnel chainage 430.
Since the excavation of PTE East, between the 8th March and 5th May 2014, these two arrays have both measured a matching trend of 2 mm vertical displacement seen as long term settlement.
Conclusions and Limitations
During the excavation of C510 between November 2011 and August 2014, there has been an observed reaction to mining seen within the PO tunnel. Figure 33 compares the maximum observed ATS and manual roadstuds readings from 26th November 2014 with the final predicted model.
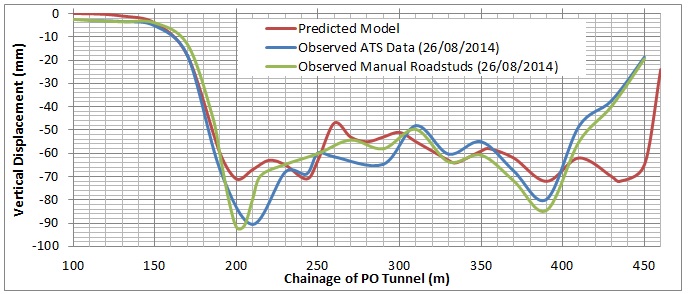
Figure 33 – The total vertical displacement observed across the length of the PO tunnel in comparison to the predicted model [2].
These displacements have also included influence from various tunnel drives not covered in this paper, but which were being excavated across the same time period.
Manual Roadstuds vs. Automated Total Station Prisms
The discussion of this paper has solely focused on data available from the ATS prism system. This has been due to two reasons. In the first instance, the ATS data has been recorded in real time, giving a much more reliable observation between when a reaction is first observed and the time period it remains for. Secondly, the ATS prisms record movement in 3 dimensions, where horizontal movement can also be observed. This has allowed for the calculation of relative movement between prisms to identify areas of convergence and divergence around the tunnel lining.
When comparing the ATS and roadstud systems in Figure 33, it can be seen both data sets have observed all the same reactions on the PO tunnel due to C510. Overall, the two systems are fairly well matched in observing displacement, usually to within 4 mm. Only two areas of particular disagreement can be identified; Chainage 270, where the ATS prisms have observed more settlement than the roadstuds, and chainage 200 – 210, where the manual roadstuds have a more reliable recording of settlement location, as this focused area has studs positioned at 5 m intervals.
Most disagreements between the two systems exist where one has less positional monitoring frequency than the other. An example of this is between chainage 230 and 250, where the ATS array of chainage 243 was able to identify the maximum influence from AP7 West. As no roadstud was present at this chainage, the manual system has not managed to identify the influence, seen in Figure 33.
Observed Settlement vs. Predicted Model
Figure 33 also compares the observed settlement with that of the predicted model, where overall, more settlement was observed than the model anticipated. An exception however, being between chainage 410 to 450, where very little settlement was observed. Whilst more settlement was seen during the direct influence of an excavation, a major oversight during the planning of C510 was the understudied effect of long term settlement across the area.
This has resulted in locations along the PO tunnel where settlement is far in excess of the prediction, such as chainage 210, where the excavation of PTW West passed beneath the PO tunnel. At this location, geological records from PTW West at the time showed a sand channel which was encountered in the invert of the enlargement. As with procedure, the sand was depressurised, reducing any water build up. This depressurisation of the ground explains the far greater long term settlement observed at chainage 210, compared to any other monitored chainage within the C510 zone of influence.
On the contrary, chainage 410 to 450 have seen far less settlement than predicted by the model [2]. As discussed previously, this is likely due to the reducing vertical displacement between the PO tunnel and PTE East, where the two tunnels begin to move at the same rate due to the very small amount of consolidation possible in the London Clay which separates them. The reaction of horizontal movement seen during the course of C510 has varied greatly. Overall, more movement has occurred in the north – south axis, than which has been seen perpendicular in the east – west. This is due to the PO tunnel running predominantly east – west, where movement is much more likely to occur perpendicular to the tunnel axis.
The north -south axis of the PO tunnel monitoring arrays have, since the early excavation of AS1, been extremely prone to large amounts of scatter due to monitoring inaccuracy.
Despite this however, calculated trends of the average reading have been able to identify the large influence seen during the excavation of cross passages since February 2014. These tunnels, running north -south in their axis, have caused perpendicular influence on areas of the PO tunnel which run close by. Across the course of C510, the maximum horizontal displacement to the south has occurred across chainage 410 and 430, where influence from the nearby shaft excavation of Blomfield Box has greatly affected the tunnel. In the west, the greatest horizontal movement towards the north has occurred at chainage 190. This particular array has been affected greatly by cross passage excavation since the excavation of PTW West. As no excavation has taken place south of chainage 190, only displacement towards the north was observed, avoiding any counteracting offset seen from different excavation drives, such as that experienced by chainage 270, positioned between AS1, CP6, AP7 West and the westbound excavation of PTE.
Limitations
Whilst varying factors have caused a difference between the movement which was predicted and that which was actually observed, it should be noted that the mining schedule of C510 has not matched the assumed order of construction stages considered by the model [2].
Because of this, it is difficult to compare the direct modelled influence of a particular mining drive, to what was actually observed, if the history of excavation prior to that drive has resulted in a different order of sequence which can mask the influence of later stages of excavation within long term settlement trends.
Another contributing limitation to observing direct influence on the PO tunnel is the cut off between direct influence and the beginning of long term settlement. Whilst in many cases this is clear, such as influence at PO tunnel chainage 190 from PTW West (Figure 25), areas of the PO tunnel between different tunnel drives can be difficult in identifying where direct influence ends, due to the additional factor of long term settlement, such as the original excavation of AS1, seen in Figure 10.
Further Expansion
As this paper only covers influence on the PO tunnel from C510 between November 2011 and August 2014, it is important to continue work to identify any further influence from the remaining excavation stages yet to be undertaken. In addition to this, an expansion to include movement observed from other nearby Crossrail projects could be included, such as the influence on the PO tunnel beyond chainage 450. A final area of expansion should also be further analysis of the squat and elongation of the PO tunnel cross section, observed as convergence and divergence. Whilst the introduction of trackbed monitoring was introduced after some excavations had already commenced, limiting the findings of their full effect on the PO tunnel, further monitoring can still be used to identify where stress is likely building along the PO tunnel lining in the future.
References
[1] Postal Heritage Trust, “Mail Rail,” [Online]. Available: http://www.postalheritage.org.uk/page/mailrail. [Accessed 03 04 2014]. [2] Crossrail, “Assessment of Ground Movement Effects on Post Office Tunnel at Liverpool St Station. C122-OVE-C2-RAN-C101-00016,” London, 2011. [3] C510, BBMV, “Monitoring Data,” London, 2014. [4] R. Trench and E. Hillman, London Under London, London: John Murray, 1993. [5] C. Karslake, “Londons Post Office Railway,” The Rail Webring, [Online]. Available: http://www.mailrail.co.uk/. [Accessed 09 09 2014]. [6] R. J. Mair, R. N. Taylor and A. Bracegirdle, “Subsurface setlement profiles above tunnels in clay,” Geotechnique, vol. 43, no. 2, pp. 315-320, 1993. [7] Taylor, “Tunnelling in soft ground in the UK.,” in Underground construction in soft ground., K. Kujita and O. Kusakabe, Eds., Balkema, 1995, pp. 123-126. -
Authors


Dr Alfred Stärk Dipl Ing Dr Ing - BeMo Tunnelling
Dr Alfred Stärk is Chief Geotechnical Engineer and Engineering Manager at BBMV for Crossrail Contract 510 ‘Whitechapel and Liverpool Street Station Tunnels’ since March of 2011. He started his career at the University of Hanover, Germany, where he worked as assistant professor and consultant for 10 years. In 2002 he joined BeMo Tunnelling, Innsbruck, Austria. He now has 25 years of experience in large-scale tunnelling, mainly with sprayed concrete lining in soft ground.