Inclinometer Analysis of Tunnelling Induced Ground Movement at Liverpool Street Station
Document
type: Technical Paper
Author:
Larisa Jimenez Rangel, Dr Alfred Stärk Dipl Ing Dr Ing, ICE Publishing
Publication
Date: 07/09/2015
-
Read the full document
Key Words
inclinometer, horizontal displacement, horizontal transverse distance, design predictions, interaction between tunnels, London Clay, SCL tunnels
Notation
(+) Positive
(-) Negative
D: Tunnel diameter
d: Horizontal distance to tunnel lining.
ZOI: zone of excavation influence
GSL: Ground surface level.
PTE: Platform Tunnel Eastbound.
PTW: Platform Tunnel Westbound
AP7: Access Passage.1. Instrumentation location and Ground movement’s Measurement.
In total 22 inclinometers are established in the vicinity of LIV station tunnels, 10 of which are manually read and 12 are automated. Due to instruments location and quality of the data the analysis contains only eight manual inclinometers listed in Table1 and the location is shown in Figure 1.
The Manual instruments type used is Slope Indicator, and includes the casing, probe, control cable and the readout. Inside the probe are two tilt sensors one plane parallel to the wheel and the other plane perpendicular to the wheel. The casing is installed within one set of groove aligned with the expected direction of the movements (towards the excavation).
Inclinometers measure the horizontal displacement in two perpendicular plane and the movement orientation established is positive (+) in the parallel direction towards “East” and in the perpendicular direction towards “South” as shown in Figure 1.
After the inclinometers were installed base readings has been taken. Subsequent surveys are compared to the initial. Displacements versus time and distance to the tunnel face were used to visualise the effects of tunnelling on the inclinometers, to calculate displacement magnitude, direction, to identify and understand the cause of probable trends, and potential concern or adverse situation.
Instrument Distance to axis (m) Chainage of location of inclinometer related to the Tunnel (m) No IM Type PTE AP7 PTW PTEE PTEW AP7W PTWE PTWW 10502 Manual 7,8 7,5 10503 Manual 8,5 10 10504 Manual 8,8 13,8 16 16 10505 Manual 5,9 15,2 13 13 10509 Manual 7,4 27 11001 Manual 5,8 134 11201 Manual 8,4 65 10402 Manual 8,024 91 Table 1 – Inclinometers position
The purpose of this analysis is to review the monitoring results, compare them within the designer predictions, to determine and evaluate the following aspects:
- The horizontal movements are towards the excavation.
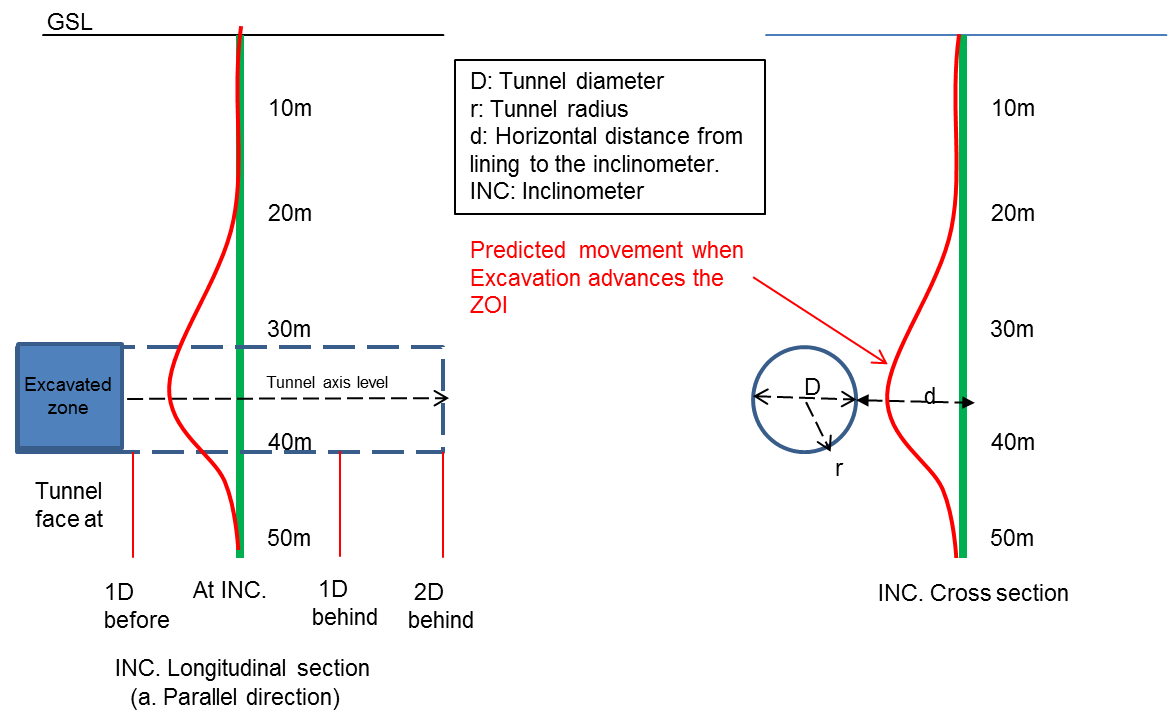
- The maximum displacements occurred at Tunnel axis as shown Figure 2b.
- The magnitude of predicted movements depends on the distance between The Tunnel Lining to the monitored inclinometer “d”.
- The ground reacts to the approaching tunnel excavation before the heading actually reach a particular monitoring point and the Zone of Influence (ZOI) of tunnel excavation is about ± 2D before and behind monitoring point, where D is the Tunnel diameter (D. Chapman, N. Metje & A. Stärk. 2010 [1]
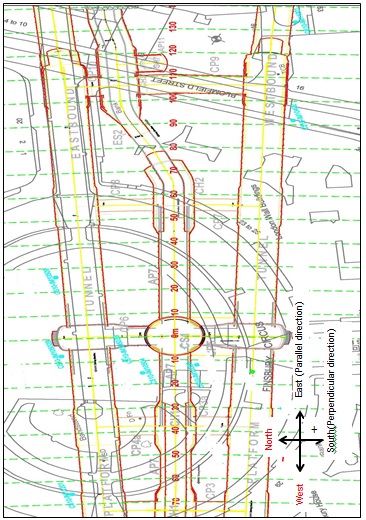
Figure 1 – Instruments location plan
2. Ground movement prediction:
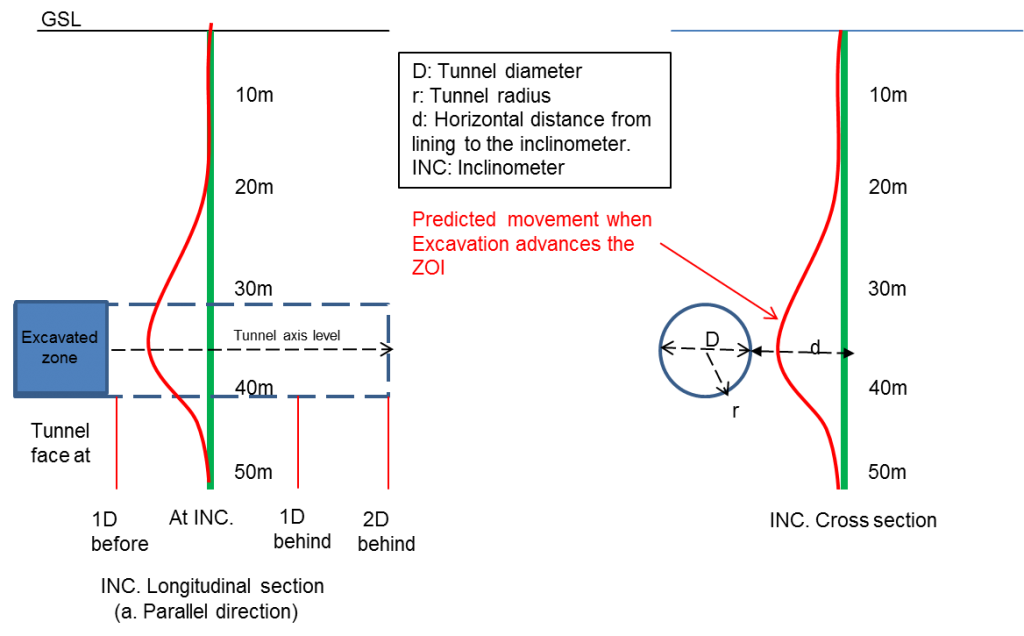
Figure 2 – Inclinometer position in relation to the tunnel and predicted movement direction
During the design stage parallel and perpendicular displacement caused by the construction of SCL Pilot and Enlargement tunnel had been estimated. Those calculations values have been used to prepare figures and graph and are presented in the following figures. Figure 2 give a picture which direction might the instrument move when the tunnel approaches. Figures 3 to 6 are displacement against horizontal distance “d” to tunnel lining graphs which values provide some ideas of the magnitude of the displacement. As shown, there is a relation between “d” and displacements, the closer the instrument to tunnel lining is the higher is the ground reaction, and when the tunnel approaches the instrument moves inward the excavation on the perpendicular direction and towards the tunnel excavation on the parallel direction.
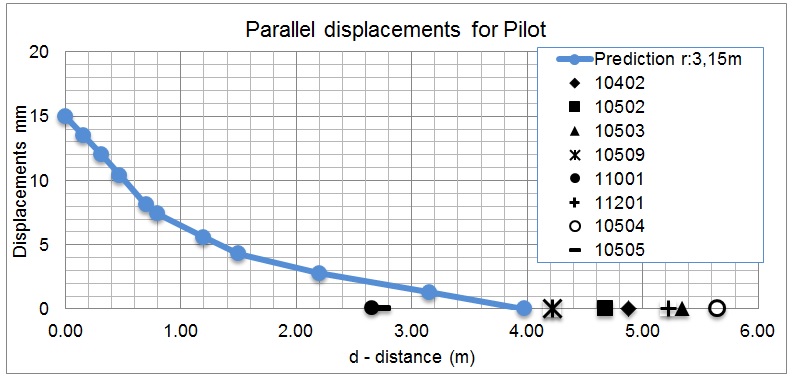
Figure 3 – Predicted ground movements vs Actual values parallel to Pilot Tunnel
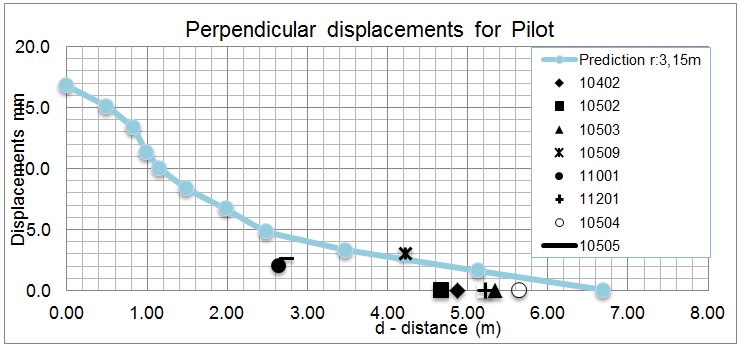
Figure 4 – Predicted ground movements Vs. Actual values to perpendicular Tunnel
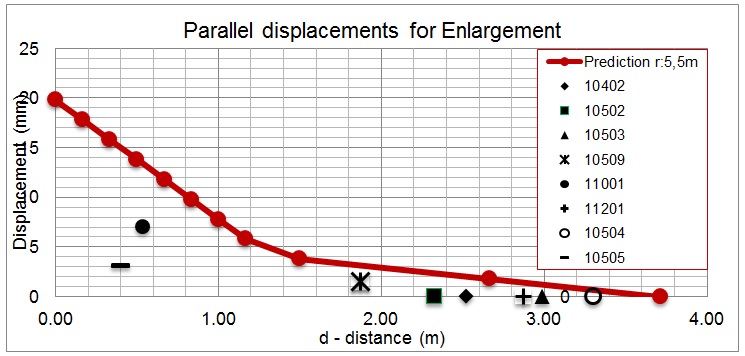
Figure 5 – Predicted ground movements Vs. Actual values parallel to Enlargement Tunnel.
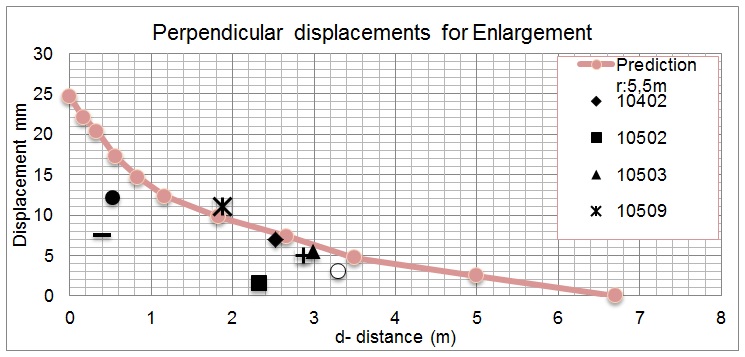
Figure 6 – Predicted ground movements vs. Actual values parallel to Tunnel
3. Analysis of measured ground movement.
3.1 Data Results
Instruments results are presented below. The tables 2, 3 and figures 3,4,5,6 contain the measurement for the construction of Pilot and Enlargements. Movement direction is shown in Figures 7 and 8. The measured displacements are generally small within in the order of 10mm. The undisturbed instrument showed monitoring accuracy of ± 3mm or eve more. In order identify this trend the graph displacement vs. time graph are included only those instrument where maximum movement was obtained IM11001,10505,10509 (highlighted in yellow)
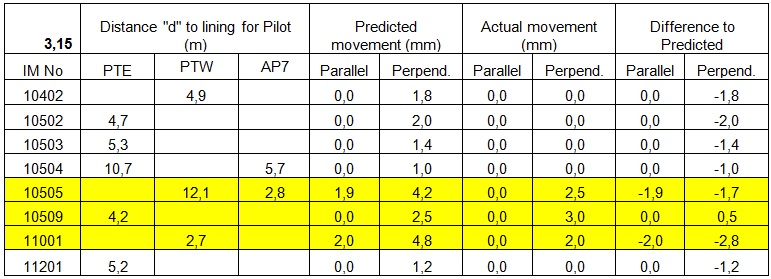
Table 2 – Predicted versus Actual displacements during the construction of the Pilot Tunnels.
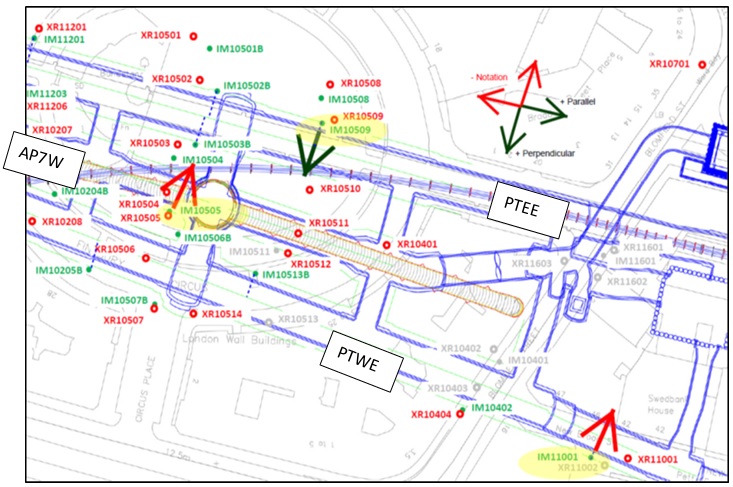
Figure 7 – Inclinometers actual behaviour during the construction of the Pilot Tunnel
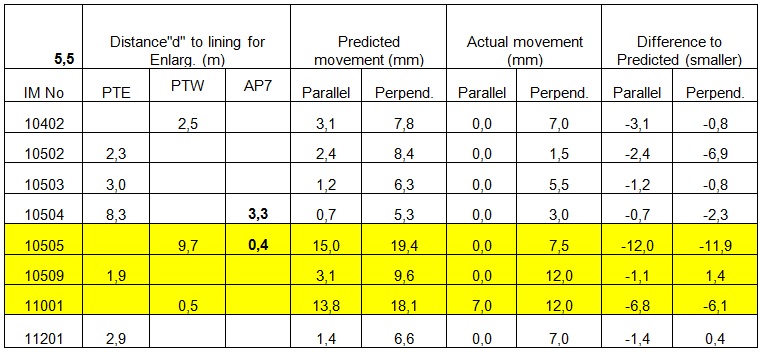
Table 3 – Predicted versus Actual displacements during the construction of the Enlargement.
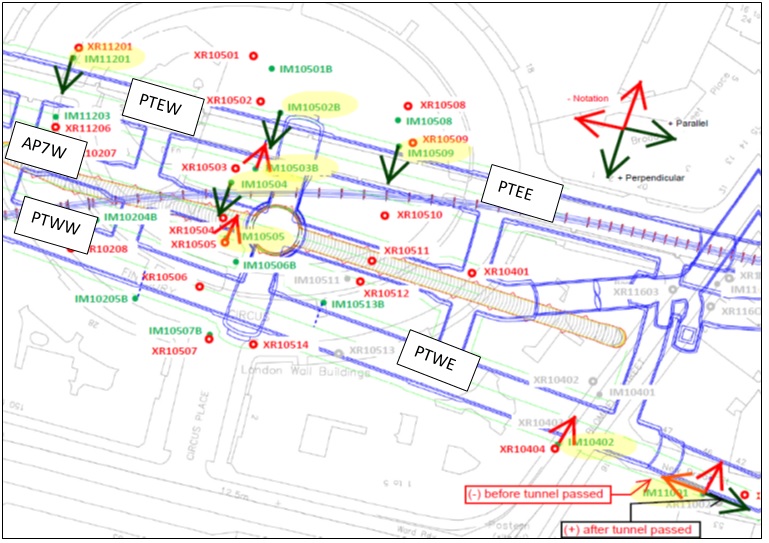
Figure 8 – Inclinometers actual behaviour during the construction of the Enlargement
Summary of Parallel displacement.
Maximum predicted displacement for Pilot 1.9mm.
Maximum predicted displacement for Enlargement 15mm.
Maximum displacement measured between 0 to 5mm.
The maximum of this range was during the passage of the PTWE Enlargement tunnel, at the axis level and for IM11001 in April 2014 where the horizontal distance from the instrument to the Enlargement lining circa 0.5m.
Instruments IM10503, IM10505 and IM10509 appeared to have a small reaction but the trend of the cumulative displacement were not consistence. From the examination of the graph 9, 10 and 11 jumps greater than 5mm in all sensors were noticed when no excavation woks occurred, affecting the accuracy of the data.
These Graphs also show that no parallel movement due to the mining of the Pilot Tunnel were measured at any Instrument.
The direction of the movements was as predicts, follow the excavation and confirmed by the entire monitored instrument.
The magnitude of the movement was less than predicted.
Summary of Perpendicular displacements.
Maximum predicted displacement for Pilot 4.8mm.
Maximum predicted displacement for Enlargement: 20.8mm.
Maximum displacement measured between 1.5 to 12mm. The maximum of this range also was for IM11001 and IM10509 during the passage of the PTWE and PTEE Enlargement tunnels at axis level.
Monitoring data showed reaction to the mining of the Pilot Tunnel but smaller than the Enlargement and less than predicted.
The direction of the movement was towards the excavation and confirmed by all monitored instrument.
3.2 Inclinometer response to tunnel excavation.
The displacement vs. time graphs presented only include the measurements of four sensors at the following levels: 5m above tunnel crown, crown, axis and invert.
IM11001. Inclinometer was installed 5.8m parallel to PTEW Axis at Chainage 134.
Figures 9a and 9b included the data processed from April 2013 and show the full reading history of the inclinometer in both direction parallel and perpendicular. It is visible how the Instrument reacted during the tunnels construction, Pilot (October 2013) and Enlargement (end on April 2014). It can be seen the measurement remained stable within monitoring accuracy when no mining works occurred in the vicinity of IM11001. Jumps and steps also have been seen giving false movement in magnitude and direction which are not related to any construction activities.
Figures 9c and 9d give a picture of the movement associated to the mining of PTEW when the tunnel passed the ZOI.
Influence of Pilot Tunnel (Figures 9c)
Tunnel diameter: 6.3m
Tunnel Construction period: 13.July – 28.Octuber.13.
Tunnel passed the inclinometer ZOI± 2D (Ch120-150): 14 – 26.Octuber.13.
Horizontal distance “d” between to the Pilot Lining: 2.7m.
Key Location:
- Instrument first reaction: at Chainage128 approximately 1D before the instrument. Displacement in the perpendicular direction was -1mm (negative movement is towards north) and in the parallel direction 0mm.
- The face reached the instrument at Ch134. The movement increased in the perpendicular direction up to – 5mm and in the parallel direction 0mm.
- Displacement stabilised at Chainage140, 1D after the tunnel passed instrument.
The monitoring data showed no reactions to the approaching pilot tunnel in the parallel direction. It is also has shown a clear tendency of (-) movement towards the North up to a maximum of 5mm and stabilised before left the ZOI.
Influence of Enlargement tunnel (Figure 9d)
Tunnel diameter: 11m
Tunnel Construction period: 13.Nov.13 – 8.May.14.
Face Passed the ZOI (Ch110-160): 09.April – 08.May.14.
Horizontal distance “d” between to the Enl. Lining: 0.5m
Key Location:
- Instrument first reaction was at Chainage123, 1D before the tunnel face. Approximately -1mm in the parallel direction (negative is towards west) and -3mm in the perpendicular direction (towards North). Thereafter settlement stopped for 5 days but was stable within monitoring accuracy.
- The face reached the instrument at Chainage134. The horizontal displacements in the parallel direction was -4mm and in the perpendicular directions was – 5mm (West-North movement)
- At Chainage 140 tunnel has passed the instrument. Change in the parallel direction was noticed; measurement values decreased by 3mm and started moving towards the opposite direction to the East. Movement in the perpendicular direction continued up to – 8mm.
- At Chainage 150 displacement started stabilising and the instrument has moved in the parallel + 7mm and in the perpendicular -12mm (East-North movements)
- The Instrument stabilized in both directions before arrived at Ch160 and less 2D behind the face. The total movements were circa 7-8mm to the east and 12mm to the north.
The behaviour at Ch140 in the parallel location confirmed the instrument moved following the excavation, backwards (-) movement before the tunnel approach the instruments at Ch135, then immediately changed the direction and moved forward (+) until stabilised. In the perpendicular direction the trend of the displacement was more consistent for a total – 12mm (towards north).
Figures 9f, 9g show the internal monitoring on the already excavated cross section at Ch131. It can be seen that PTEW enlargement experience d a maximum 15mm of vertical settlements and horizontal displacement has remained stable in both side the right and left.
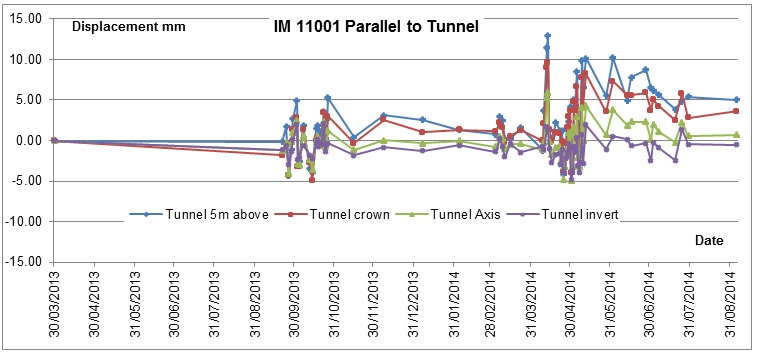
Figure 9a – Parallel displacement vs. Time
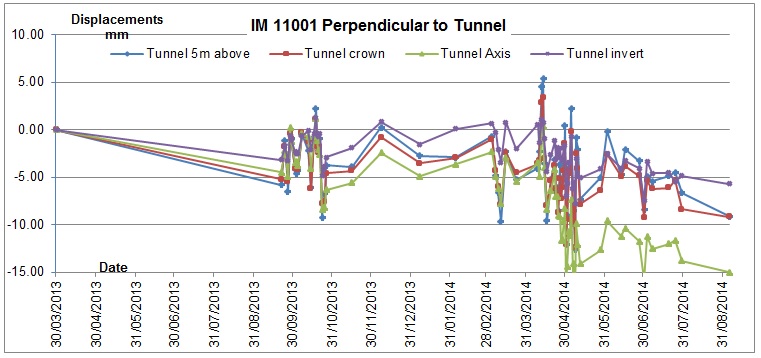
Figure 9b – Perpendicular displacement vs. Time
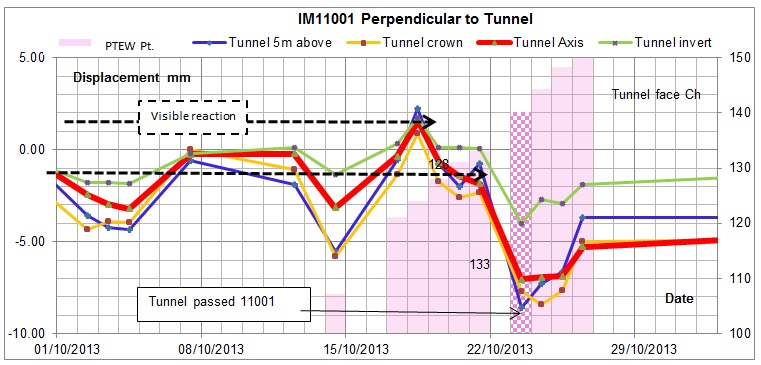
Figure 9c – Influence of Pilot tunnel Displacement vs. Time
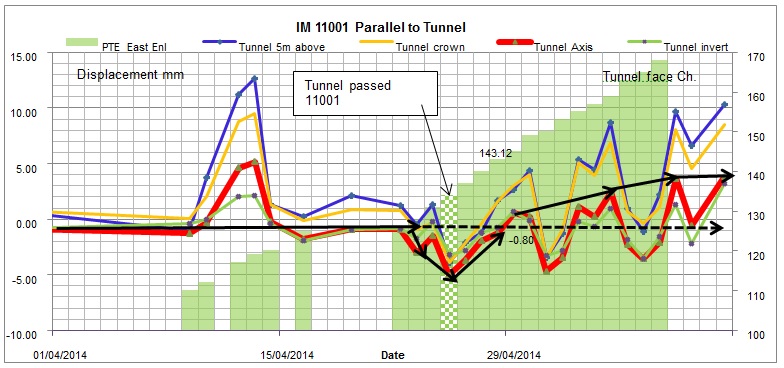
Figure 9d – Influence of Enlargement Tunnel, Ch. vs. Displacement vs. Time
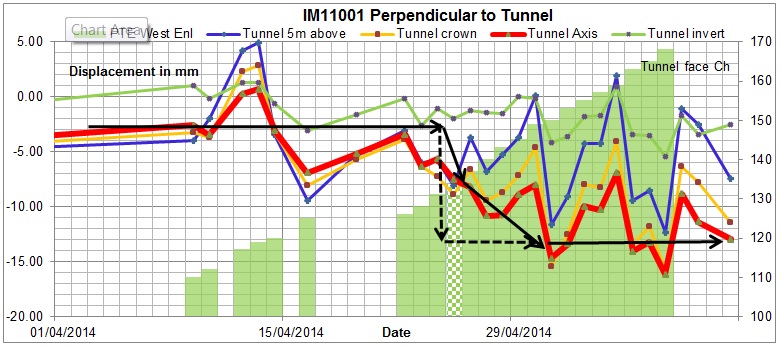
Figure 9e – Influence of Enlargement Tunnel, Ch. Vs. Displacement vs. Time
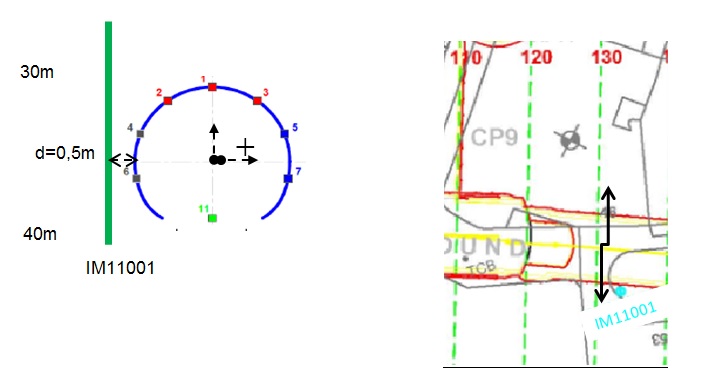
Figure 9f – PTWE Cross section A-A
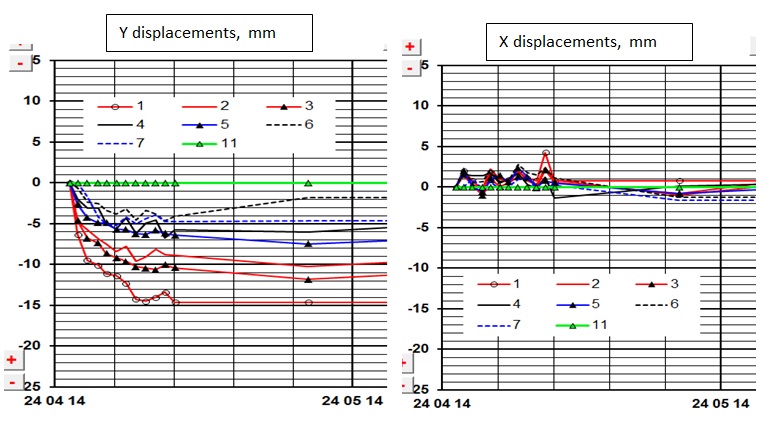
Figure 9g – Enlargement Internal Monitoring Displacement vs. Time graphs at ch131.
IM10509. Inclinometer is located 7.8m parallel to PTEE Axis at Chainage 27.
Figures 10a and 10b included the data processed from February 2013 and show the full
reading history of the inclinometer in both direction parallel and perpendicular. It is visible
how the Instrument reacted during the construction of tunnel Pilot (July 2013) and
Enlargement (November 2013). Anomalous jumps an spike have been seen in the parallel direction when any mining works where carry out affecting the accuracy of data and identification the trend of movement.
Figures 10c and 10d show in detail the movement associated to the mining of PTEE when the tunnel passed the ZOIInfluence of Pilot Tunnel (Figures 10c)
Tunnel Construction period: 23.June – 27.Septiembre.13
Tunnel Face passed ZOI ±2D (Ch15-40): 23.June to 09.July.13
Horizontal distance between to the Pilot Lining: 4.2m
Key Location:- Instrument first reaction at Chainage 21. There was +1mm movement only in the perpendicular direction within monitoring accuracy. (+ is towards south)
- The tunnel face approached the instrument at Chainage 27. Movement in the perpendicular direction was (+) 4mm and the parallel 0mm
- At Chainage 33 mining works stopped for 6 days and apparent increase of additional 2mm in the perpendicular direction.
- Mining works restarted. It can be seen that when Tunnel was at Ch47 displacement values decreased and returned to the former level. Afterwards stabilised.
The monitoring data showed no reaction to the approaching of the pilot tunnel in the parallel direction. In the perpendicular direction reaction started 1D behind the instrument for a total + 4mm movements towards the South. It is also has shown an anomalous increase of additional 2mm when no mining works were carried out but the values returned to the former level when works restarted. No additional movement has been seen after and stabilised at Ch47 within monitoring accuracy.
Influence of Enlargement tunnel (Figures 10d-e)
Tunnel Construction period: 10.Octuber.13 – 6.March.14
Face passed ZOI (Ch5-50): 06 – 21.November.14.
Horizontal distance between to the Enl. Lining: 1.9m
Key Location:- Chainage 5-21: Inclinometer first reaction occurred at Chainag16, 1D behind the instrument. Movement was +2mm in the perpendicular direction (+ is towards south) and in the parallel direction 5mm jump occurred, an apparent (-) movement at Ch12, afterwards this tendency did not continue and has remained stable during the approaching to the tunnel.
- Tunnel face approached the Inclinometer at Chainage 27: Movement in the perpendicular direction was (+) up to 10mm. A + 2mm jump in the parallel direction appeared but the tendency movement did not continue.
- Chainage 40-45: Tunnel has passed the instrument and movement slight increased with in monitoring accuracy by 2mm. Thereafter it has stabilised. Movement in the parallel direction was no clear for a total (+) 0mm and in the perpendicular the total movement was (+) 12mm.
From the examination of the graph, it is appear that there was not a strong evidence of the tendency of parallel movement and this 2-5mm is considered to be a result of the variability of the monitoring accuracy and likely to be affected by the scatters on data. Perpendicular displacements measured values was 11mm to the South and inwards the excavation
Figures 10e-f shows the Internal monitoring on the cross section at Ch29. It is visible small divergences, PTEE enlargement experienced a maximum of 18mm vertical displacement and 3-5mm horizontal displacement in the right side after the tunnel passed the ZOI of IM10509.
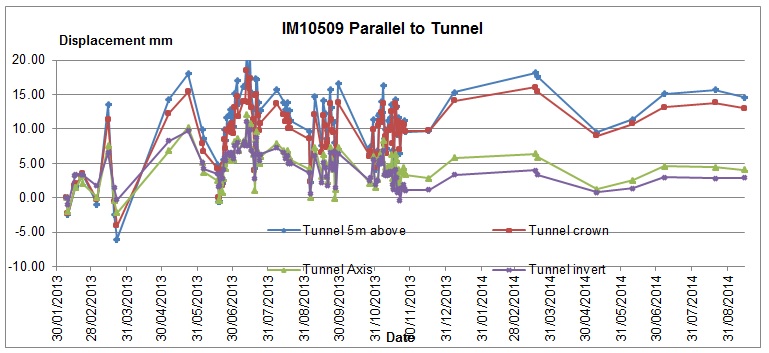 Figure10a – Parallel displacement vs. Time
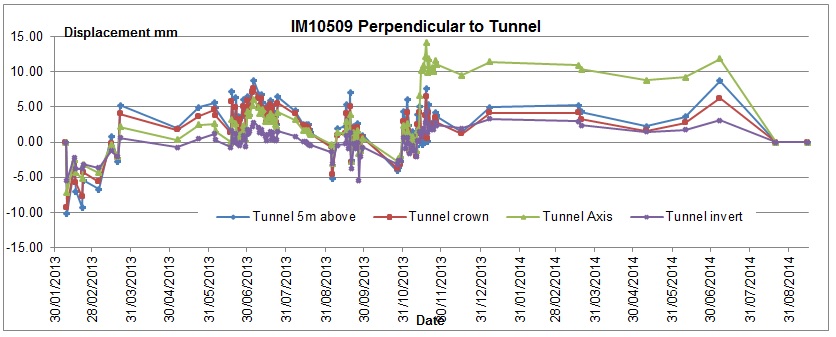 Figure 10b – Perpendicular displacement vs. Time
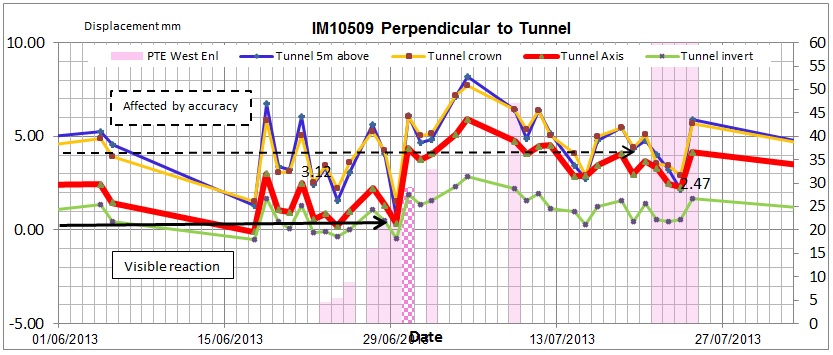
Figure 10c – Influence of Pilot tunnel Displacement vs. Time
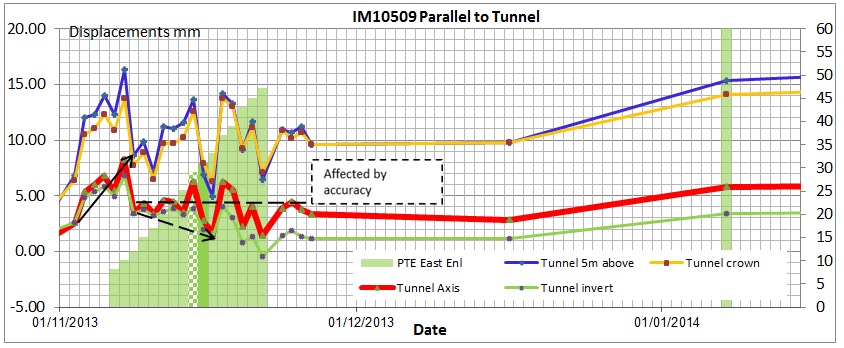
Figure 10d – Influence of Enlargement tunnel Displacement vs. Time
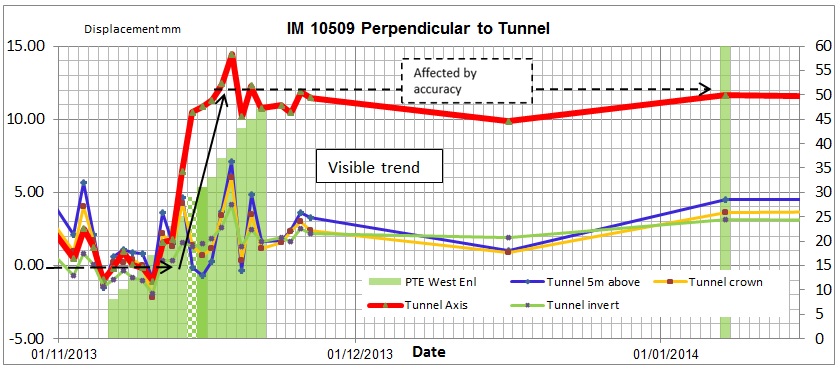 Figure10d-e – Influence of Enlargement tunnel Displacement vs. Time
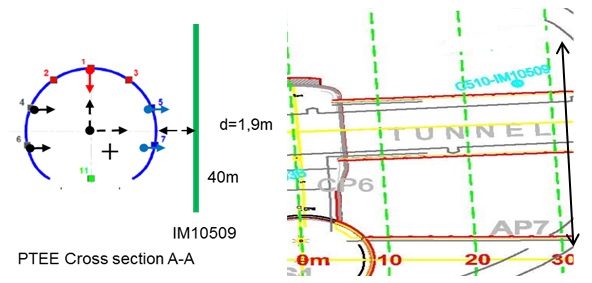 Figure10e – PTEE cross-section at Ch29
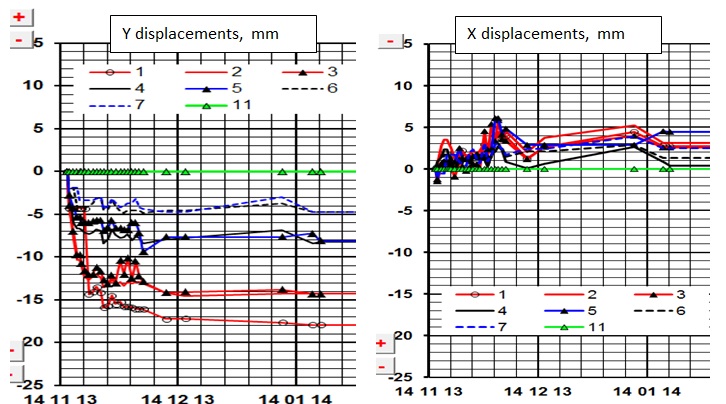
Figure 10f – Enlargement Internal Monitoring Displacement vs. Time graphs PTEE – Ch29
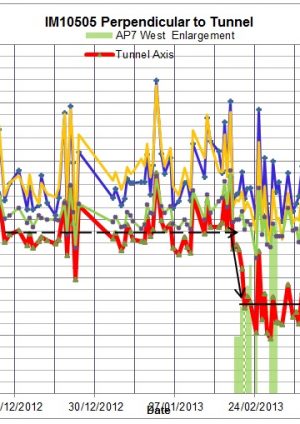
M10505. Inclinometer is located at Chainage 13, 5.9m parallel to AP7 west and 15,2m parallel to PTWW axis.
Figures11a and 11b include the data processed from November 2012 and show the full reading history of the inclinometer in both direction parallel and perpendicular. It is visible the Instrument reaction during the construction of tunnel AP7W Pilot (November 2012) and Enlargement (February-March 2013). In this graph also shows the effect the horizontal distance “d” on measured displacement, is clear horizontal displacements were stable during the excavation of PTWW within monitoring accuracy. Significant steps and jumps have been noticed when no excavation occurred in the ZOI of the instrument which are considered no real movement in magnitude and direction.Figure 11c and 11d show in detail the movement associated to the mining of AP7 West when the tunnel passed the ZOI.
Influence of Pilot Tunnel (Figure 11c)
Tunnel diameter: 6.3m
Tunnel Construction period: 3.Nov.12 – 3.May.13.
Tunnel Face passed ZOI (Ch. 0 – 25) : 03.11 to 10.11.12
Horizontal distance between to the Pilot Lining: 2.8m
Key Location- Instrument first reaction at Chainage 12: Instrument first reaction, (-) movements only in the perpendicular direction within monitoring accuracy. ( – is towards North)
- Tunnel face approached the instrument at Chainage 13. The perpendicular movements were (-) between 3-4mm and in the parallel was 0mm.
- Chainage 19-21: Displacement appeared to start stabilising. There was not increased of the movement.
The monitoring data showed no reactions to the approaching of the pilot tunnel in the parallel direction and – tendency of movement towards North up to 4mm, no additional movement has been seen before the tunnel left ZOI, less than 1D behind the inclinometer.
Influence of Enlargement Tunnel (Figure 11d-e)
Tunnel diameter: 11m
Tunnel Construction period: 17.February – 17.April.13.
Face passed ZOI ± 2D (Ch. 0-35): 17.02 – 27.03.13.
Horizontal distance between to the Enl. Lining: 0.4m
Key Location:- Instrument first reaction occurred at Chainage 8. Small movement of approximately (-) 1mm in the perpendicular direction (to north). In the parallel direction an apparent (+) reaction was noticed, but afterwards the tendency of the movement did not continue and the levels were stable during the approaching to the tunnel.
- Tunnel face approached the instrument at Chainag13. Movement in the perpendicular direction was (-) 5mm and in the parallel direction appeared to have a small (-) reaction of 2 mm (towards west), but the tendency was not consistent.
- Chainage 15: Tunnel has passed the instrument and movement appeared stabilising within monitoring accuracy.
- Chainge 24: Instrument was stable in both directions.
Reactions in the parallel directions during the excavations have been affected by the scatters on data and again there is not strong evidence of the tendency of the movement. Perpendicular displacements measured values was 5mm to the North and inwards the excavation. Graphs for IM10505 also showed 3mm movements due to the mining of the pilot.
Figure 11e-f are shown Internal monitoring on the already excavated cross section at Ch13.
It can be seen that AP7W enlargement experienced a maximum 13mm of verticalsettlements and horizontal displacement has remained stable in both side the right and left within monitoring accuracy.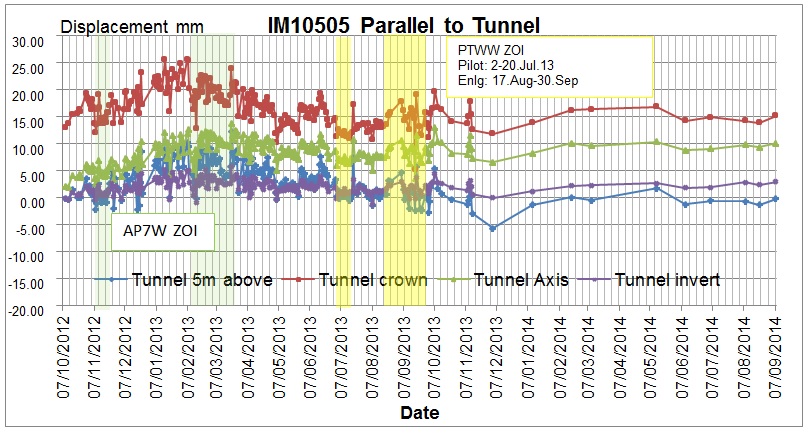 Figure 11a – Parallel displacement vs. Time
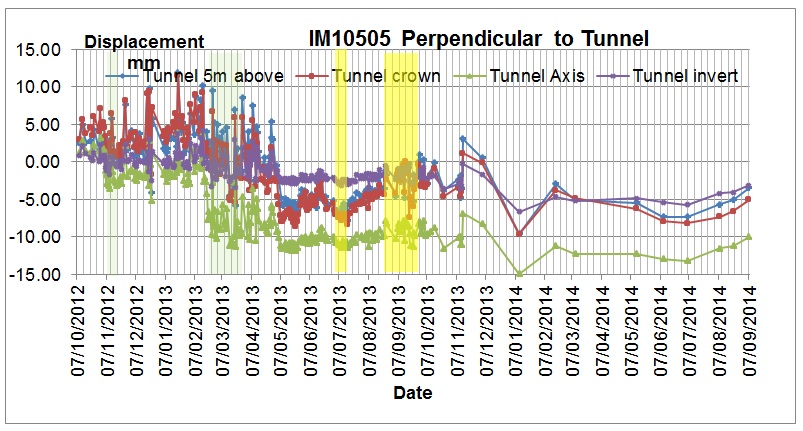 Figure 12b – Perpendicular displacement vs. Time
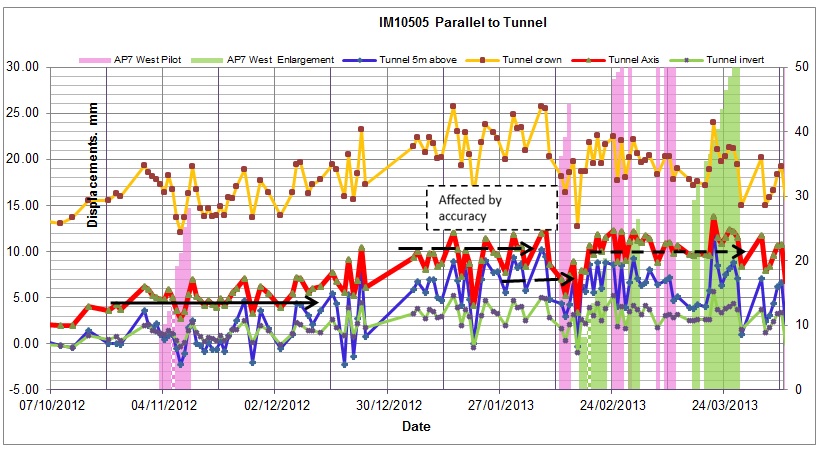 Figure 11c – Influence of Pilot & Enlargement tunnel Displacement vs. Time
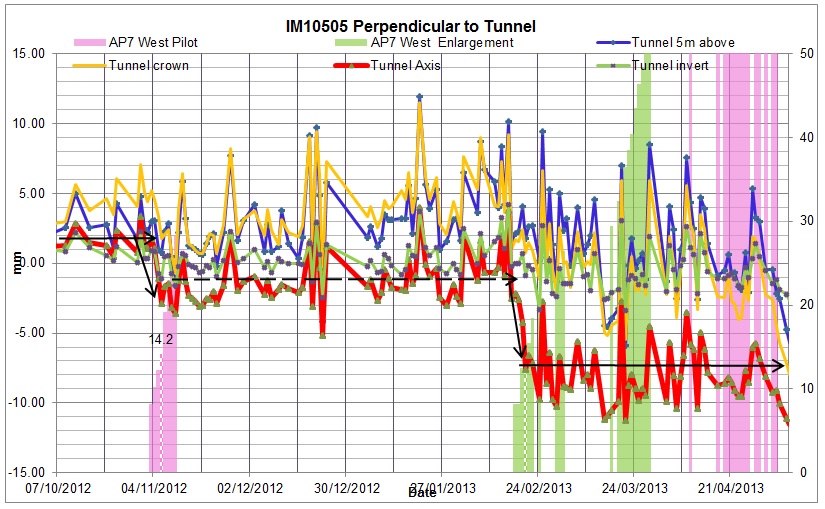
Figure 11d – Influence of Pilot & Enlargement tunnel Displacement vs. Time
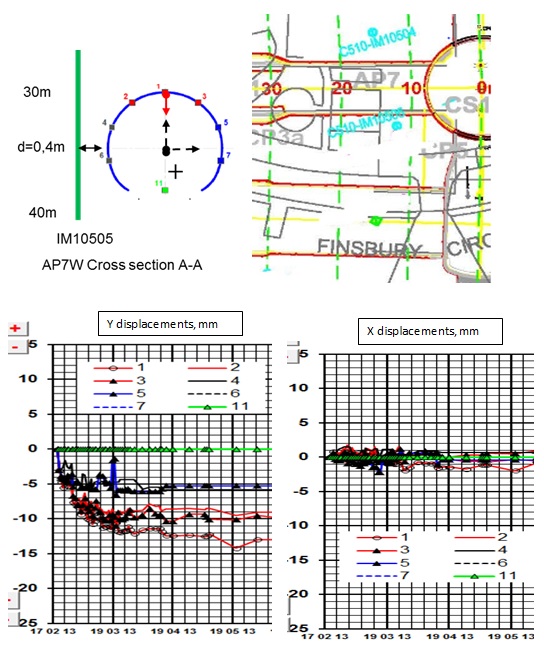
Figure 11e – Enlargement Internal Monitoring Displacement vs. Time graphs AP7W – Ch13
3.3 Results & Conclusions.
Overall the results showed that the maximum horizontal displacements occurred in the direction of the tunnel at axis level. Graphs identified that the instruments reacted when the tunnel face approach is one diameter (1D) behind, increased immediately when the tunnel is even closer the inclinometer, no significant movement could be observed immediately after the Tunnel passed the instrument and remained constant until the next event occurred.
Tunnelling influence and displacements magnitude depends on the horizontal transverse distance (d) between tunnels linings to the monitored inclinometer. It was noticed that instruments positioned at a distance greater than 4m obtained small displacements and the tunnel influence was negligible at distances greater than 4.5m. This relationship between the tunnel lining and the position of the inclinometers was more noticeable in the construction of Enlargement tunnel and results show the influence on Enlargement tunnel is higher than on Pilot Tunnel. Each instrument recorded different displacement values, inclinometers which were installed closer to the lining also show this effect of the distance “d” clear. Overall the measured displacements are small and less than the anticipated in the design, however the trend and movement direction are as predicted and consistent, inwards and towards the SLC excavation.
The Scatter on data could also be observed and was one of the problems in the analysis. Jumps and spike create that appearance of movements where there were any construction works. Error could occur and many factors could affect the accuracy of the data, for instance quality of the installation, the precision of the probe, human actions, environmental condition on facilities and monitoring frequency.
The information obtained from existing internal monitoring helped to confirm the small horizontal displacements values obtained.
It can be conclude that the Inclinometers should be installed closer the tunnel lining. It was confirmed that the closer the instrument to tunnel lining is the higher is the ground reaction. The performance of the evaluated inclinometers is fine and they response to the excavations events, the results showed that the largest horizontal displacements occurred at axis level of the tunnels and revealed that the instruments responded one tunnel diameter ahead of the approaching face with a maximum response when the excavation passed the instrument. No significant movement could be observed immediately thereafter when the tunnel lining had been constructed. Horizontal movement magnitude is smaller than estimated and movement direction is as predictions.
5. References
[1] David Chapman, Nicole Metje, Alfred Dr. Stärk (2010). Introduction to Tunnel Construction.
-
Authors


Dr Alfred Stärk Dipl Ing Dr Ing - BeMo Tunnelling
Dr Alfred Stärk is Chief Geotechnical Engineer and Engineering Manager at BBMV for Crossrail Contract 510 ‘Whitechapel and Liverpool Street Station Tunnels’ since March of 2011. He started his career at the University of Hanover, Germany, where he worked as assistant professor and consultant for 10 years. In 2002 he joined BeMo Tunnelling, Innsbruck, Austria. He now has 25 years of experience in large-scale tunnelling, mainly with sprayed concrete lining in soft ground.