IncloView
Document
type: Technical Paper
Author:
Paul Thurlow
Publication
Date: 10/11/2015
-
Read the full document
Introduction
The large amount of excavations on the Crossrail projects required the use of inclinometers to measure wall deflections during excavation. The use of spreadsheets and dongle-activated software to view data from inclinometer instrumentation has been common practice for the last 40 years.
Data would be either manually downloaded or collected automatically via GSM/GPRS data connections and then loaded into spreadsheets of ever increasing size. This data would then be processed and graphs edited to present the correct data. Over time, these spreadsheets would become so large that they would stop responding or become slow to use, this resulted in data having to be removed from the spreadsheet to improve functionality but providing an incomplete picture of the project.
By the time a project is completed there is a potential for there to be large numbers of spreadsheets with thousands of lines of data within each one, making it very hard to find a specific measurement and then relate that back to site works for that moment in time.
The recording of excavation areas and depths and their relation to the wall or pile movement is an area where detail is lacking. In fact, this is the most important part of the observational approach to monitoring. During the development of the software, it was apparent from site meetings that propping and waling positions were not always visible in reports, which is an important factor for feedback to designers in wall performance.
It has been the authors concern that these elements should all been in one place for ease of making decisions on site and providing data to designers. The experience for all the design of the software is based on real management of large excavation projects
Concept
The initial spreadsheets comprised of many tabs and annotations that were difficult to work with. The system was not secure and could be open to bad data inputs. The design of the app had to address the following;
- Fast data presentation that would work on smart phones and tablets as well as be available as a link from the GIS based software. Ability to add trigger alerts and inform users by e-mail.
- Define the soil profile, dynamic excavation and prop locations and make searchable to minute accuracy. Importation of design lines for each section of works.
- Compatible with inclinometer data from all manufactures software outputs including Manual readings, In– Place MEMs Inclinometers and Shape Accel Arrays (SAA).
- Easy to use interface and functions and minimal set up time. Ability to expand functions in the future and to work in any main monitoring software.
- Data to be exported easily to insert into design software.

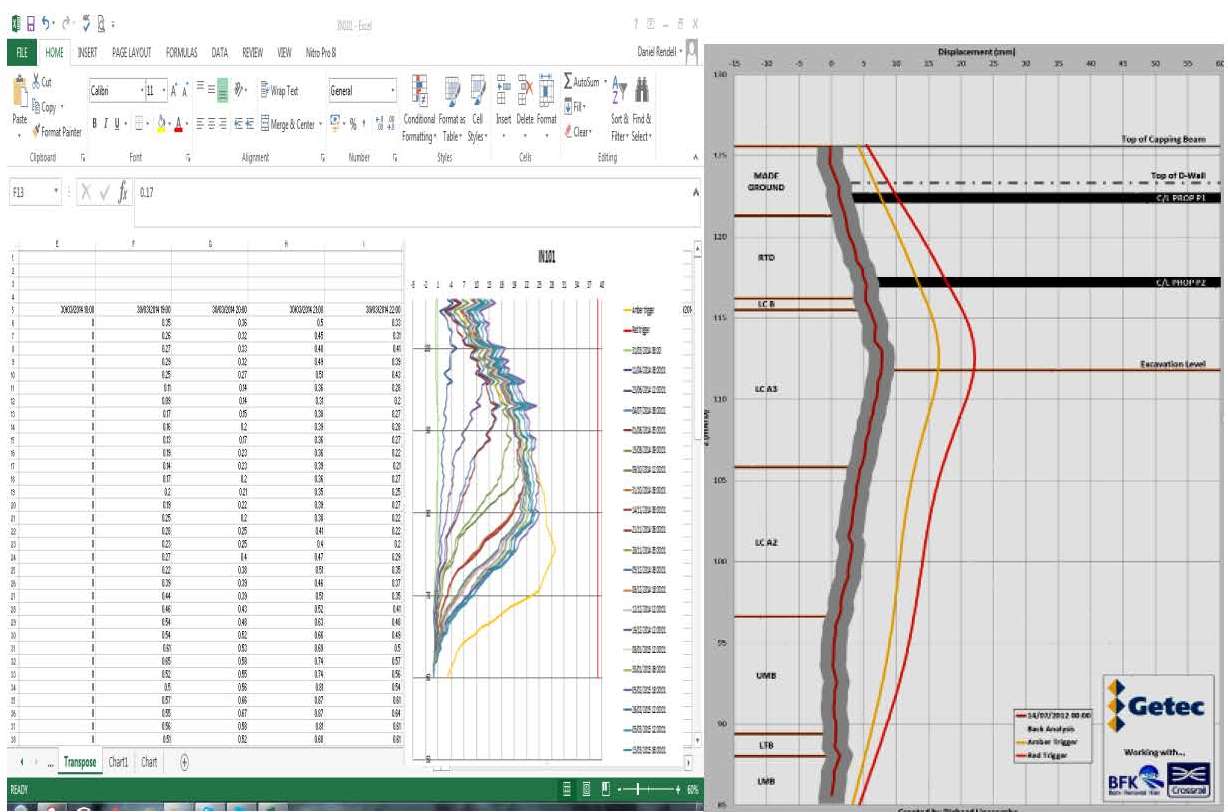
Figure 1 – Initial Development from Spreadsheet to Real Time App.
The plate on the left models a SAA inserted in a diaphragm wall panel at Tottenham Court Road
station.
IncloView Application
Advancements in technology have seen the rise of the smart phone/tablet generation. Site engineers now complete quality checks through tablets and construction progress is managed using BIM models.
The IncloView app loads data direct from a secure database that is prepared in advance of the works. The database is used by all users on site and therefore all data is current. Data can be imported in AGS4 if required, which assists in loading historical data.
Each time a new measurement is recorded it is first uploaded from the site logger units to the cloud before being downloaded and inserted into the database via a set of complex routines and queries.
Typically, a site will have an excavation plan. This allows a controlled dig to take place and will take in consideration the requirement of berms or temporary shores. It is essential that this plan is adhered to and considered during shift meetings. The IncloView app allows the user to draw and shape boxes to suit and to change the depth as excavated. This depth change is registered on the inclinometer plot and will change according to the date. It is rare that excavations are carried out at the same level on the same day, so the excavation box when drawn, will pick up the closet position within its boundaries and report these levels.
When the application is opened the plan view of the site is displayed along with all instrumentation locations shown by coloured interface icons. When an icon is selected, the sensor name is displayed and the user presented with an option of which parameter to plot. This user-friendly interface allows anyone to immediately pick up the application, and begin plotting data with very little training being required beforehand.
Upon plotting a chart, the user is presented with several visualisation options. Measurement dates can be selected either manually by the user or generated automatically by the application based on a defined time interval and the most recent measurement within the database. If the manual option is taken, the user can immediately see from the date selection window which dates have measurement information available for plotting. Any dates with no data will be indicated by red text and so the user can use this to optimise their working and investigate any gaps in data without searching through thousands of lines of data. This process saves time, and provides excellent quality control.
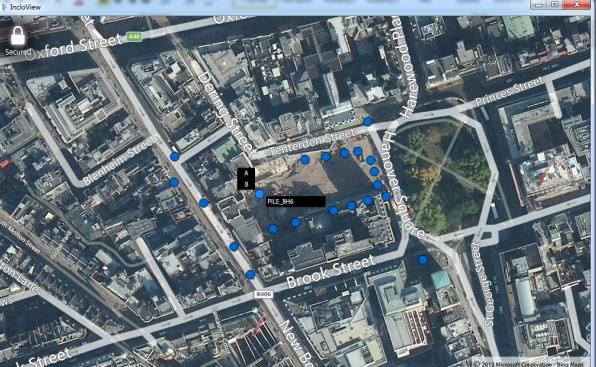
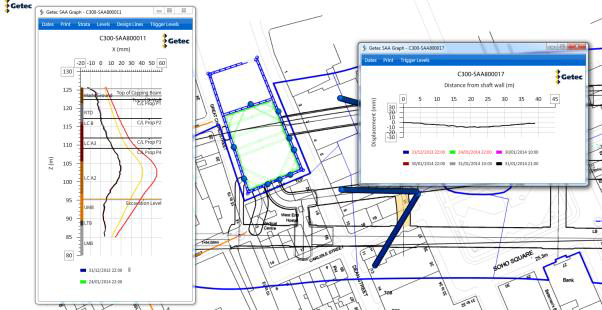
Figure 2 – IncloView Plan View
One of the most common questions asked during review meetings when data is being reviewed is “how does it relate to the trigger levels?”. The application allows for trigger levels and the design lines associated with each instrument location to be visualised alongside the data and assigned to a specific phase of the works, for example the installation of structural propping at a specific excavation level. This information is saved within the database and assigned a timestamp; this can then be accessed at anytime when carrying out post works reviews. As works progress on a project so do the conditions on site, because of this it is often required to revise the design curves assigned to specific structural elements, a diaphragm wall for example, to account for these new conditions and to ensure that the factor of safety is not compromised. By the end of a project there can be several variations of design curves, all of which need to be readily available when reviewing the historical data. When an historical date is selected within the application the database will search its records and load the correct design curves and any relevant propping or slabs that were installed at that time.
Where inclinometers are concerned, the incremental data is just as important as the cumulative data as this allows engineers to identify potential issues at specific depths within the sensor and determine if perceived movements are genuine or not. Users are able to switch between the incremental and cumulative views with the click of a button, removing the need to manually re-select data and maximising productivity.

Figure 3 – IncloView Charts with Design Curves Showing Incremental Data
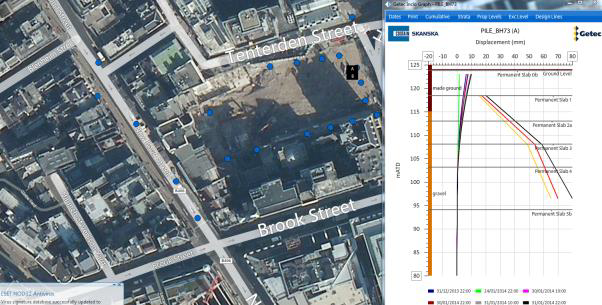
Figure 4 – IncloView Charts with Design Curves Showing Cumulative Data
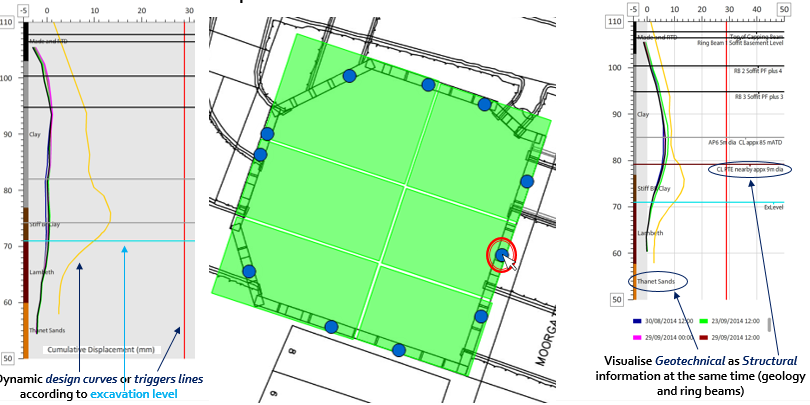
Construction information and geotechnical records that are relevant to a particular instrument location can have an impact on the observed results. For example as excavation works advance the wall can begin to deform around an installed prop level. If this data was simply viewed as a curve with no additional information this could lead to confusion if the one reviewing the data was not fully briefed on the current site progress. By displaying features such as the ground strata, prop levels and slab levels within the chart view a correlation can be quickly established between elements both within and outside of the excavation and the measurements being recorded. This is further enhanced with the ability to add the current excavation level. In a similar way to the design curves, the excavation level is not a static element and as the project advances so too does the dig level. For this reason each time a new excavation level is entered within the application it is time stamped. The result is that each time a chart is produced all the critical information is displayed at the same time in one view.
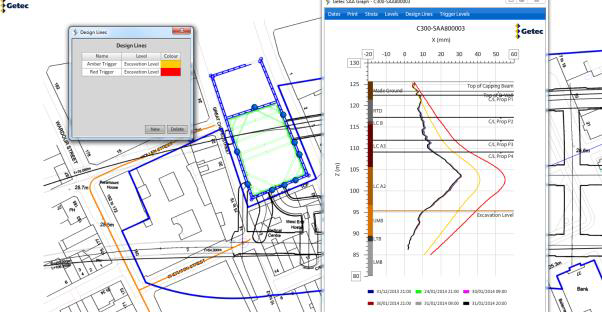
Figure 5 – IncloView Display Elements
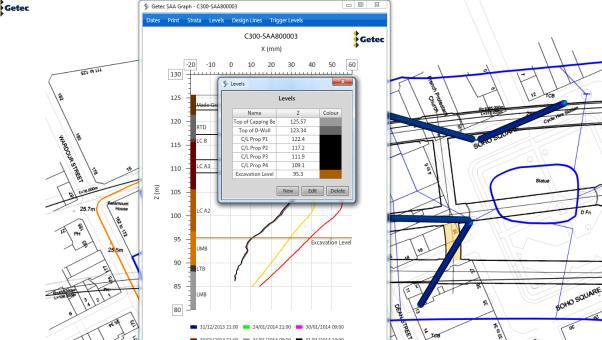
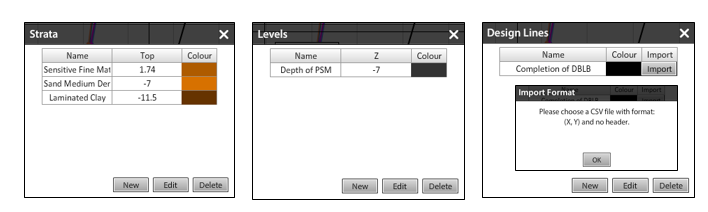
Figure 6 – Add Element Screen
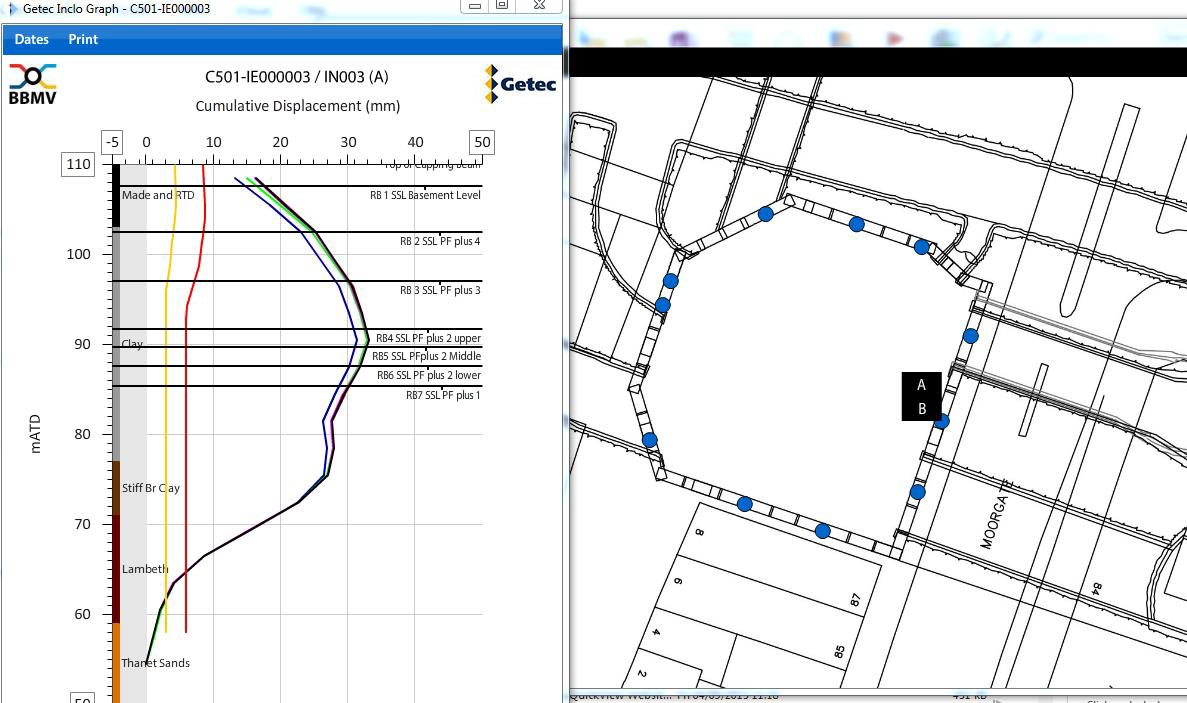
Figure 7 – Site Elements Shown Within Inclinometer Plot
Triggers and Alarms
The primary purpose of instrumentation and monitoring is to ensure the safety of others and surrounding assets. During construction works, within an excavation for example, there are often large groups working in close proximity at any one time. Evacuation procedures may take time to enforce so for this reason early warning systems are needed that will alert all concerned parties if any instrumentation begins to detect excessive deformations on site. The use of applications such as this allow for the engineers to continually review their designs and identify early indications of deformations outside of those anticipated for that phase of works, regardless of the time of day.
In the event triggers are breached the automated alarm system that is linked to the application notifies the specified mailing list and control measures can be put in place
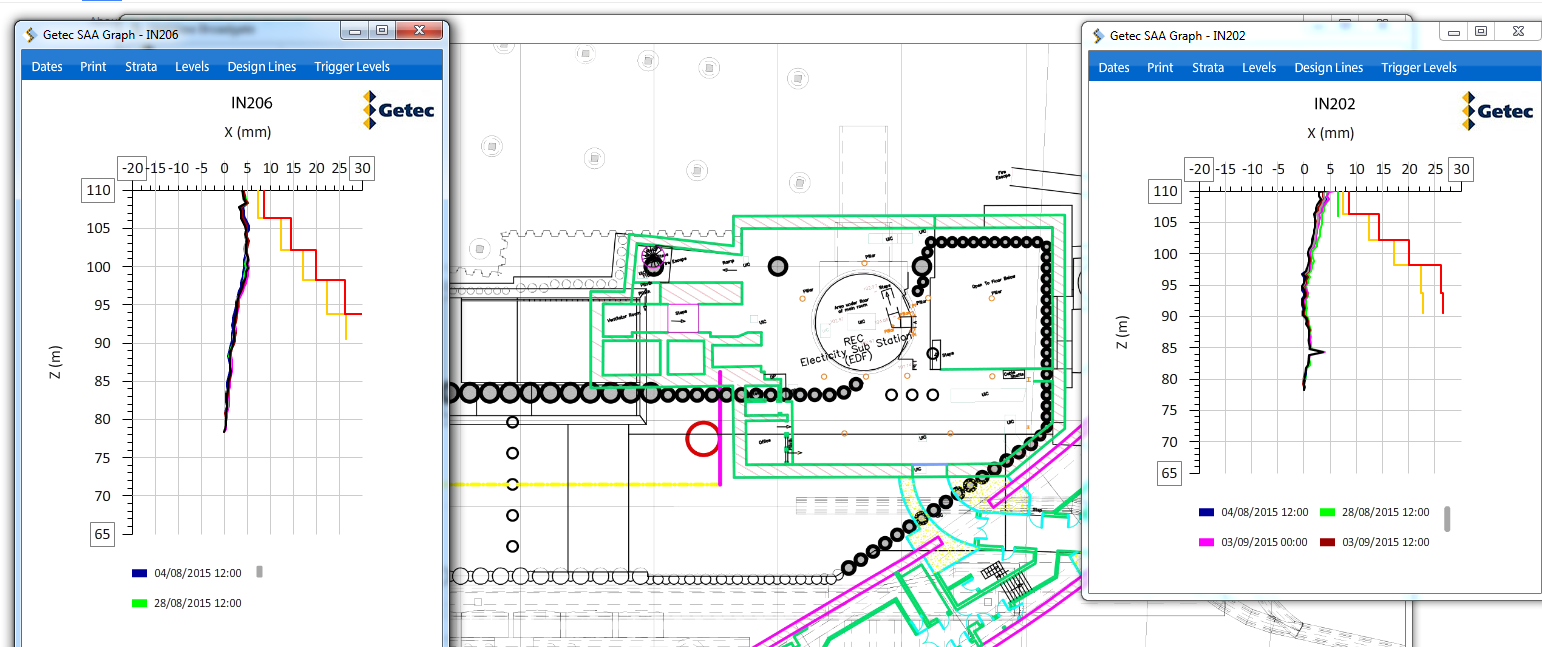
Figure 8 – Views of Inclinometers at Broadgate Station

Figure 9 – IncloView Reporting Vertical and Horizontal Data
Use on Crossrail
Four different contracts have used the application extensively on Crossrail at Tottenham Court Road where the western ticket hall’s diaphragm walls have been monitored by shape arrays for the last three years. It has also being used by engineers at Bond Street as part of their excavation works at the Eastern Ticket Hall where data from manually read inclinometers have been uploaded daily to the database and presented in the shift review groups. IncloView was used at Moorgate Shaft to review the accelerated dig works using In –Place Inclinometer and SAA data. Liverpool St station Broadgate Box uses the IncloView software to visualise inclinometer data.

Figure 10 – Example Crossrail Project Use
Conclusion
The use of applications such as this can also promote efficient working on site, when hold points are reached during different phases of work the site teams can review the data quickly, inspect work areas, and then continue with minimal delays to programme. In the past, this same data would need to be reviewed back in the site office, on a laptop with basic graphs and very little detail.
Miscommunication and a lack of understanding about instrumentation and how it relates to site conditions and elements can lead to delays during works. With the use of an application such as IncloView all monitoring data, ground strata, design curves, construction progress and structural elements are displayed in one view that updates automatically with minimal input from the user.
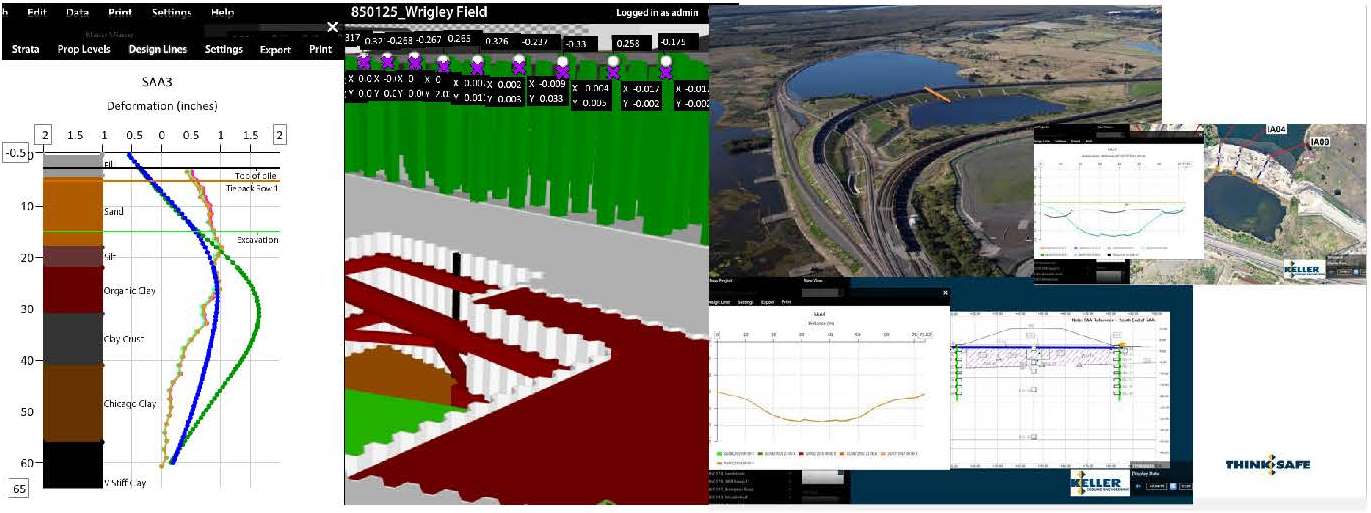
The application has been upgraded to work in a BIM environment and has been successfully used on a large rail embankment project in Australia and within a large excavation in Chicago.
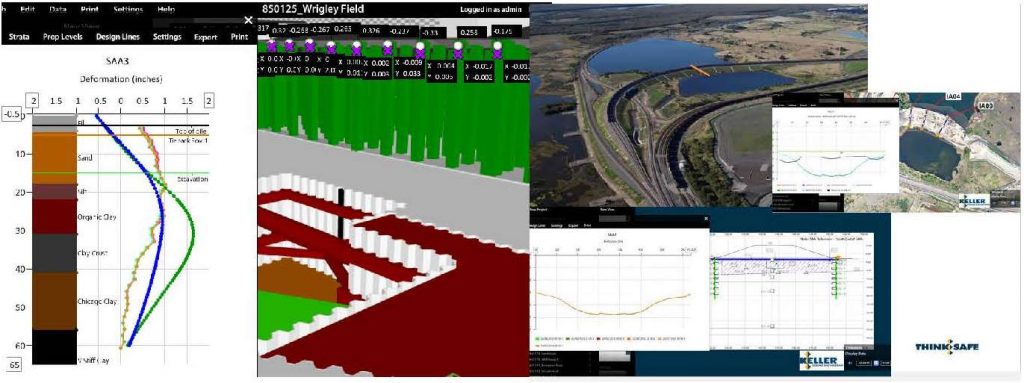
Figure 11 – BIM Integration
-
Authors

Paul Thurlow - Getec UK, Keller Getec ITMSoil JV
General Manager, Getec UK