Long-term settlement following SCL-tunnel excavation
Document
type: Technical Paper
Author:
Nigel Hill, Dr Alfred Stärk Dipl Ing Dr Ing, ICE Publishing
Publication
Date: 31/08/2016
-
Read the full document
Notation
Ch Chainage
CHS Cambridge Heath Shaft
CPD Cumulative Probability Distribution
DSS Durward Street Shaft
EBRT-W EL Eastbound Running Tunnel – West Enlargement
EBRT-W PT Eastbound Running Tunnel – West Pilot Tunnel
i, iy Trough width, offset of inflection point from the trough centre
K Trough width parameter
PTW‑W EL Platform Tunnel Westbound – West Enlargement
PTW‑W PT Platform Tunnel Westbound – West Pilot Tunnel
PTE‑W Platform Tunnel Eastbound – West tunnel
SAE Sum of Absolute Errors
S Measured settlement
Smax Maximum settlement at centre of trough
WB TBM Westbound Tunnel Boring Machine tunnel
Vs Volume loss percentageIntroduction
Whitechapel station comprises two deep excavations extending from ground level down to the platform tunnel level, one at Durward Street (DSS) and one at Cambridge Heath Road (CHS) (Figure 1). The station at depth includes two main station platform tunnels at 24 m below ground level (bgl) each about 11 m in diameter. Various connecting cross passages, escalator tunnels and emergency escape routes are constructed between the platform tunnels and connect with the deep excavations. Excavation of the Whitechapel station tunnels was completed between 2012 and 2015.
All station tunnels were excavated using the LaserShellTM method with sprayed concrete as primary and permanent support. LaserShellTM was first developed for the Heathrow Terminal 5 tunnelling works, details of which can be found in Eddie and Neumann (2003 and 2004) and Chapman et al. (2010)[14][15][16]. Excavation has been done in two stages. First: Excavation of a ~6.5 m diameter Pilot Tunnel; full face excavation with advance length of 1 m. The Pilot Tunnel was followed by the excavation of the ~11 m diameter Enlargement comprising two 1 m top heading advances and a 2 m-invert for each two meter full ring closure. The EBRT comprised construction of ~6.5m diameter Pilot Tunnel followed by enlargement to ~9.5 m diameter using the same excavation sequence.
Extensive level monitoring across the area affected by Whitechapel Station tunnels has been undertaken since November 2011, and was on-going at issue of this report. Monitoring instruments include automated prims installed high on the building facades, manually read levelling bolts along the base of the facades and manual levelling studs installed on the ground surface pavement areas near to the building. This report will only include analysis of ground movement as measured by precise laser level and bar-coded invar staff readings of road studs. The transverse settlement troughs, Section 1 at Kempton Court crossing the Westbound Platform Tunnel – West (PTW-W) at Ch. 41 m (Figure 2), and Section 2 above the Eastbound Running Tunnel – West (EBRT-W) at Ch. 165 located along the west side of Vallance Road (Figure 3) will be analysed.
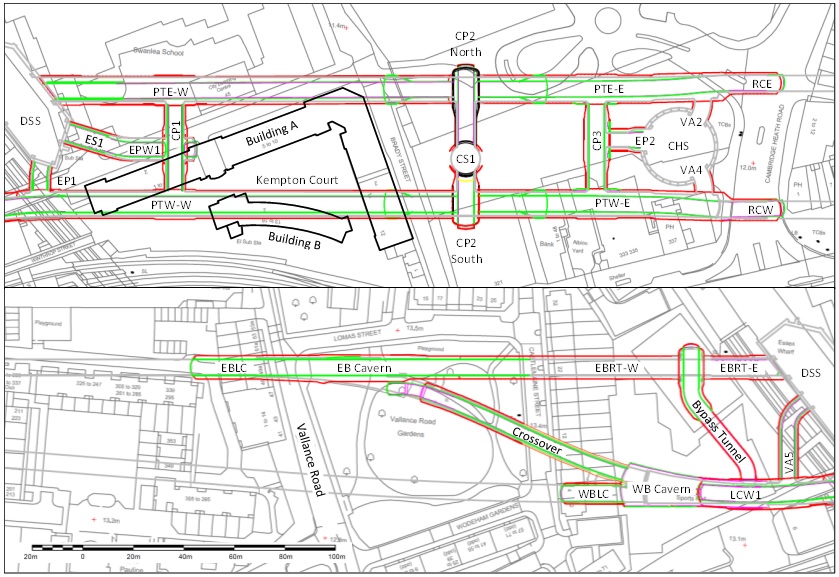
Figure 1 – Whitechapel station tunnels The Kempton court array at Section 1 (Figure 2) comprises of 13 levelling studs that cross PTW-W at Chainage 41. This array is located at the base of the West facing façade of Building B at the eastern end of the courtyard. The array is rotated 20° counter clockwise relative to the transverse direction from the tunnel axis.
The Vallance Road array (Section 2) comprises a 110 m long array of 35 road studs that are offset up to 73 m to the south and 37 m to the north of the tunnel axis, Figure 3. This array is influenced by two tunnels, the EBRT‑West tunnel and the Westbound Tunnel Boring Machine tunnel (WB TBM) to the south at a distance of about 45m from tunnel axis to tunnel axis. The axis level of both tunnels is excavated at approximately 30 m bgl. The road stud array crosses the EBRT‑West at chainage 165 and is rotated 20° counter clockwise relative to the transverse direction from the axis of both tunnels.
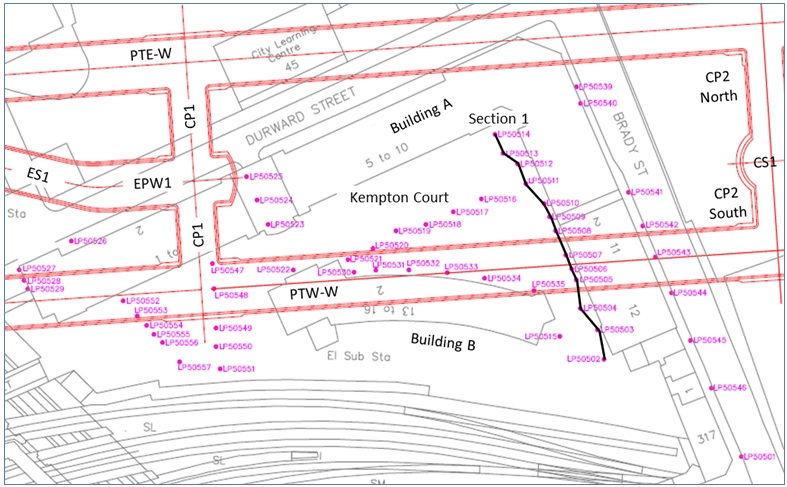
Figure 2 – Kempton Court Roadstuds above the Westbound Platform Tunnel (Section 1). 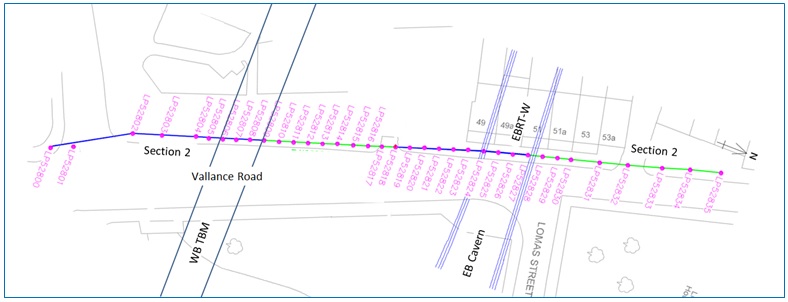
Figure 3 – Vallance Road Roadstuds above the EBRT-W and WB TBM tunnels (Section 2). The Settlement Trough and Long-term settlement
For this report the settlements directly attributed to tunnel excavation are differentiated from the long term settlements that occur after excavation. Analysis of the long term settlement trough requires a standardised method to identify the point of transition between short term and long term settlement following excavation. Kempton Court and Vallance road have been extensively analysed by Hill & Stärk[5]. It was found that the zone of influence and trough length of each excavated heading in the longitudinal direction was nearly identical to the transverse settlement trough width i. Trough width, i is the transverse distance from the centre of maximum settlement (Smax) to the point of inflection. The longitudinal settlement profile can be approximated by a cumulative probability distribution (CPD) defined by these two parameters, the trough length i and Smax. For this paper the transition from tunnel induced settlement to long term settlement in the longitudinal direction is defined as the distance +3i, i.e. the location of maximum direct settlement influence, Smax, from the point of inflection. Generally the point of inflection of the CPD is located at 0.5*Smax and occurs above the tunnel face for open face tunnelling[12]. At Kempton Court and Vallance Road the point of inflection for the enlargement excavation at 0.5*Smax is not reached until an additional 5m has been excavated. The entire longitudinal settlement profile is in fact translated 5 m in the direction of excavation. Based on the trough width and 5 m translation of the longitudinal settlement profile, the transition from tunnel induced settlement to long-term settlement at Kempton Court occurs at 37 m and at Vallance road this occurs at 40 m. Once excavation passes this point all subsequent settlement is considered due long term settlement processes. Settlements directly related to the tunnel face passing beneath any location are referred to as short term settlement (Figure 4).
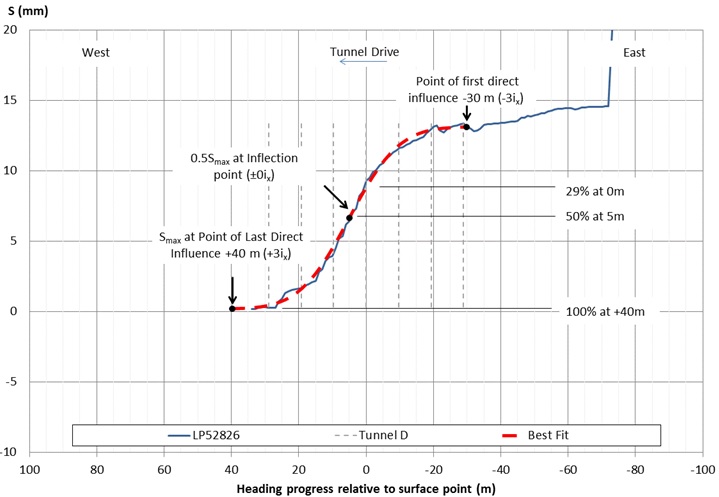
Figure 4 – Example of CPD best fit of longitudinal settlement above the axis of EBRT W, baselined to the last direct settlement influence from the enlargement excavation. Monitoring Accuracy and Uncertainty
The industry best practice method of monitoring surface settlements used by C510 is precise bar-coded invar staff laser levelling. The repeatability of this laser levelling method on the C510 contract is approximately ±0.5 mm or better. Regular monitoring of a high enough frequency allows for identification of unstable points that can be removed from the database or offset.
Long term settlement analysis requires long time periods of monitoring and monitoring uncertainty can have a major impact on the analysis. Uncertainty can come from a wide variety sources: Stability of control benchmarks; short term and long term settlements related to nearby excavations; depressurisation of water bearing strata; pre-existing and on-going ground movements that may affect the local or wider area; subsidence of poorly consolidated near surface sediments or man-made ground; nearby grouting activities; and seasonal shrink and swell of the surface soils related to annual rainfall patterns. Due to the long time period considered for this analysis, these sources of uncertainty can significantly affect calculated rates of settlement and trend predictions. Monitoring frequency and the period of time monitored can also impact on reliability of long term settlement analysis. More frequent readings over longer periods will provide more accurate analysis and more reliable predictions.
Seasonal and long term ground movements unrelated to excavation.
At Whitechapel there is an observed annual cyclic heave and subsidence in most data that may be attributed to swelling and shrinkage of the near-surface soils. Shrink-Swell of clay-rich soils is the change in volume due to loss of moisture during the drier spring to summer months (shrinkage or subsidence) and reabsorption of moisture during the more wet autumn to winter months (swelling or heave). In addition to annual cyclic variation there are also observed long term settlements and heave that is unrelated to tunnelling. These ground movements can affect the monitoring data in two ways. Firstly, any movement on the benchmarks will result in a false and opposite sense of movement on the measured points. Settlement or heave of a benchmark will respectively result in an apparent heave or settlement in the measured data.
Secondly, seasonal variation and long term ground movements if present are also expected to affect individual measured points directly. Seasonal variation on individual measured points themselves is more problematic as seasonal shrink and swell of the surface soils will likely vary locally across the site. Long term settlements unrelated to tunnelling on the other hand are more likely to be related to geological/hydrogeological processes at depth and likely to affect all points in a similar way. Such ground movements can be identified by taking readings before tunnelling and outside the tunnel zone of influence during and after excavation.
At Whitechapel, manual levelling was primarily controlled by three benchmarks CRBM1013 (nail), TBMW1, and CRBM1014 Figure 5. These benchmarks were periodically checked against benchmarks CRBM1012 and CRBM1016 located outside the Whitechapel area of surveying. CRBM1016 is not included in Figure 5 as it is located much further to the east towards Stepney Green. Stability analysis of the benchmarks showed CRBM1013 (nail) was stable relative to CRBM1012 and CRBM1016, which is consistent with its location on the structure bridging over the London Underground Hammersmith and City Line. If CRBM1013 (nail) is considered stable, then the relative movement of TBMW1 and CRBM1014 can be used to identify seasonal and long term ground movement affecting these bencharks. Benchmark TBMW1 is the primary benchmark used for levelling across the area that includes Kempton Court, Durward Street and Brady Street. CRBM1014 is not used in analysis or discussed further for this paper. Benchmark CRBM1013 (nail) is the primary benchmark used for level control in areas west of DSS and the Vallance Road Gardens Area.
The movement of Benchmark TBMW1 from 2012 to the end of 2014 shown in Figure 6 shows a long term heave. The installation of this benchmark on a low masonry fence in close proximity to a large tree may indicate this heave could be related to tree root growth beneath the benchmark. In addition, there is an annual cyclic heave and subsidence that is interpreted to represent swelling and shrinkage of the near-surface soils. During surveying some correction was applied to benchmark TBMW1, but it was not possible to correct for the constant seasonal variation. At the start of 2015 TBMW1 was replaced by TBMW1A resulting in a -3.5mm correction to the benchmark level relative to CRBM1013 (nail). The new benchmark also shows some seasonal variation, but appears to be more stable in the long term. A three reading moving average of the movement of TBMW1 (Figure 6) was used to correct the measured data for seasonal variation, long term heave and replacement of the benchmark. An example of survey data at Kempton Court Section 1 before data correction (Figure 7) demonstrates how much error can build up over time due to movements unrelated to excavation. Correction of the data ensures the long term settlement analysis provides reliable results. The corrected levels for road stud LP50507 are used later in the report to analyse the long term settlement at Kempton Court.
Analysis of long term settlements must also ensure influence from other nearby excavations is not included in the analysis. The settlement data must be carefully chosen to ensure the point of interest is not influenced by nearby excavations or should be baselined to the most recent excavation to directly influence the point of interest.
After correction for seasonal variation on benchmark TBMW1 and TBMW1A, it would appear seasonal variation of the near surface soils at Kempton Court has had a minimal effect on the individual road studs analysed. Seasonal variation due to shrink and swell of surface soils along the monitored section is therefore considered minor and is not corrected for.
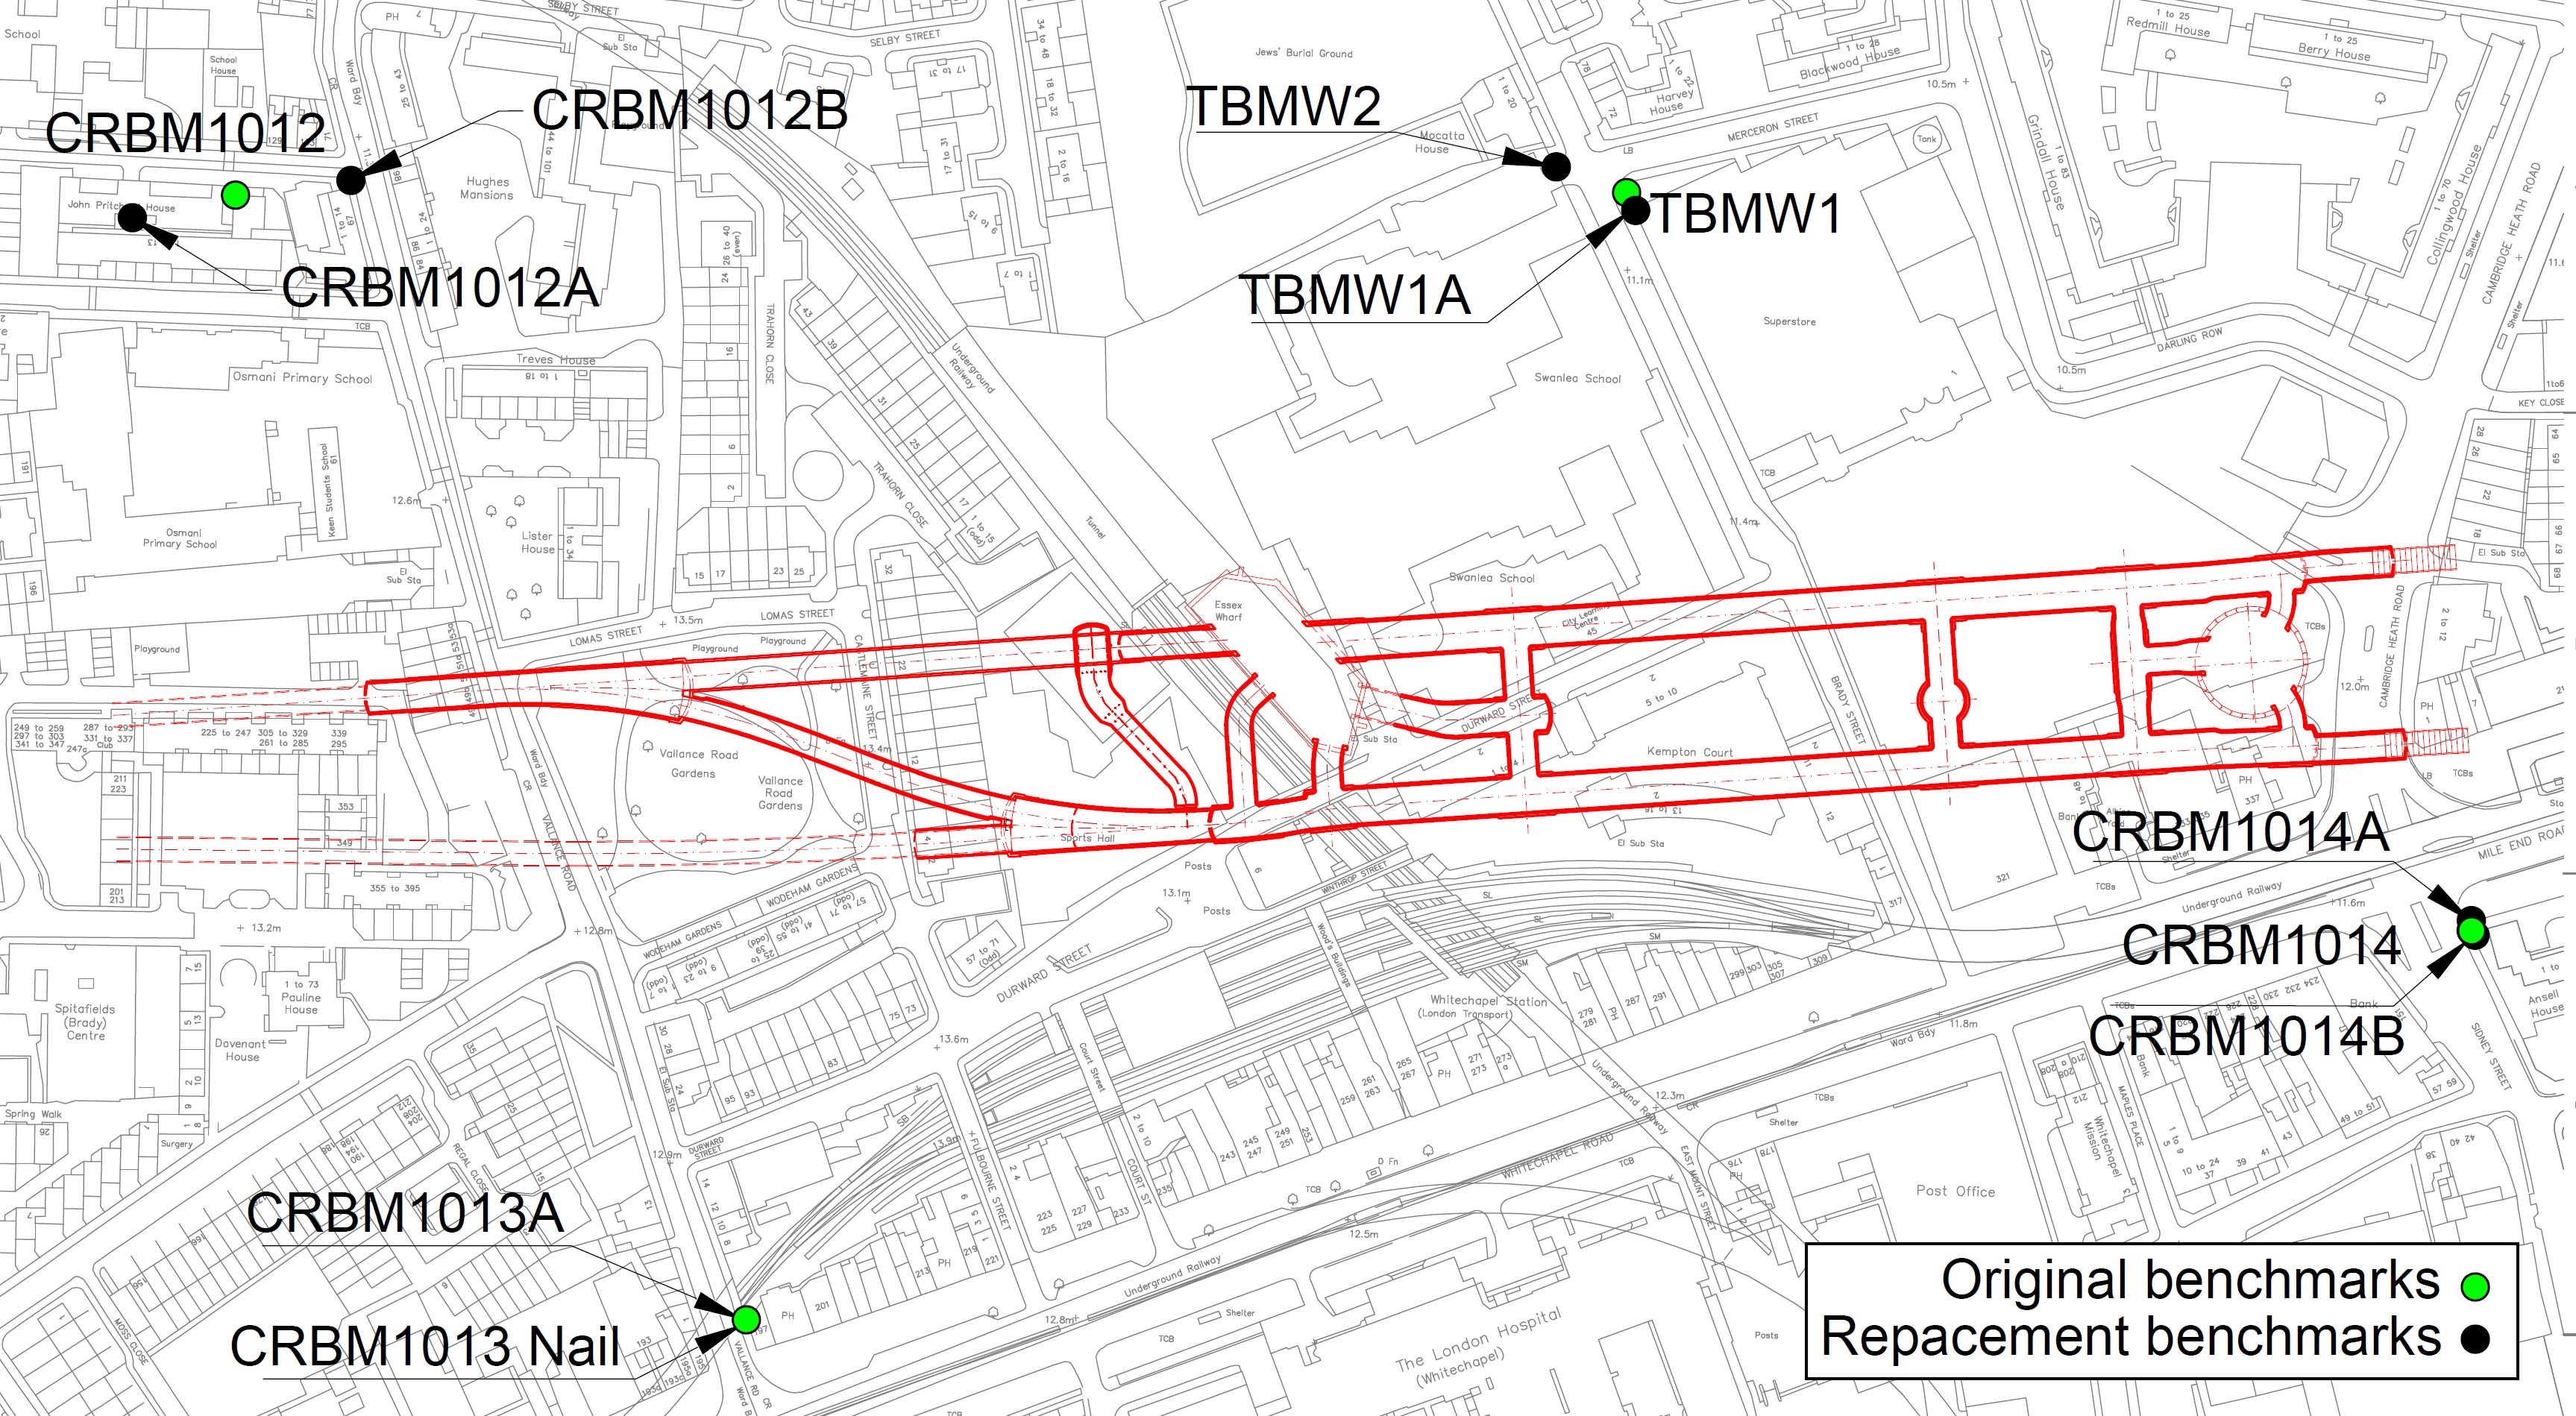
Figure 5 – Whitechapel benchmark locations. 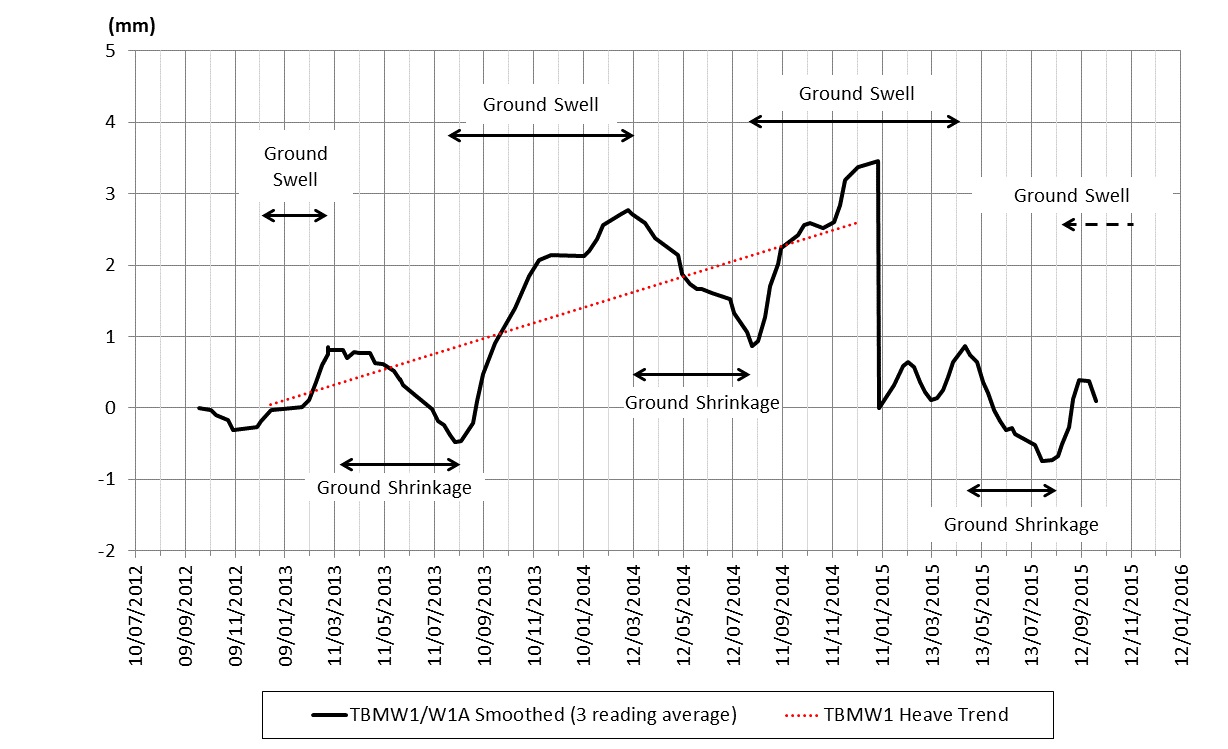
Figure 6 – Movement of benchmark TBMW1 relative to CRBM1013 (nail). 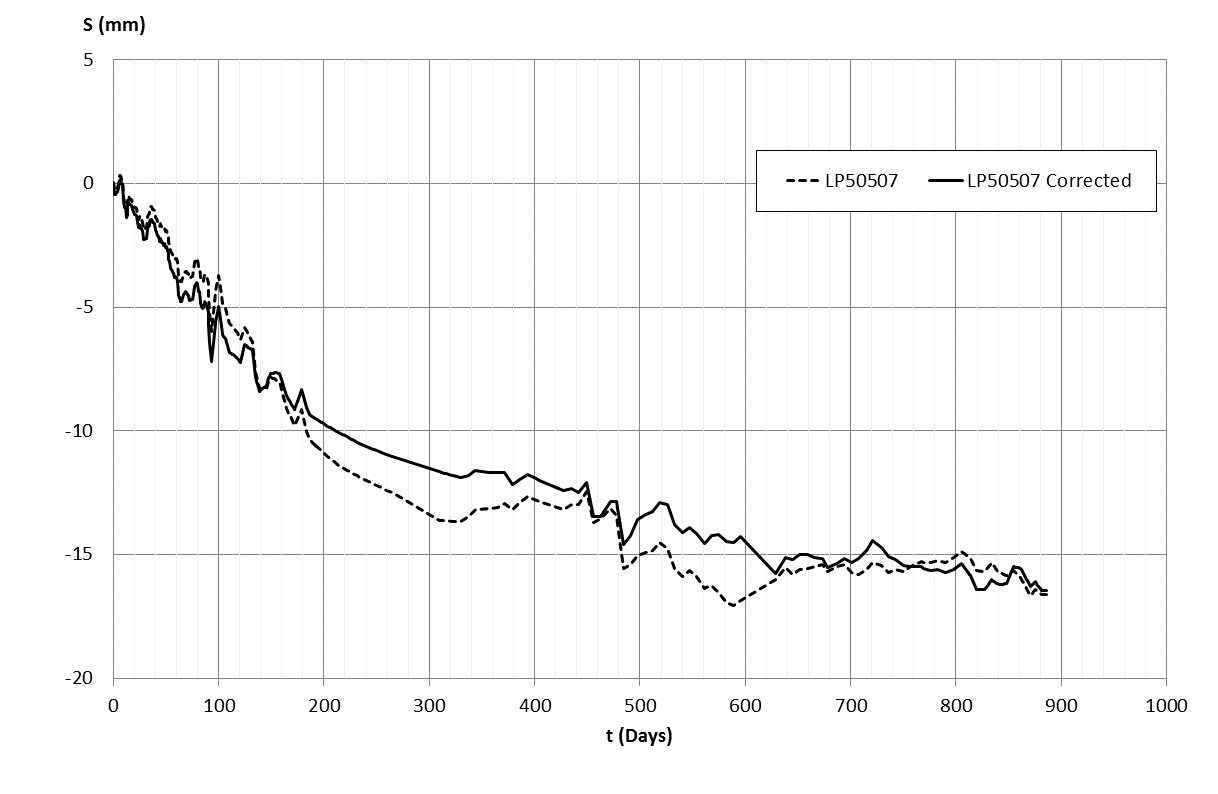
Figure 7 – Uncorrected and corrected levels for LP50507 at Kempton Court Section 1. Data is baselined to the last tunnelling influence from PTW-W. Kempton Court
The platform tunnel PTW-W at Whitechapel Station was the first fully excavated section of enlargement to be completed for the Crossrail C510 contract. Readings at Kempton Court provide the longest uninterrupted record of long term settlement at Section 1 that has been monitored continuously for a 29 month period. The corrected settlement history of road stud LB10507 located directly above the axis of PTW-W will be used for analysis, baselined to the last influence of tunnelling.
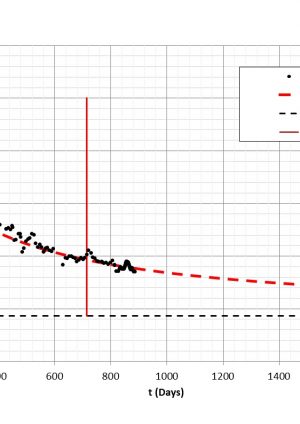
Hyperbolic long term consolidation settlement analysis is the chosen method to analyse the long term settlement for this report. This method can be directly related to the initial rate of long term settlement and provides an estimate or prediction of the ultimate settlement[8]. A non-linear curve fitting method using minimum sum of absolute errors (SAE) is used to determine the best fit hyperbolic settlement curve. The hyperbolic best fit Figure 8provided a very good fit for the entire 900 day period of observation with a 20.7 mm ultimate predicted settlement. Analysis of rates of settlement of the hyperbolic settlement best fit show it has taken more than 2 years for the settlement rate to decay from an initial ~31 mm/yr to below 2 mm/yearFigure 9.
The exceptional two and a half years of detailed monitoring of Section 1 is probably unprecedented for monitoring of long term settlement after completion of a tunnel. This provides an opportunity to test the effect varying the duration of monitoring has on the prediction of long term settlement. Best fit analysis restricted to the first six months and the first 12 months of data is compared to the full dataset. Results indicate for shorter periods of monitoring the best fit analysis tends follow a more straight curve resulting in overestimation of the ultimate settlement (Figure 10), a reduced initial rate of settlement and overestimates the time taken for settlement rates to decrease below 2 mm/yr (Figure 11).
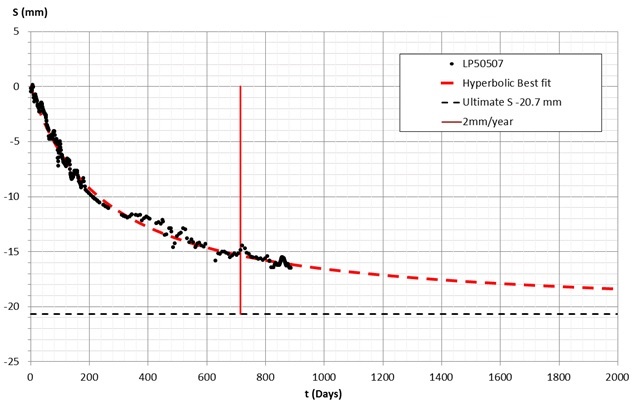
Figure 8 – Long-term settlement hyperbolic best fit above PTW-W at Kempton Court 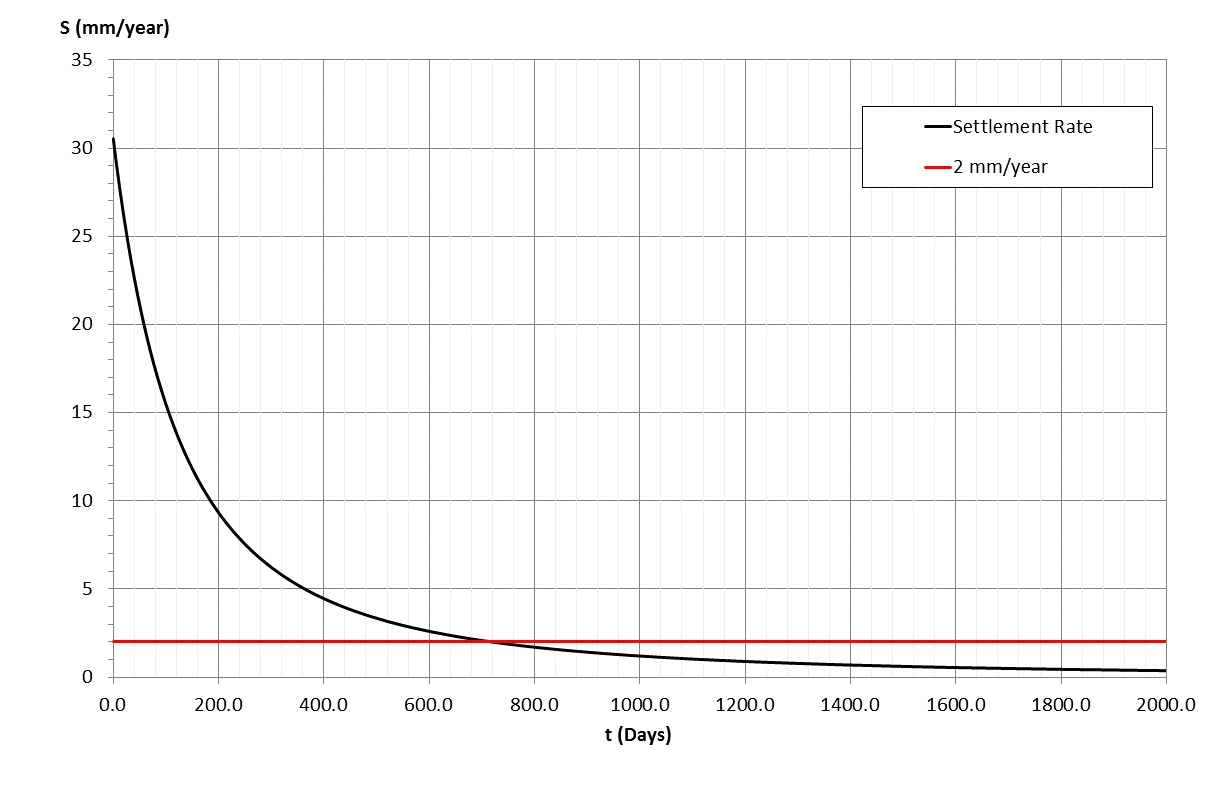
Figure 9 – Rate of long-term settlement above PTW-W at Kempton Court 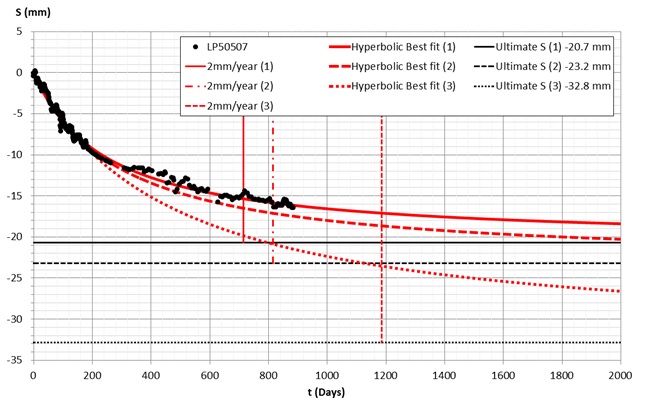
Figure 10 – Predicted long term settlement based on different periods of monitoring at Kempton Court: 29 months (1); 12 months (2); 6 months (3). 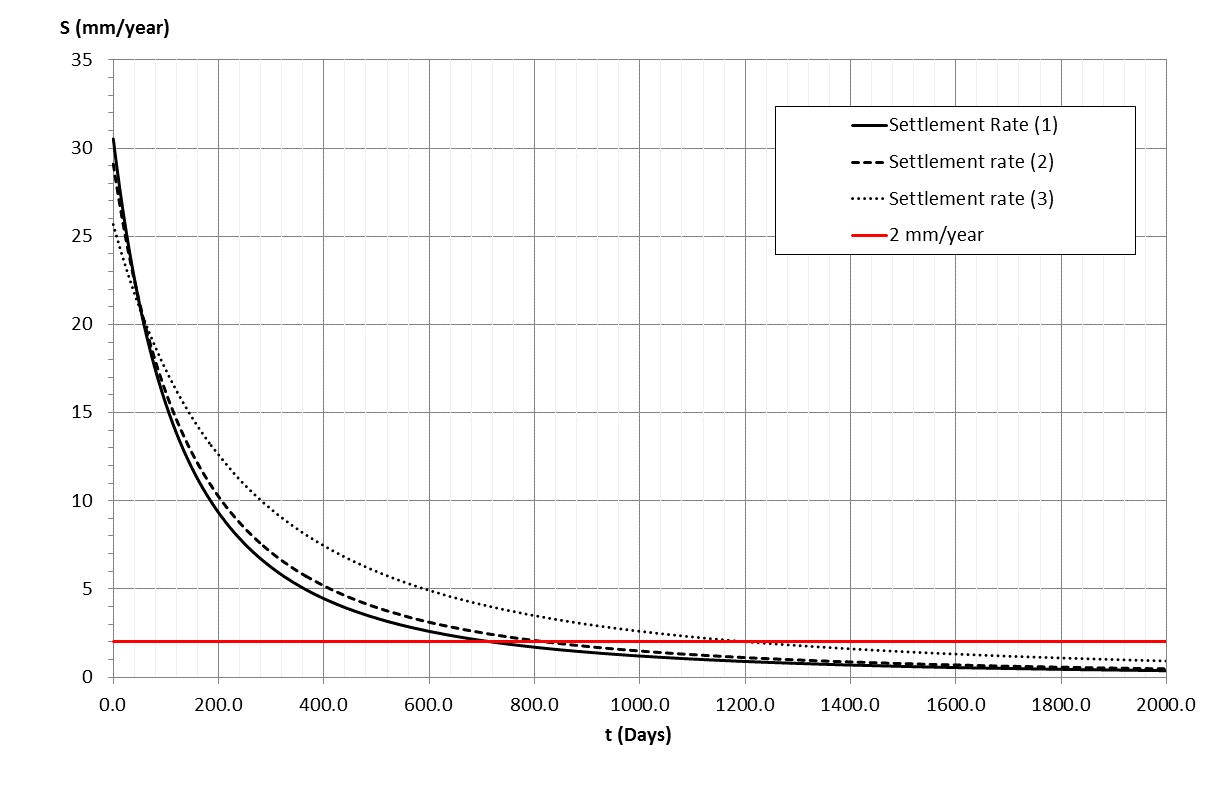
Figure 11 – Predicted change in rate of long term settlement based on different periods of monitoring at Kempton Court: 29 months (1); 12 months (2); 6 months (3). Vallance Road
The Vallance Road Gardens area has been monitored continuously for the last four years since November 2011. Before tunnel excavation at this location, the area has undergone a continuous long term settlement of up to ~4 mm per year[6], and pre-tunnelling settlement of up to 12mm since start of monitoring. This settlement is unrelated to tunnelling and is likely the result of natural on-going ground consolidation processes. Only 2 mm of settlement is attributed to pre-tunnelling well drilling and depressurisation works[6]. The south end of the Vallance road array is considered to lie outside the zone of influence for both short term and long term settlement induced by EBRT-W pilot and enlargement tunnel excavations. Long term settlement observed on road-studs LP52800 and LP52801 during the 9 months between excavation of EBRT-W pilot and the WB TBM excavations (Figure 12) is about -1.7 mm/yr. The entire settlement trough is assumed to have a uniform 1.7 mm settlement component (Dz). This assumption is based on the observed on-going natural ground movement[6] across the whole array before tunnelling and the on-going long term settlement of southern part of the array since start of excavation. The 1.7 mm/yr long term settlement is also assumed to continue after TBM excavation. However, this assumption cannot be verified as all measured points are considered to be within the long-term zone of influence of both tunnels. Sixteen months, or 450 days of readings since completion of EBRT-W enlargement has had the background long term settlement, deemed unrelated to tunnelling, removed from the data (Figure 13). The best fit hyperbolic curve is in good agreement with the corrected settlement and predicts an ultimate settlement of 12.7 mm (Figure 14). The rates of settlement start at ~35 mm/yr and take about ~420 days to decay to about 2 mm/yr.
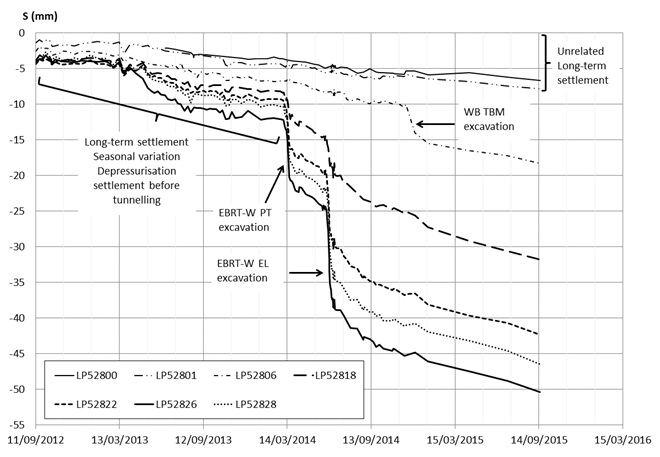
Figure 12 – Settlement at Vallance Road, including background long term settlement unrelated to tunnelling. 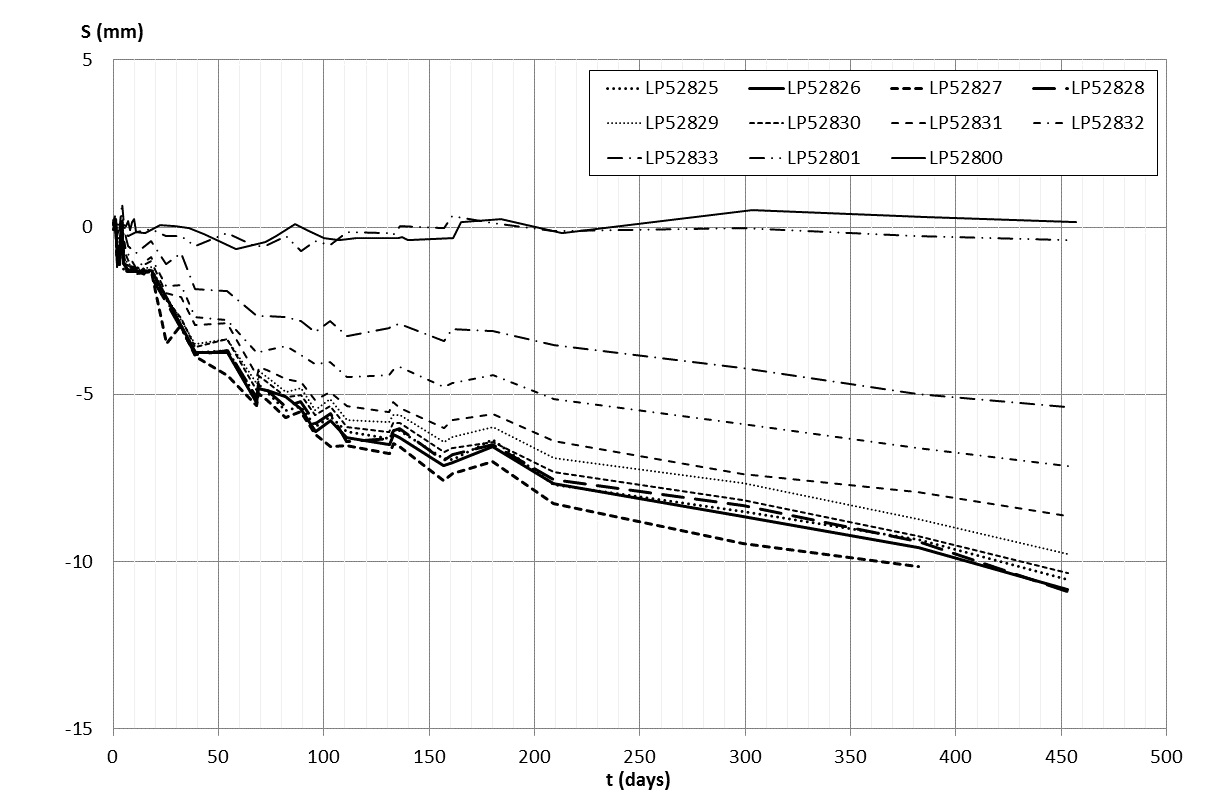
Figure 13 – Settlement at Vallance Road since completion of EBRT-W, corrected for background long term settlement unrelated to tunnelling. 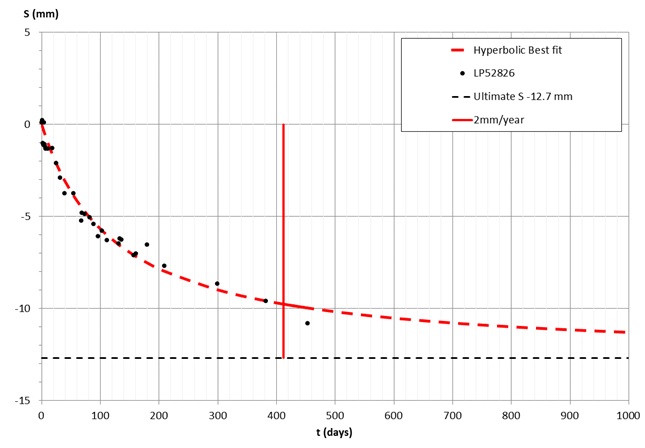
Figure 14 – Long-term settlement hyperbolic best fit above EBRT-W at Vallance Road. 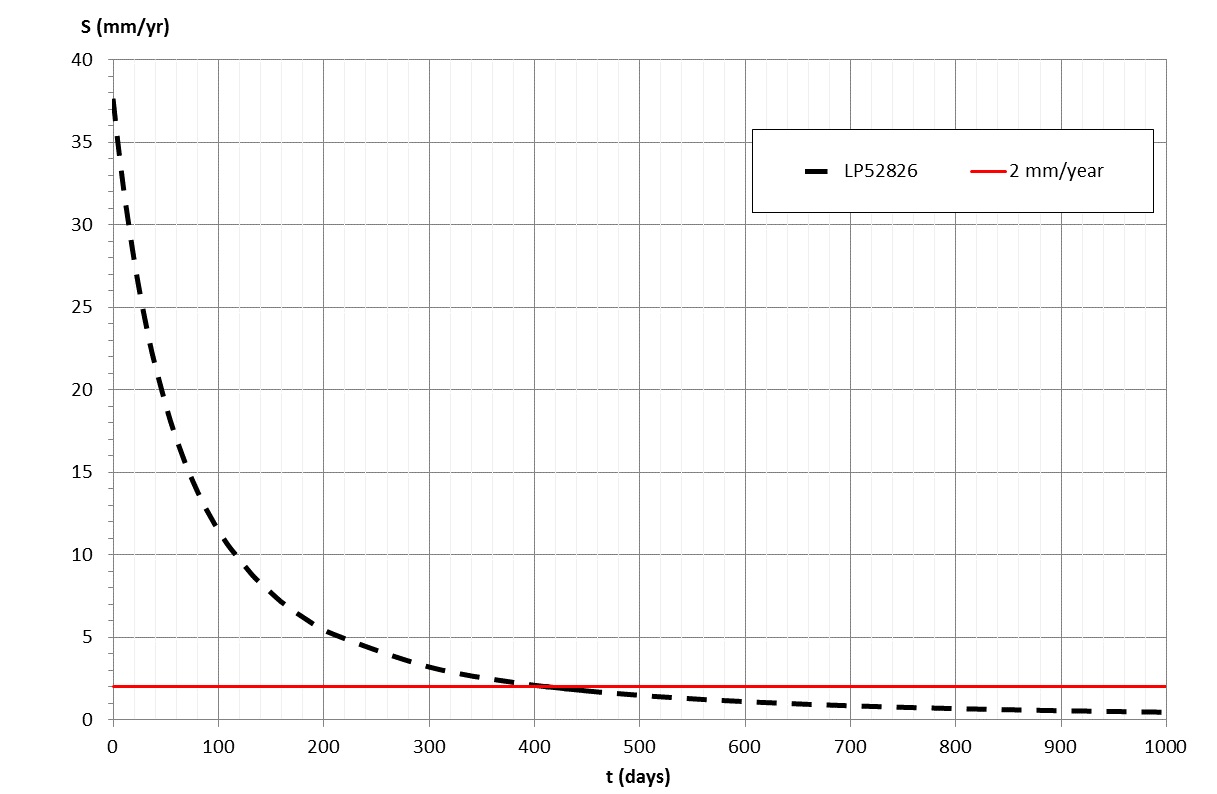
Figure 15 – Rate of long-term settlement above EBRT-W at Vallance Road. Long-term Settlement Effect on Volume Loss, Slopes and Deflections.
Hill & Stärk’s earlier Crossrail technical paper[5] was only able to discuss the effect of long-term settlement up to 3 months after completion of the EBRT-W tunnel. Twelve months of additional data is available for this paper to test earlier observations made at Whitechapel station[5]. The total settlement due to tunnelling and long‑term settlement at Section 2 above the EBRT-W and WB TBM tunnels is presented in Figure 16 with comparison to the predicted settlement troughs for the pilot tunnel and full excavation assuming volume loss of 1.5 %. This figure is modified from Hill & Stärk[5] to include the last 12 months of settlement and corrected for long term settlement considered unrelated to tunnelling.
Settlement from the WB TBM excavation occurred about six months after completion of EBRT-W between manual readings taken on 24/11/2014 and 17/12/2014. Based on these two readings, the maximum direct settlement from the TBM excavation is ~-4 mm above the TBM axis. The short term settlement zone of influence from the TBM is observed to extend ~25 m from the TBM axis. After the TBM excavation at Vallance Road, the road studs south of the EBRT-W tunnel axis are considered to be influenced by the TBM tunnel and no longer included in the EBRT-W long-term settlement analysis. The contribution of the TBM excavation to volume loss and long term settlement is not discussed further in this paper.
Using a multiple Gaussian best fit approach to volume loss analysis as proposed by Hill & Stärk[5] for each stage of excavation and period of long term settlement (Table 1), the following observations have been made. The settlements directly induced by excavation of the EBRT-W pilot and enlargement tunnels analysed as separate stages of excavation and combined are about 30 % lower than the 1.5 % contractual limit for volume loss. However the long term settlement due to consolidation of the London Clay has resulted in significant increase in the total volume loss.![Figure 16 - Actual settlements induced by EBRT-W compared to predicted settlements. Updated from Hill & Stärk[5] and corrected for long term settlement unrelated to tunnelling.](https://learninglegacy.crossrail.co.uk/wp-content/uploads/2016/11/7E-022-Figure-16.jpg)
Figure 16 – Actual settlements induced by EBRT-W compared to predicted settlements. Updated from Hill & Stärk[5] and corrected for long term settlement unrelated to tunnelling. Between the pilot and enlargement excavations of EBRT-W, three months of long term settlement is observed. Analysis of this long term settlement identified the long term settlement comprised a normal Gaussian distribution of settlement with a trough width of ~33 m or K‑value of 1.1. This is revised from the trough width given by Hill & Stärk[5]. The trough width of the long‑term settlement trough is double that of the short term trough for the pilot tunnel with a trough width of 15.8 m or K‑value of 0.53.
The trough width, iy, for the transverse long term settlement trough after completion of the enlargement is about ~22m. This trough width is again approximately double that of the 13 m trough width of the short term settlement trough of the enlargement heading. Comparison of the extent of the long term settlements in relation to the extent of the short term settlements for EBRT-W indicates there is a ~2:1 proportional relationship between the extent of long term settlement and the short term settlement influence. Since completion of tunnel excavation, the long‑term settlement trough width has remained constant for the duration of monitoring (17, Table 1).
The total measured cumulative volume loss at 16 months after completion of the EBRT-W tunnel is about ~2.2%. Assuming the long‑term settlement continues without expansion, the ultimate total volume loss is predicted to approach ~2.3% (Table 1, Figure 18).
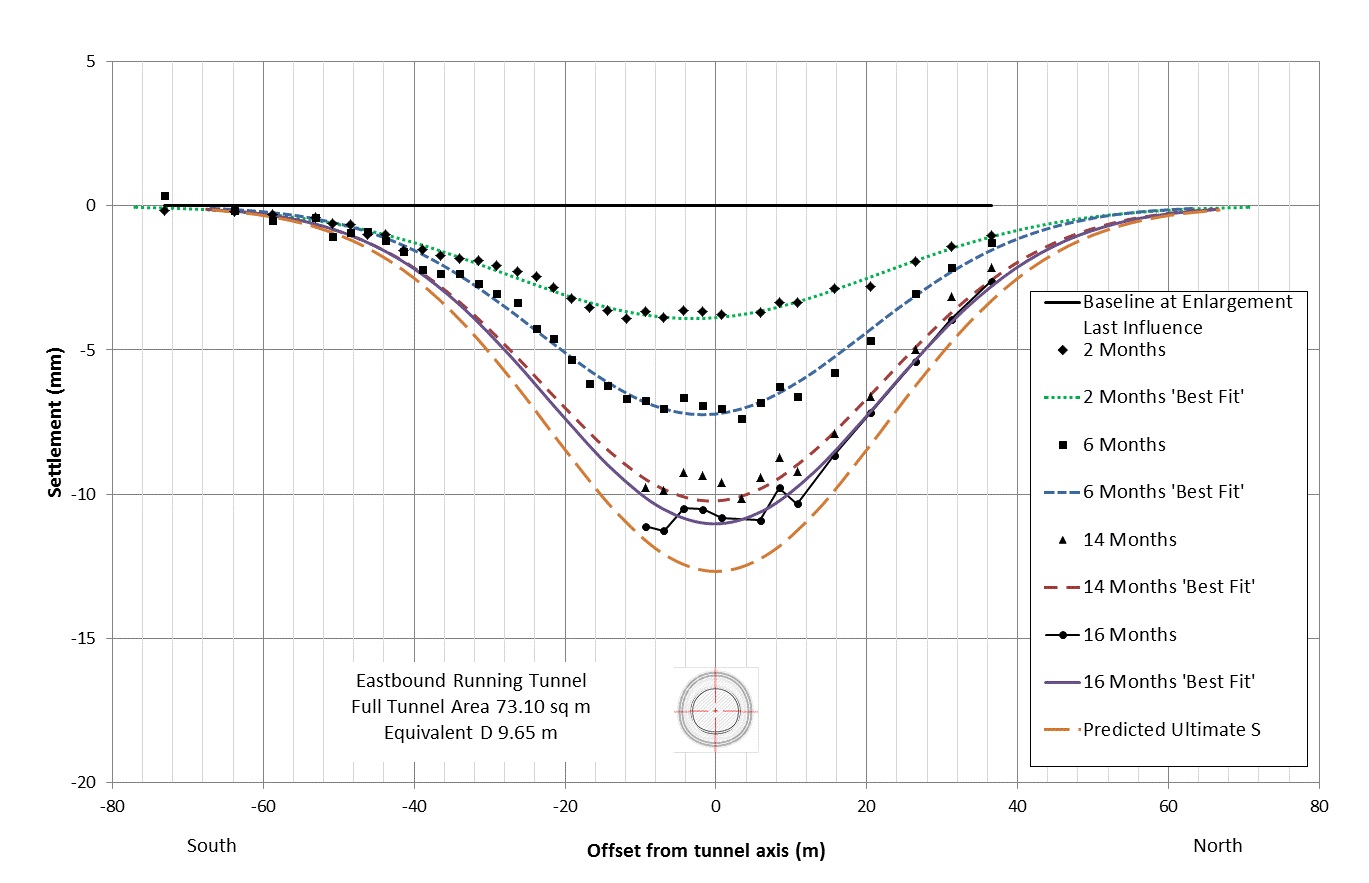
Figure 17 – Development of the long-term settlement trough without expansion since the last influence of EBRT-W enlargement. 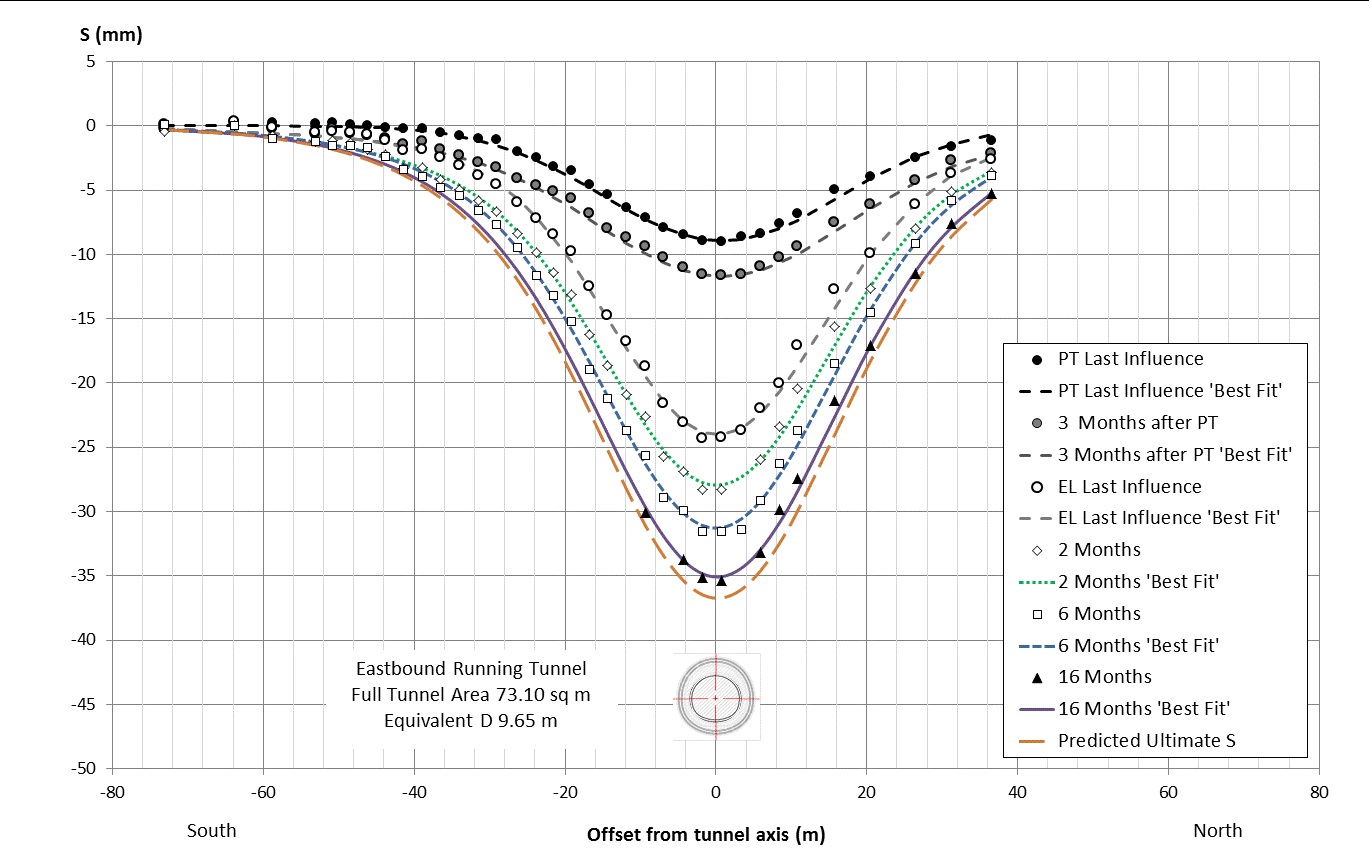
Figure 18 – Total Cumulative settlement trough and Gaussian best fit curves for each stage of excavation and period of long term settlement above EBRT-W 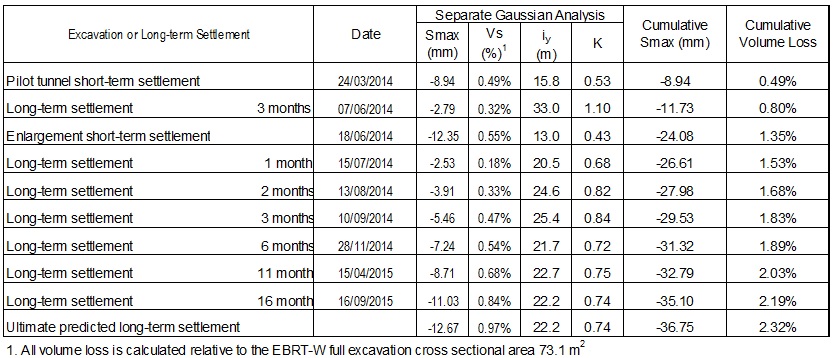
Table 1 – Cumulative summary of the measured transverse settlement trough for each stage of excavation and period of long term settlement above EBRT-W. The magnitude of the long-term increase in slopes due to long term settlement is shown to be of the same magnitude as the slopes directly related to excavation of the pilot tunnel, but less than for the enlargement (Figure 19). The long term settlement analysis of the transverse trough is able to explain and account for the development of slopes that have occurred far beyond the short-term settlement trough (Figure 20). These cumulative slopes show there is significant increase in slopes across the whole of the short term settlement trough that extend nearly twice the distance from the axis in comparison to the short term trough. The long term settlement has resulted in the maximum measured slopes to reach the maximum expected predicted slopes.
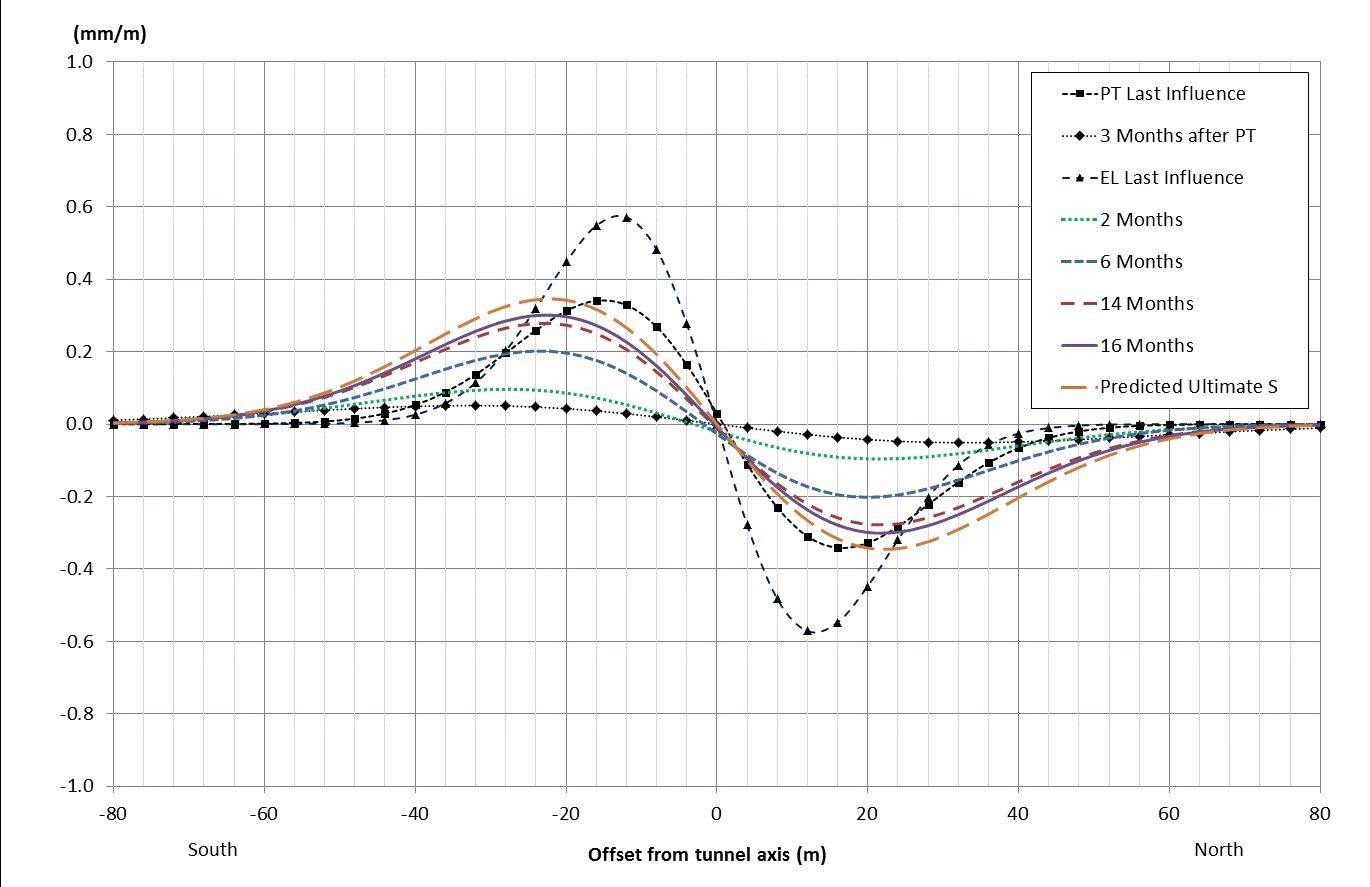
Figure 19 – Development of the transverse settlement trough slopes for each stage of excavation and period of long term settlement above EBRT-W. 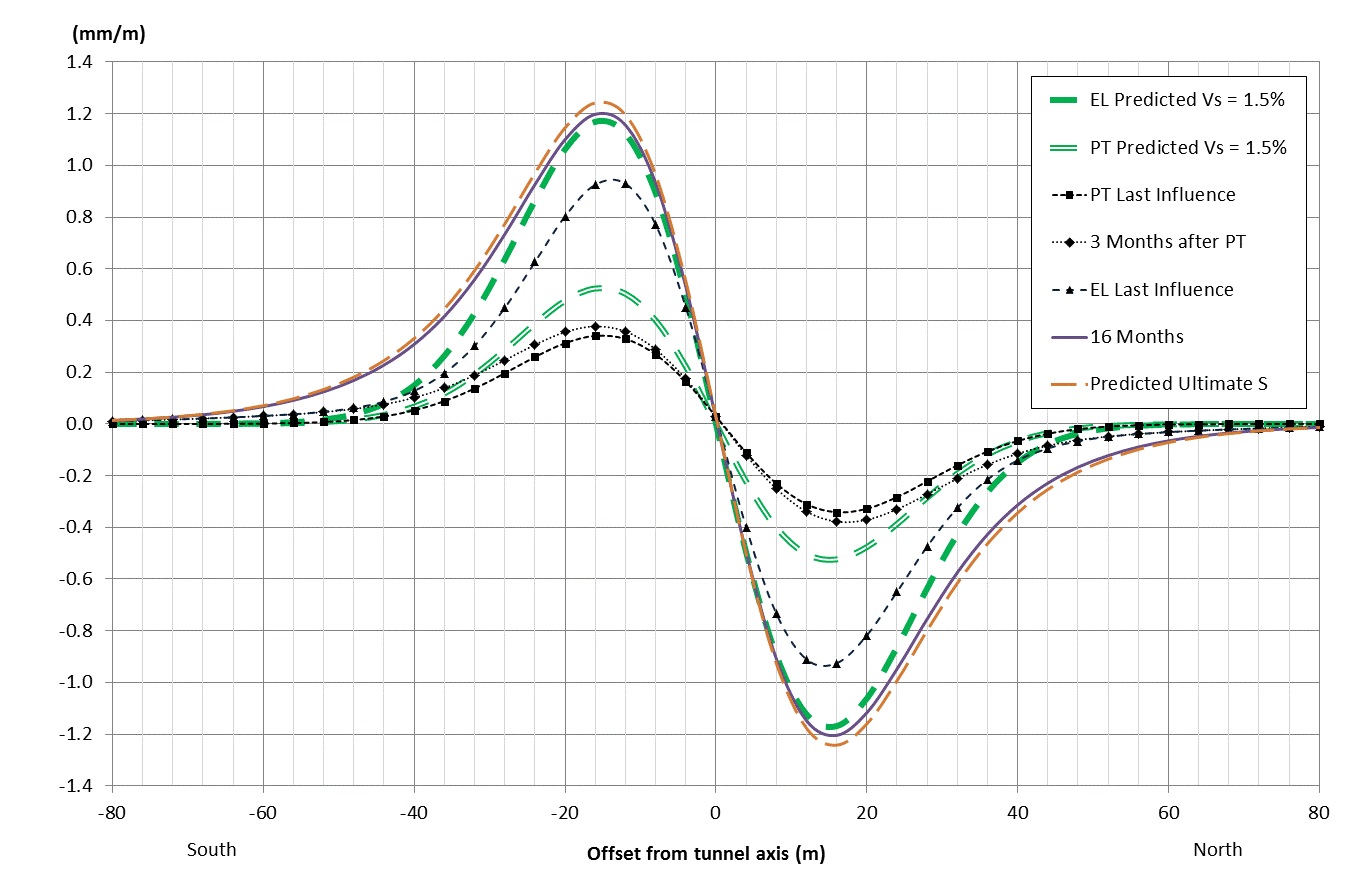
Figure 20 – Cumulative development of the transverse settlement trough slopes for each stage of excavation and period of long term settlement above EBRT-W. The contribution of each stage of excavation and long term settlement to deflections are presented in Figure 21. The cumulative deflections are shown in Figure 22. Deflections are calculated at 10 m line lengths with sagging in the centre of the trough and hogging beyond the inflection point. During long term settlement the deflections are shown to increase in the centre of the trough along with the increase in slopes and deepening of the trough centre. In the case for EBRT-W the deflections at the trough centre have increased to match the predicted maximum deflection of the short term settlement trough. Beyond the inflection point of the trough long-term settlement has also increased deflections beyond the zone of influence of the short term settlement trough. Unlike the trough centre, the short-term deflections at the edge of the short term trough have not been increased as the zone of increasing deflections is offset further from the tunnel axis.
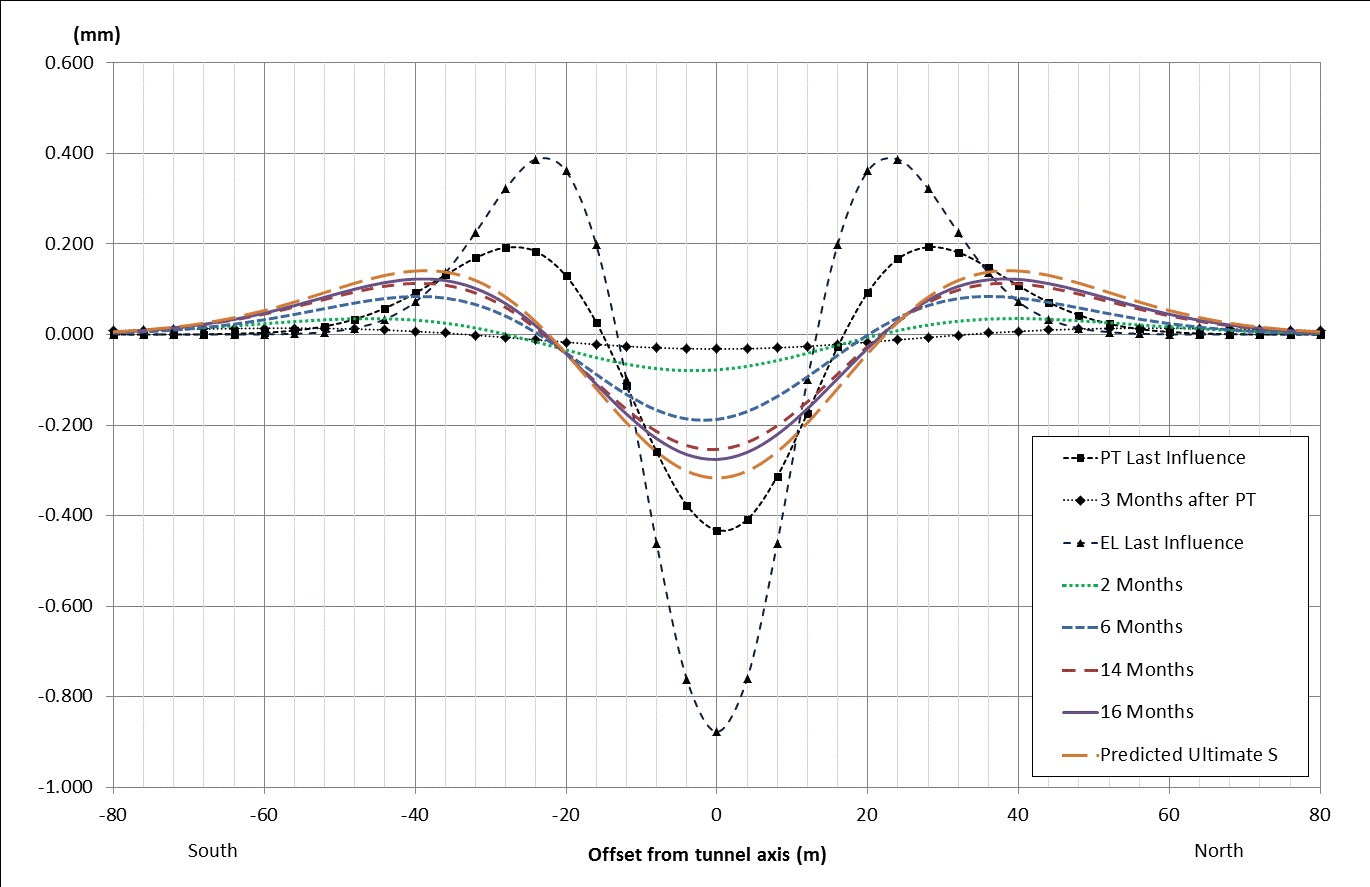
Figure 21 – Deflection contribution to the transverse settlement trough for each excavation stage and period of long term settlement above EBRT-W. Deflections are calculated for 10 m sections. 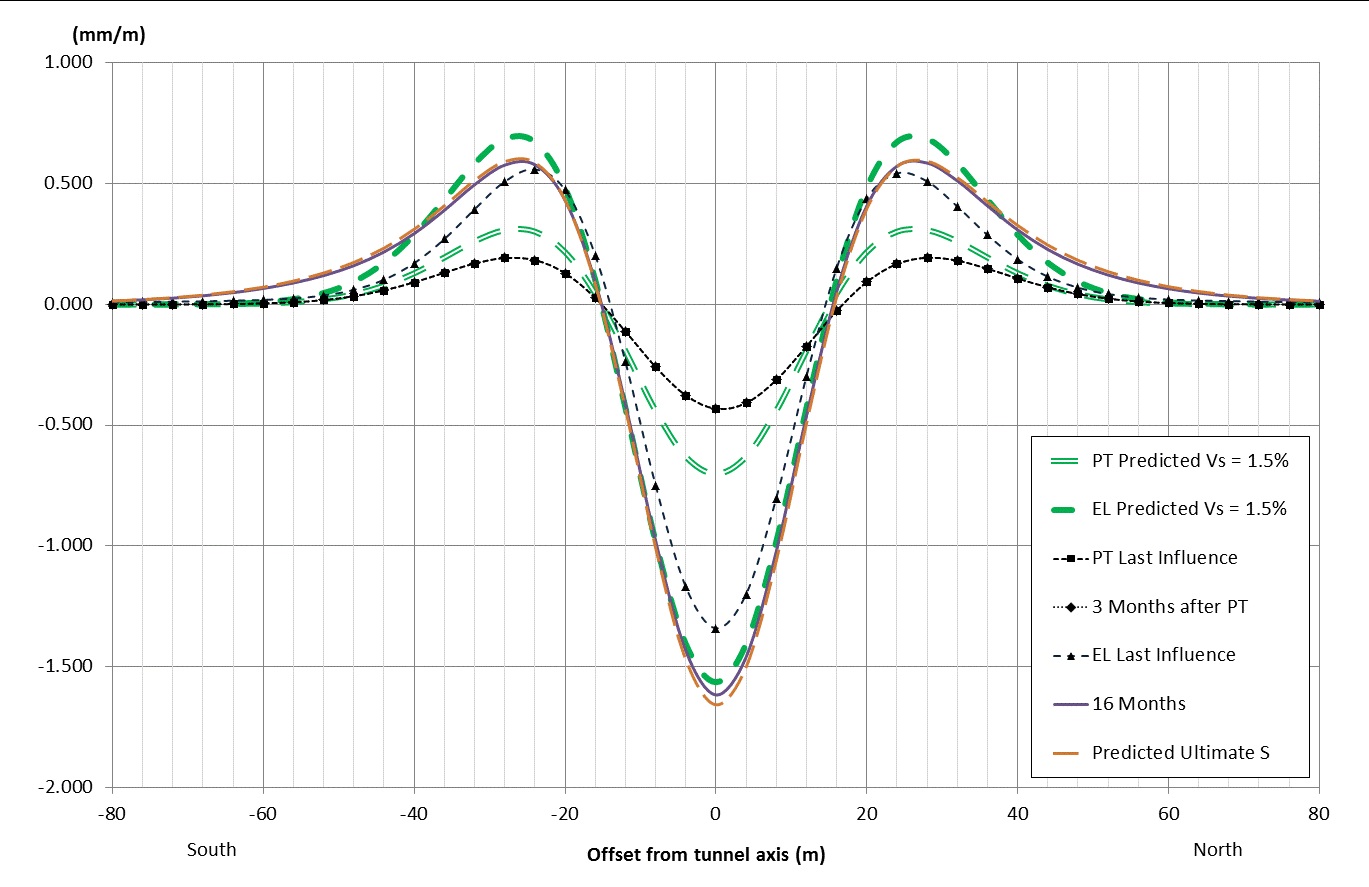
Figure 22 – Cumulative development of deflections for each stage of excavation and period of long term settlement above EBRT-W in comparison to the predicted deflections at 1.5 % volume loss. Deflections are calculated for 10 m sections. Conclusion
The comparison of the extent of the long term settlement trough to the short term settlement trough of the pilot and enlargement excavations indicates the following.
- A 2:1 ratio in the zone of long term settlement in relation to the tunnelling short term zone of influence.
- The extent of long‑term settlement may be proportional to the extent of short‑term settlement.
- The settlement distribution of the long term settlement only trough can be approximated by a Gaussian distribution the same way as the short term settlement trough.
- The extent of the long term settlement only trough remains constant.
These observations suggest the extent of the long term settlement trough represents the extent of excess pore water pressures and stresses that have developed due to tunnelling. The long term settlements are interpreted to be the result of equilibration of these pore water pressures and stresses.
The long term settlements at PTW-W at Kempton Court and EBRT-W at Vallance Road are consistent with hyperbolic consolidation settlement behaviour. Analysis of up to 2.5 years of long term settlement indicates the settlements will likely reach a final ultimate settlement.
The strongly hyperbolic settlement behaviour of the long term settlement and the non-expanding development of the long term settlement trough observed at Vallance Road indicate load induced consolidation, at least for the duration monitored, may be the primary mechanism of settlement. Both PTW-W and EBRT-W have not yet been lined with waterproofing, therefore these tunnels will continue to act as a drain for the London Clay until waterproofing has been installed. The water expelled from the London Clay by equilibration of excess pore pressures is likely to be draining through the tunnel lining in the form of steady state seepage. Eventually, the rate of consolidation may decline to a point where consolidation on its own may no longer be able to maintain the rate of steady state seepage. When this occurs, it is proposed the tunnel lining may continue to act as a drain and continued steady state seepage may result in future expansion of the long term settlement trough and increase settlements beyond the predicted ultimate settlement.
Comparison between Vallance Road and Kempton Court show that while the long term settlement behaviour at both locations follow hyperbolic consolidation settlement behaviour, the decay of the rate of settlement varies. The initial instantaneous rates of settlement are comparable, varying between 31 mm/yr at Kempton Court and 37 mm/yr at Vallance Road. However, the rate of consolidation at Vallance Road has decayed nearly twice as fast as at Kempton court. Vallance road has taken ~420 days for settlement rates to reduce to below 2 mm/yr whereas Kempton Court has taken approximately ~700 days. The variation in the rate of consolidation is likely related to the geology encountered by the tunnel excavation and may be influenced by additional load from buildings such as at Kempton Court. The invert of the EBRT-W excavation encountered up to 2 m thickness of sand channel deposits within the Upper Mottled Beds of the Lambeth Group. These sands in close proximity to the London Clay may contribute to more rapid equilibration and consolidation of the clay. At Kempton Court PTW-W was excavated entirely within the London Clay with the top of the Lambeth Group sediments located ~6m below the invert of the platform tunnel. The long term settlement processes at Kempton Court are most likely entirely controlled by consolidation behaviour of the London Clay. The larger amount of consolidation and slower rate of decay of the rate of settlement at Kempton Court may also be related to the additional load from the Kempton Court Building.
Detailed analysis of the development of the total settlement trough at Vallance Road demonstrates the significant effect long term settlements do have on the increase of slopes and deflections both inside and outside the initial short term settlement trough. The long term settlements over 16 months since completion of the tunnel have contributed an increase in slopes and deflections of the same order of magnitude as induced by the pilot tunnel. The maximum short term slopes have increase by up 30 % with significant development of slopes outside the short term settlement trough. Deflections at the trough centre have increased by up to 25% due to long term settlement with development of deflections outside the short term settlement trough.
Due to the prolonged time periods involved in the analysis of long term settlement, analysis is highly sensitive to uncertainties in the data. Reliable analysis requires consideration of benchmark stability, seasonal variation, long term ground movement unrelated to tunnelling, and localised instability etc. Above all, frequent readings of the points both inside and outside the zone of settlement and regular benchmark checks over long periods are required to give reliable results. Based on the Kempton Court long term settlement analysis, at least one year of detailed readings are required to come close to making reliable predictions of future settlements.
References
[1] Jones, B. and Clayton, C., 2013. Guidelines for Gaussian curve-fitting to settlement data. World Tunnel Congress 2013 Geneva Underground – the way to the future! Ed: G. Anagnostau & H. Ehrbar.
[2] Jones, B. and Clayton, C., 2012. Surface settlement due to deep tunnels in clay. ICE Research and Development Enabling Fund Grant 1021 Funder’s Report Document no: 1021 03 8th October 2012.
[3] Peck, R. B. (1969). Deep excavations and tunnelling in soft ground. Proceedings of 7th International Conference of Soil Mechanics and Foundation Engineering, Mexico City, State of the Art Volume, 225-290
[4] Schmidt, B. (1969). Settlements and ground movement associated with tunnelling in soils. PhD Thesis, University of Illinois, Urbana.
[5] Hill, N. and Stärk, A. (2015) Volume Loss and Long Term Settlement at Kempton Court, Whitechapel. Crossrail Project: Infrastructure Design and Construction (Volume 2) – Black, Dodge and Lawrence (Eds) – ICE Publishing.
[6] Colace, A. and Stärk, A. (2015) Depressurisation and Surface Settlement at Vallance Road Garden, WHI. Crossrail Project: Infrastructure Design and Construction (Volume 2) – Black, Dodge and Lawrence (Eds) – ICE Publishing.
[7] Tan, T,. Inoue, T., and Lee, L. (1991) Hyperbolic Method for Consolidation Analysis. Journal of Geotechnical Engineering 117 (11), 1723-1737.
[8] Hwang, R. N., & Moh, Z. 2006 Prediction of Long-term Settlements Induced by Shield Tunnelling. Journal of GeoEngineering 1 (2), 63-70.
[9] Vorster, T. E. B., Klar, Al, Soga, K. & Mair, R. J. (2005). Estimating the effect of tunnelling on existing pipelines. J. Geotech. Geoenviron. Engng ASCE 131. No. 11, 1399-1410
[10] Wongsaroj, J., Soga, K. & Mair (2013) Tunnelling-induced consolidation settlements in London Clay, Geotechnique, 63 (13), 1103-1115
[11] CIRIA (1996) Prediction and effects of ground movements caused by tunnelling in soft ground beneath urban areas. London: CIRIA
[12] Mair, R. J. & Taylor, R. N. (1997) ‘Theme lecture: Bored tunnelling in the urban environment’. Proceedings of the 14th International Conference on Soil Mechanics & Foundation Engineering 4. Held in Hamburg. Rotterdam, Balkema, 2353-2385.
[13] Groves, P. N., Morgan, S. R. (1997) Engineering consequences of ground conditions of NATM works at London Bridge Station, Jubilee Line Extension. Proceedings of the 8th International Tunnelling Symposium. London: Institution of Mining and Metallurgy.
[14] Eddie, C. and Neumann, C. (2003) LaserShell™ leads the way for SCL tunnels. Tunnels and Tunnelling, June 2003, 38 – 42.
[15] Eddie, C. and Neumann, C. (2004) Development of LaserShell™ Method of Tunneling. Proceedings of the North American Tunneling Conference 2004, Atlanta. Pub. Balkema, Rotterdam.
[16] Chapman, D., Metje, N. and Stärk, A. (2010) Introduction to Tunnel Construction. Applied Geomechanics Volume 3, Taylor and Francis Group.
-
Authors


Dr Alfred Stärk Dipl Ing Dr Ing - BeMo Tunnelling
Dr Alfred Stärk is Chief Geotechnical Engineer and Engineering Manager at BBMV for Crossrail Contract 510 ‘Whitechapel and Liverpool Street Station Tunnels’ since March of 2011. He started his career at the University of Hanover, Germany, where he worked as assistant professor and consultant for 10 years. In 2002 he joined BeMo Tunnelling, Innsbruck, Austria. He now has 25 years of experience in large-scale tunnelling, mainly with sprayed concrete lining in soft ground.
