Moorgate Shaft Base Slab, design, detailing and construction
Document
type: Technical Paper
Author:
Adrian Douglas Eur Ing, MEng CEng MICE, M Smith BSc(Hons), J Hunter BEng(Hons) CEng MICE, ICE Publishing
Publication
Date: 31/08/2016
-
Read the full document
Key words
Concrete structures, Thermal effects, Strength and testing of materials
Introduction
Figure 1 shows how the new Crossrail station at Liverpool Street extends between the London Underground stations at Liverpool Street and Moorgate. The Moorgate shaft is at the west end and contains part of the main escalator bank from the ticket hall, emergency egress from the station platforms, a fire fighting lift, a passenger lift, station ventilation, tunnel ventilation, and part of the connection to the London Underground Northern Line. The new station’s platforms are the deepest below ground level on Crossrail.
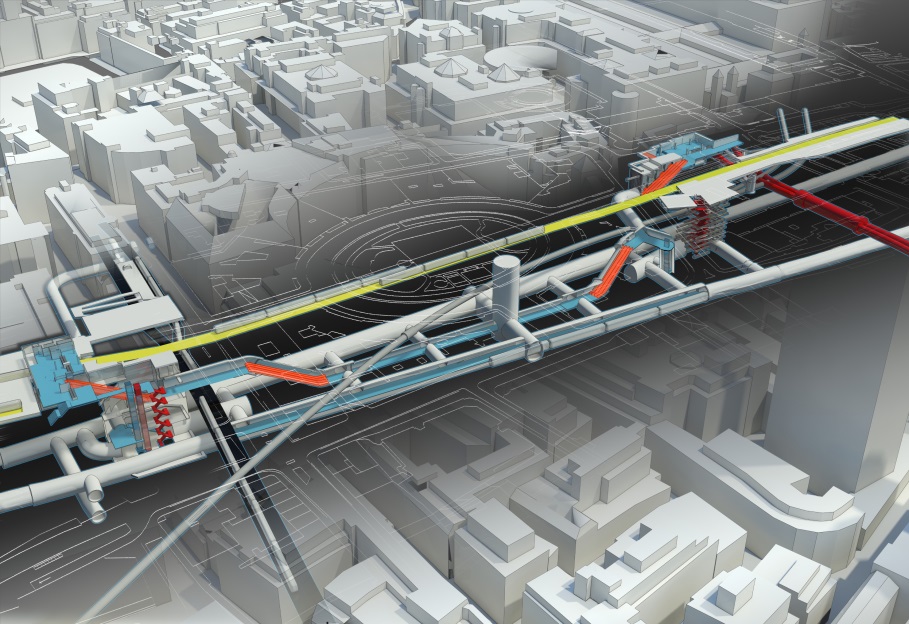
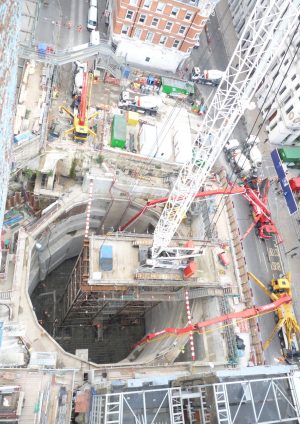
Figure 1 – Liverpool Street Crossrail station – Moorgate shaft is on the left The shaft is an irregular shape, approximately 34 m square in plan and is 42 m deep to bottom of excavation. The plan at base slab level is shown in Figure 2 and a typical section in Figure 3. A general view looking down the shaft is shown in Figure 4.
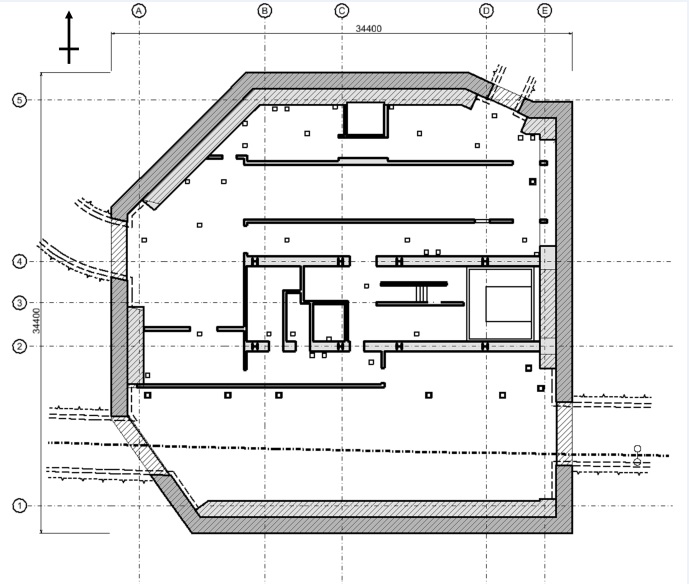
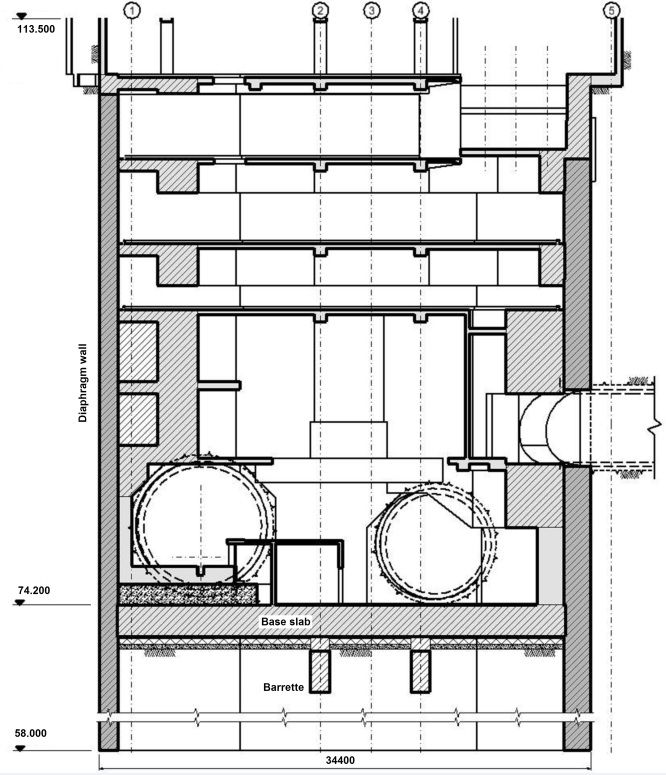
Figure 2 – Plan of base slab Figure 3 – Vertical section through shaft – grid B looking west (m LUD, metres above London Underground datum which is 100m below Ordnance datum) This paper describes the design requirements for the base slab at the bottom of the shaft, the detailing of the reinforcement, the planning for the concrete pour, the execution of the pour and the temperature monitoring after the pour. The principal pour parameters are given in Table 1.
Concrete C35/45, DC-4, F5 1750 m3 Reinforcement tonnage 830 t Number of reinforcement detail drawings 118 Nr Time to detail drawings 110 days Time to fix reinforcement 51 days Time for pour for base slab 17 hours Peak measured concrete temperature 55 ºC Maximum measured differential temperature 30 ºC Table 1 – Principal pour parameters
The shaft was designed by Mott MacDonald (MML) as part of the Crossrail (CRL) design contract C138. The contractor for the shaft was a joint venture of Bam Nuttall and Kier (BNK) under the CRL enabling works contract C501. BNK were responsible for detailing the reinforcement from design intent (RIBA E) drawings prepared by MML.
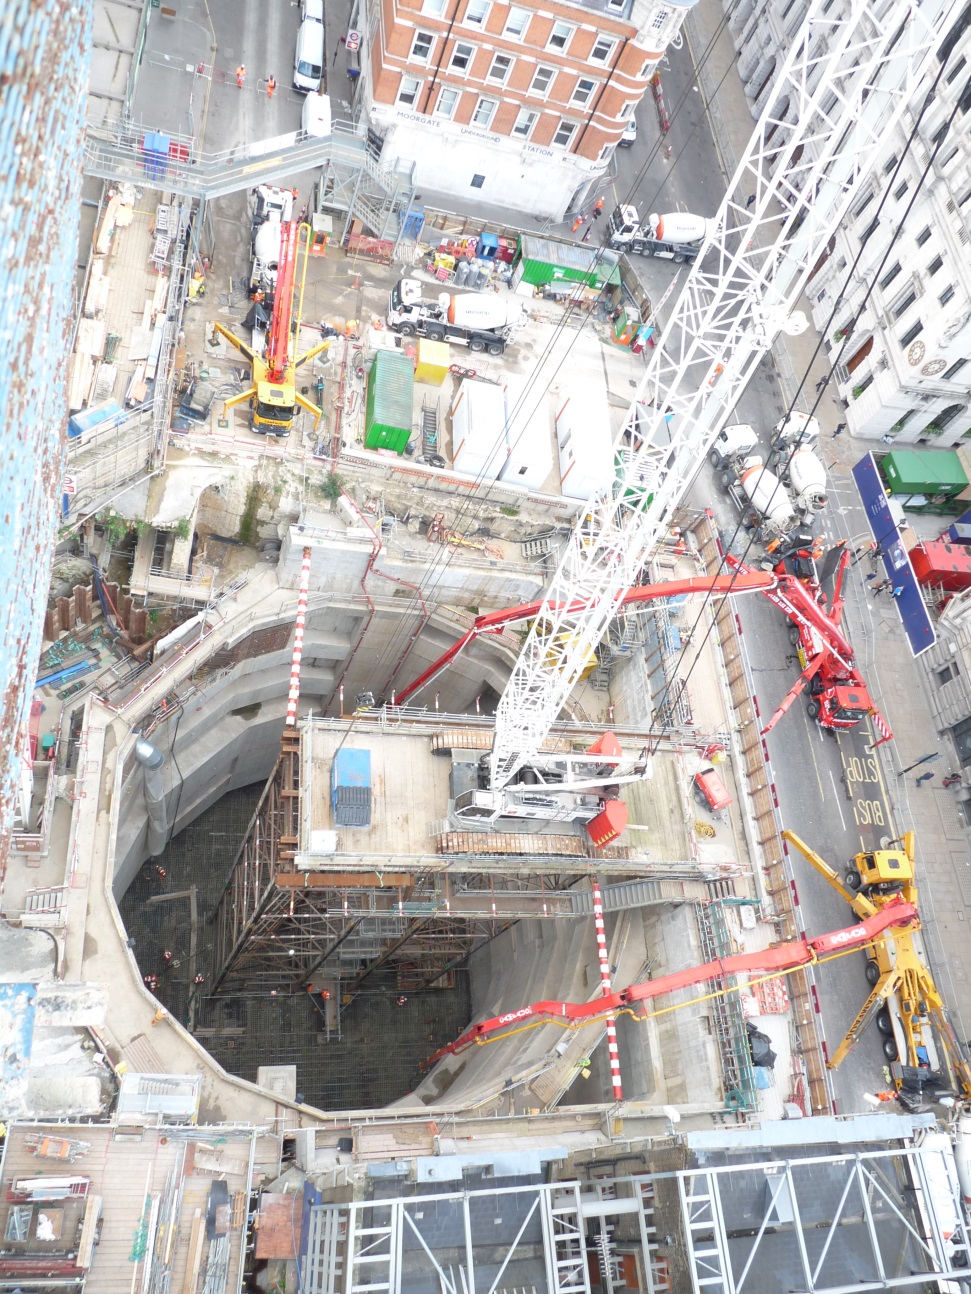
Figure 4 – View of shaft and construction access jetty during concrete pour Design
The shaft was excavated through London Clay into the top of the Lambeth Group. A 300 mm thick blinding slab was cast onto the ground at the bottom of the excavation to strut the diaphragm walls whilst the base slab was constructed. The ground beneath the base slab is expected to heave by up to 140 mm. The ground water is underdrained to the underlying chalk so although the water table is near ground level the base slab is only subject to a characteristic water pressure of 270 kPa (27 m head) (Used for design approach 1 combination 2 in accordance with BS EN 1997-1 (BSI, 2004)).
A controlled collapsible void former was specified under the slab to limit the load due to ground heave to 75 kPa. The 2 m thick base slab is connected to the perimeter diaphragm wall and central tension barrettes as shown in Figure 5. The slab was designed to be watertight to class 1 to BS EN 1992-3 (BSI, 2006).
This requires a minimum of 50 mm thickness of concrete in compression, or where cracks may pass through the whole thickness of the section, crack widths limited to 0.15 mm as the hydraulic gradient of 13.5 across the slab is greater than 5. The joint with the diaphragm wall will be incorporated into the base of the lining walls where the watertight joint to the base slab is achieved with hydrophilic strips.
Very dense reinforcement was required to meet the crack width limitations. The reinforcement generally comprised three layers of B40 at 150 mm centres in each direction in the critical areas on top and bottom faces, and was curtailed to one layer of B40 reinforcement in the compression zones. However, the anchorage length of the reinforcement is so long that there were few areas without multiple layers of B40 reinforcement. Shear links were required across the whole area of the base, with a higher density around the perimeter and adjacent to the tension barrettes.
An earthing mat was required under the slab with watertight connections through to earth pits cast into the slab. A drainage network for fire water and seepage water was also cast into the slab. This drained to a sump on the east side of the slab.
The concrete was specified as a designed mix in accordance with BS 8500 (BSI, 2006) suitable for exposure class XC3 and DC-4 due to aggressive ground conditions exacerbated by hydraulic gradient greater than 5. Strength grade C35/45 was adopted for structural design, and a minimum cementitious content of 360 kg/m3 and maximum water cement ratio of 0.45 were specified.
The specification for concrete for the shaft works limited the peak concrete temperature to 70ºC and the differential temperature between core and surface to 25ºC. The reinforcement design for early thermal effects assumed a concrete mix with 380 kg/m3 cementitious content with 60% ground granulated blast furnace slag (ggbs). This mix was estimated to have an embodied carbon content of 70 kg/t CO2e. Equivalent embodied carbon dioxide weights are calculated using the data in Specifying Sustainable Concrete (The Concrete Centre, 2011).
Temperatures were predicted using the spreadsheet associated with CIRIA Guide C660, Early age thermal crack control in concrete (Bamforth, 2007). For initial concrete and ambient temperature at 20ºC, the predicted differential temperature was 35ºC, and the predicted peak temperature was 65ºC. The 35ºC differential temperature was not critical for the reinforcement design. BNK were therefore permitted to relax the specified restriction on the differential temperature from 25ºC to 35ºC and made aware of potential difficulties in meeting the 70ºC restriction on peak temperature in hot weather.
Reinforcement Detailing
The reinforcement was detailed for BNK by Capita. The reinforcement details were developed collaboratively by Capita, BNK and MML, reviewed by MML and approved by CRL. Due to the large bar diameter with relatively close spacing, use of lapped bars was difficult, and due to the length of the laps, staggered laps not practicable. Full strength parallel threaded swaged couplers were therefore used to join all the main reinforcement. For standard couplers this was the lowest material cost.
Bridging couplers, which enable some adjustment in coupler length, were used generally to ensure that the running dimension of the cage could be maintained accurately. This coupled cage did not accommodate the variation in the position of the diaphragm walls which, taking account of construction tolerances, could be between 270 mm out of the shaft to 370 mm (including overbreak) into the shaft.
A secondary cage, lapped onto the primary cage, was therefore detailed to ensure that reinforcement was present close to the diaphragm wall around the perimeter of the shaft to limit the length of the connecting dowels required (Figure 5). The actual as-built variation in diaphragm wall position was from 175 mm out of the shaft to 320 mm into the shaft after the face had been smoothed with a rock roller removing some of the overbreak.
Shear link reinforcement area requirements were met by using LinkStuds™ shear studs. These consist of a reinforcement bar with an upset forged end to provide an anchorage. They improved both safety and fixing productivity as they allowed the shear reinforcement to be lowered into the cage from above with no need for access inside the cage.
The six layers of the top mat were detailed to be fixed from the bottom up so that no reinforcement had to be threaded through the top mat.
Three dimensional CAD modelling of the reinforcement was used to identify and resolve reinforcement clashes and gaps. Colour coding of the reinforcement was used to clarify the layers, an example of this is shown in Figure 6. An example of the 3d model at the sump is shown in Figure 7, with the same area, as fixed, shown in Figure 8.
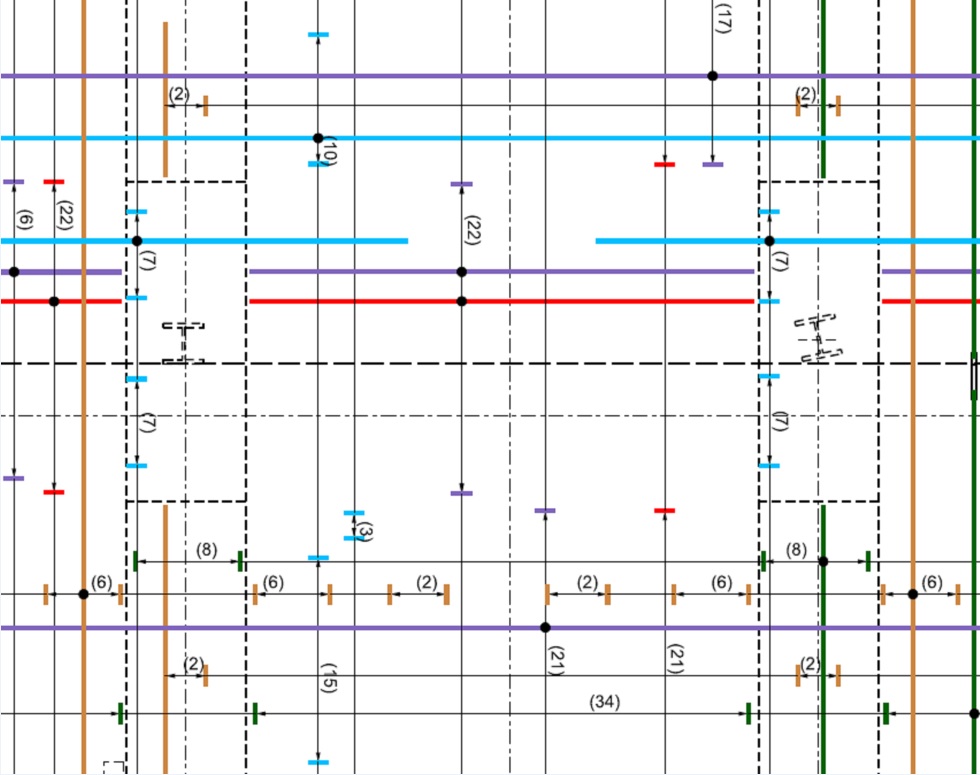
Figure 6 – Colour-coded reinforcement detail drawing 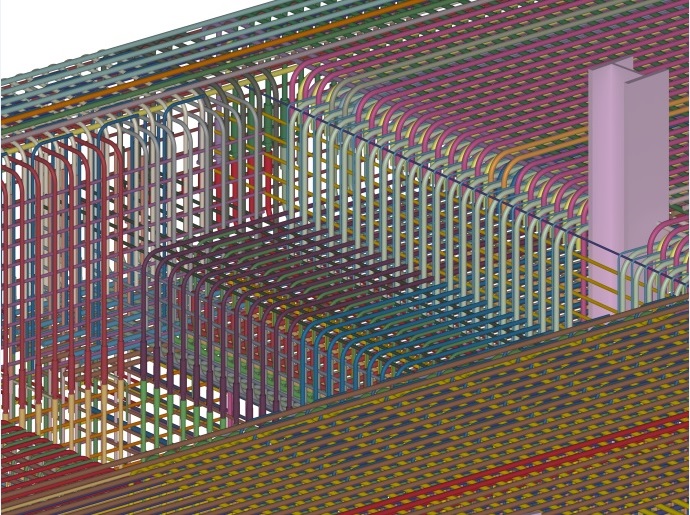
Figure 7 – Three-dimensional model of reinforcement cage at sump 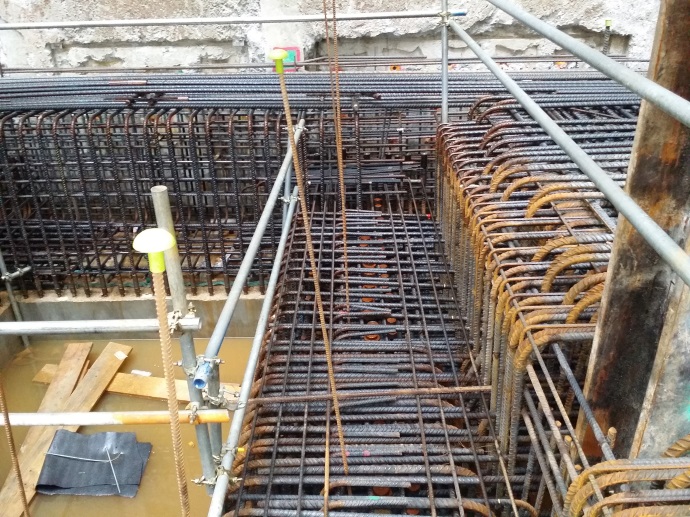
Figure 8 – Reinforcement cage at sump Reinforcement fixing
The top mat of reinforcement weighed a maximum of approximately 400 kg/m2. This weight could not be supported on conventional reinforcement chairs. A support frame was designed by BNK consisting of scaffold tube towers carrying ‘I’ beams as shown in Figure 9 and Figure 10. This was left in place with the scaffold tubes filled with grout to prevent voids and limit seepage paths through the structure.
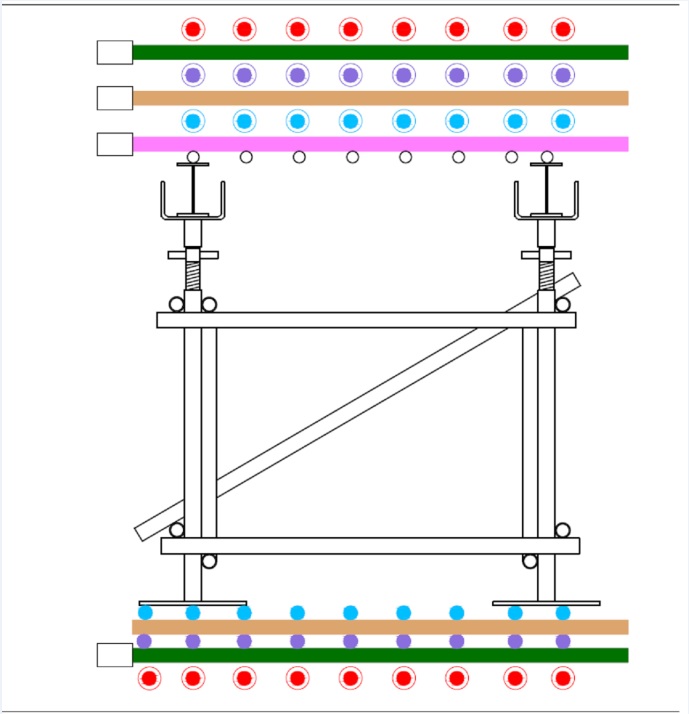
Figure 9 – Reinforcement support frame 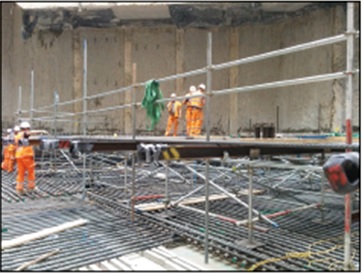
Figure 10 – Support frames for top reinforcement The local pressure under the base plates with this arrangement exceeded the collapse load of the specified void former. A stronger void former was developed by Cordek to support the loads during execution determined in accordance with BS EN 1991-6 (BSI, 2005) including loads from reinforcement supports, heaped wet concrete and construction activities. It was demonstrated through testing that the maximum load after collapse at the required deformation of 140 mm was within the original design assumptions. The test result is shown in Figure 11.
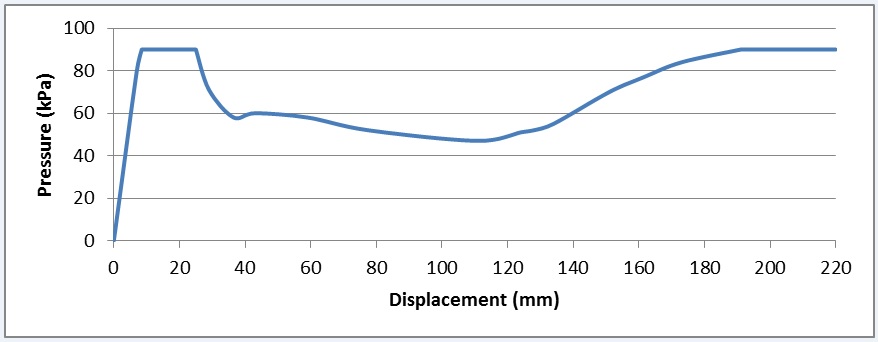
Figure 11 – Load-deflection curve of void former The barrette starters were fixed after the bottom mat. Straight starters were coupled onto the barrette reinforcement with anchorage terminators at the top. The reinforcement grid had to be accurately placed to ensure that the coupled starter bars for the internal walls could be placed within the required tolerance. Several temporary man access openings were left in the top mat to allow safe access and egress for fixing of drainage and earthing connections to be carried out within the reinforcement cage as shown in Figure 12. These openings were closed before the start of concreting.
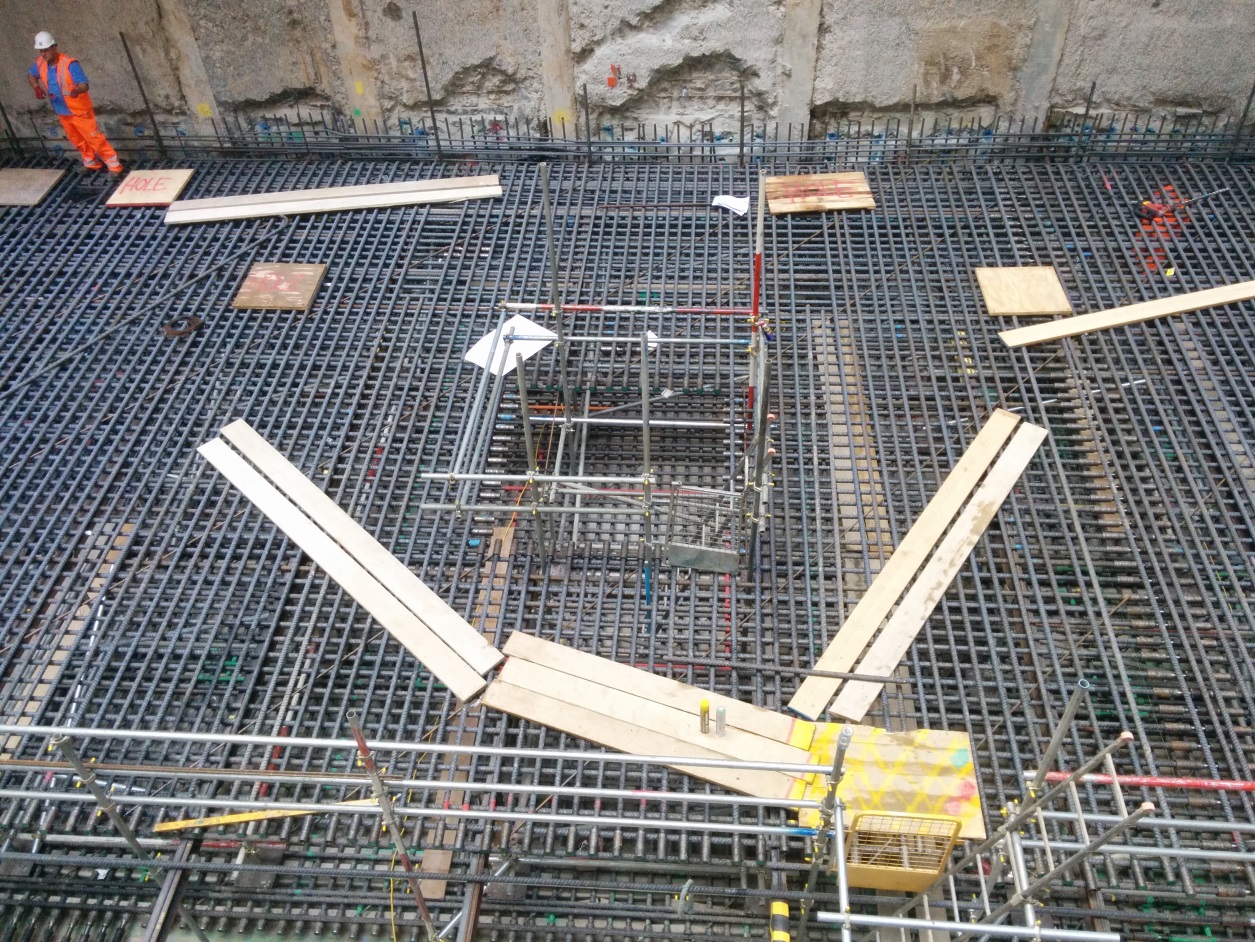
Figure 12 – Access opening in top mat The difficulties and safety concerns of working inside the cage are illustrated by Figure 13 showing the drainage, and by Figure 14 which is after the shear studs were placed. These concerns were mitigated through collaborative reviews between the design and construction teams.
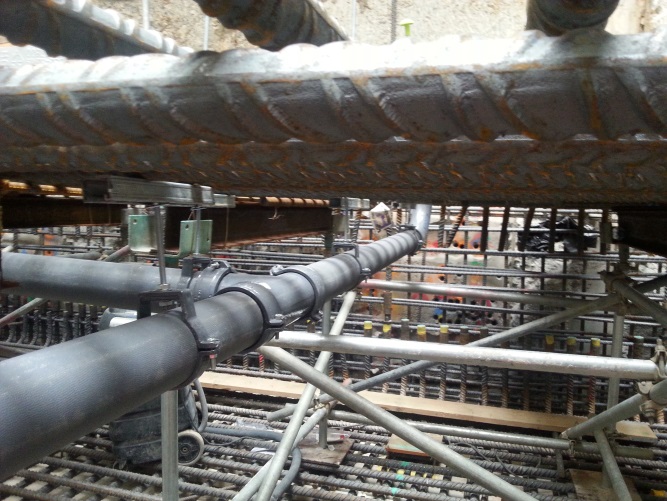
Figure 13 – Drainage pipes within reinforcement cage 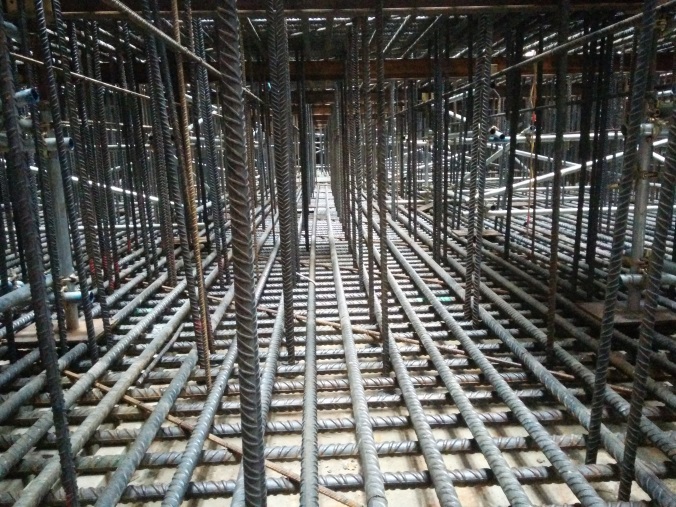
Figure 14 – Shear studs inside reinforcement cage Quality control was through self-certification by BNK with review by CRL. During steel fixing, for the reinforcement snagging an innovative approach was adopted with the snags being identified with a label tied to the cage by the engineers describing the issue. These were then snipped by the steel fixers when resolved before being removed by the engineer. Describing the location of the snag had proved ineffectual on the large uniform base slab.
Concrete mix design development
BNK required a concrete mix with an F5 consistency to enable placing by pump in the heavy, dense, and in places congested reinforcement. In order to achieve this and comply with the specification Hanson offered a preliminary mix with 425 kg/m3 of cementitious material with 70% ggbs. The estimated embodied carbon for this mix was of 60 kg/t CO2e. The high cement content of this mix raised concerns with temperature development during curing. In discussions between specialists within MML and Hanson facilitated by the CRL, MML and BNK site teams it was agreed to modify the specification to allow a more practical concrete mix based on results of tests on the trial mix and accepting concrete strength tested at 56 days.
The revised mix was tested for temperature development and for initial set. The revised mix is presented in Table 2. It has 390 kg/m3 of cementitious material with 70% ggbs. The estimated embodied carbon for this mix was of 55 kg/t CO2e. Super plasticiser, retarder and shrinkage reducing admixtures were used. An initial set delayed to 13 hours after batching was demonstrated through penetration testing. The results of the penetration testing are shown in Figure 15. The pour was programmed to spread the concrete in 500mm deep layers working from east to west so that there was no more than six hours before each layer was covered with the subsequent layer.
Material Quantity (kg/m3) Description Cement 117 CEM1 (30%) Cement replacement 273 ggbs (70%) Total Cementitious 390 kg/m3 Aggregate 10/20 445 Limestone Aggregate 4/10 445 Limestone Aggregate 0/4 890 Marine sand Filler 40 Limestone powder Water 170 Total 2380
Water cement ratio 0.44 Embodied equivalent CO2 55 kg/t CO2e Admixtures Dose (l/m3) Superplasticiser 2.37 Sika ® ViscoFlow ® 1000 Retarder 0.43 SikaTard ® R Shrinkage control 4.30 Sika ® Control 40 Table 2 – Concrete mix design
The temperature test was carried out with a 2 m test cube cast onto the void former material to simulate the insulation this provides at the bottom of the pour. The input parameters for the spreadsheet provided with CIRIA Guide C660 on early thermal shrinkage were adjusted to match the temperatures measured in the test cube. The thickness was increased to represent the insulation on the underside of the pour and the thermal capacity of the concrete adjusted to match the rate of temperature change. The time from batching was adjusted to match the time of peak temperature to account for the effect of the retarder. The results of the test and the calibrated CIRIA Guide C660 spreadsheet predictions are shown in Figure 16.
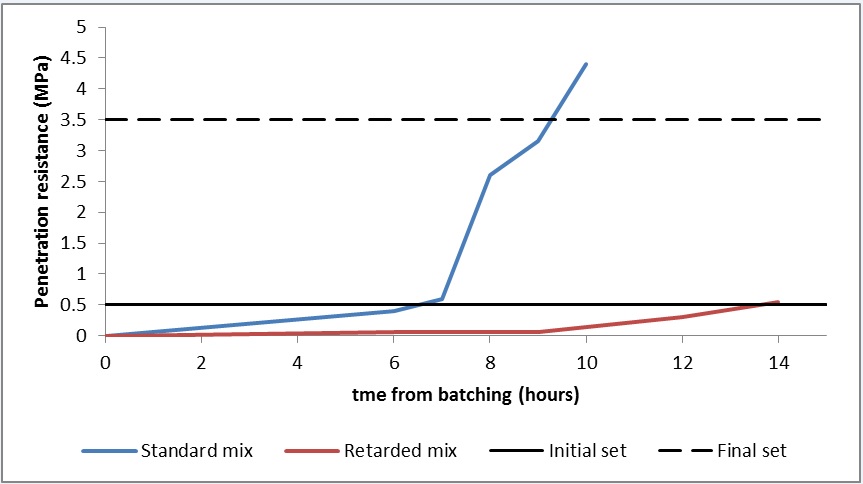
Figure 15 – Penetration testing for initial set of retarded mix 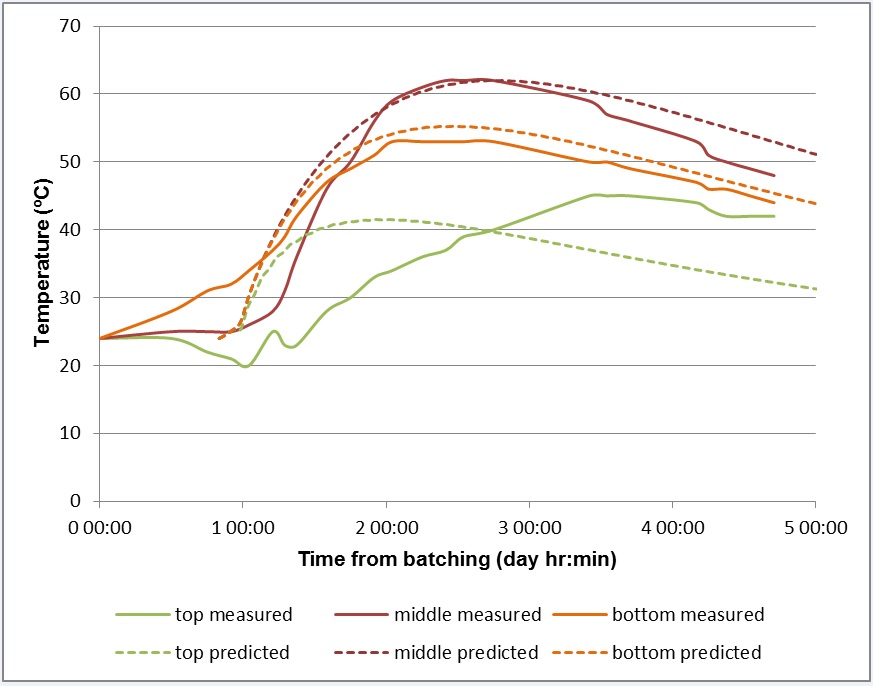
Figure 16 – Temperatures measured and predicted for trial cube A good fit for maximum temperature was achieved, except for the surface temperature which was sensitive to the ambient temperature after the pour. The differential temperature was underestimated.
With this mix there was still a risk of excessive peak temperatures if the ambient temperature and delivered concrete temperature was high. Maximum differential temperatures were predicted assuming delivery temperature of 15ºC and ambient temperature of 5ºC.
The peak and differential temperatures can be controlled on site by a combination of blowing hot or cold air in to the base of the shaft and by placing or removing insulating frost blankets. Based on the results of the testing, trigger values were developed for ambient temperature at which mitigation measures would be deployed or removed. The maximum ambient temperature trigger of 25ºC was set to give a predicted peak temperature of 65ºC above which cooling measures would be required.
Thermocouples were installed in the slab to monitor concrete temperature so that mitigation measures could be implemented if required. Nine sets of three thermocouples were distributed across the slab. Each set consisted of a thermocouple near the top surface, in the centre of the slab and near the bottom. Temperature monitoring was required for seven days after the pour, but in the event this was extended to 13 days as it was not disrupting any subsequent activities.
The temperature at the bottom of the shaft differed from the temperature at street level. In the run up to the base pour records were kept over several weeks of the variation in temperature between top and bottom of the shaft. The recorded temperatures and the upper and lower bound estimates are shown in Figure 17.
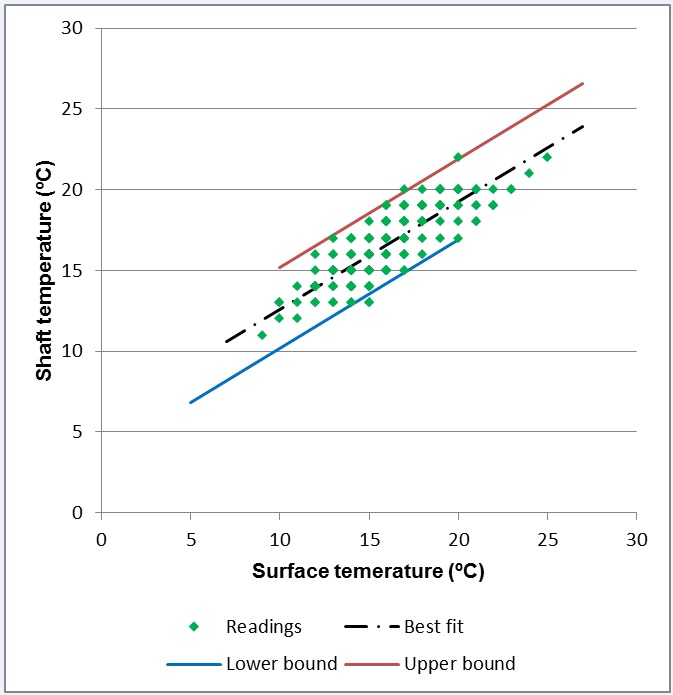
Figure 17 – Relation between shaft temperature and surface temperature Trigger values for mitigation measures for controlling concrete temperature were set for predicted temperatures at the bottom of the shaft. These were to be adjusted from the forecast temperature for the estimated differences at the bottom of the shaft. This was particularly relevant for cold forecast temperatures where the bottom of the shaft was found to be approximately 2ºC warmer than the surface.
Pour preparation
The CRL site team, MML and BNK were aware that this was a critical concreting operation with severe consequences to the project if the pour had to be aborted or if cold joints were formed with no opportunity for remedial action during the pour and limited remedial options after the pour. MML therefore advised CRL to request a detailed pour plan from BNK to include contingency measures to address foreseeable difficulties during the pour. The requirements for the pour plan were developed from the concrete execution standard BS EN 13670 (BSI, 2009).
The main concerns were: interruption of the concrete supply and control of temperatures in the concrete during initial curing. The risks and contingency measures in place are summarised in Table 3.
Risk Consequence Potential cause Contingency measures identified Interrupted concrete supply Joint required in base slab.
Base slab is not assured to be watertight.
Breakout and re-work
Failure of batching plant Use of multiple batching plants.Fitters to be on stand-by for each batching plant. Material shortage at batching plant Sufficient stock piles at the batching plants and plan in place to resupply batching plant or use alternative plant. Disruption to transport Alternative traffic routes identified from each batching plant.
Additional vehicles available to provide redundancy.
Failure of concrete pump Additional concrete pump on site on standby. Poor communication between site and batching plants Single point of contact between site and concrete supplier established with backup contacts. In the event of the pour being abandoned part way through expanded metal stop ends installed within reinforcement cage to form a construction joint. Concrete peak temperature exceeded Change in concrete chemistry with delayed ettringite formation High concrete temperature when poured Thermocouples installed in pour to be monitored for 10 days after completion.Forced ventilation of shaftMaximum concrete placing temperature (25ºC) High ambient temperature during curing Trigger value for ambient temperature (20ºC)
Trigger value for peak temperature (60ºC)
Concrete differential temperature Excessive cracking of concrete. Reduced watertightness, reduced durability Cold surface temperature during curing Insulate top surface
Blow warm air into shaft
Trigger value for ambient temperature (2ºC) (equivalent to 5ºC at the bottom of the shaft)
High core temperature Trigger value for differential temperature (30ºC) Adverse weather conditions Damage to concrete General Monitoring weather forecast for duration of pour. Solar heating Trigger level for concrete temperatures set.
Relation between surface and shaft temperature established
Wind Not relevant at bottom of shaft.
Limitations for cranes and concrete pumps established.
Freezing Trigger levels for concrete temperatures set.
Relation between surface and shaft temperature established.
Rain Postpone pour if heavy rainfall is forecast before concrete is predicted to have achieved final set Snow Postpone pour if snow is forecast before concrete is predicted to have achieved final set Preparation work incomplete Delayed start to pour Reinforcement not fixed correctly
Pour area not clean
Insufficient cover
Traffic management closures not in place
Quality control procedures for pour identified in pour plan and Inspection and Test Plan (ITP) Construction equipment not available Full labour and plant lists included in the pour plan Table 3 – Risks and contingencies for pour
Three batching plants were planned to be used during the pour with the supply split: 1100 m3 from Kings Cross, 600 m3 from Silvertown and 300 m3 from Victoria Deep in Greenwich. A second batching plant at Victoria Deep was designated as a back-up. This arrangement provided redundancy in the supply, whilst two plants could provide the required supply rate, the third plant covered for shift changes and minor delays at any of the other plants. Should any batching plant fail then the other two would increase their production to cover the shortfall. The back-up plant was stocked and approved but would only be required if one of the other plants stopped production.
Transport from the batching plants was planned to use 14 wagons from Kings Cross with a journey time of 12 minutes, 9 wagons from Silvertown with a journey time of 14 minutes and 2 wagons from Victoria Deep with a journey time of 18 minutes. Designated primary and secondary routes were identified using Crossrail approved lorry routes. Maps of the routes were provided to the drivers. Separate marshalling areas were defined for each concrete pump. The routes local to the site are shown on Figure 18.
Table 4 lists the resources planned for the pour. The pour was scheduled for early November. The planned pour rate was for a maximum of 120 m3 per hour. The complete pour of 1750 m3 was scheduled to take between 18 and 30 hours to allow for any delays.
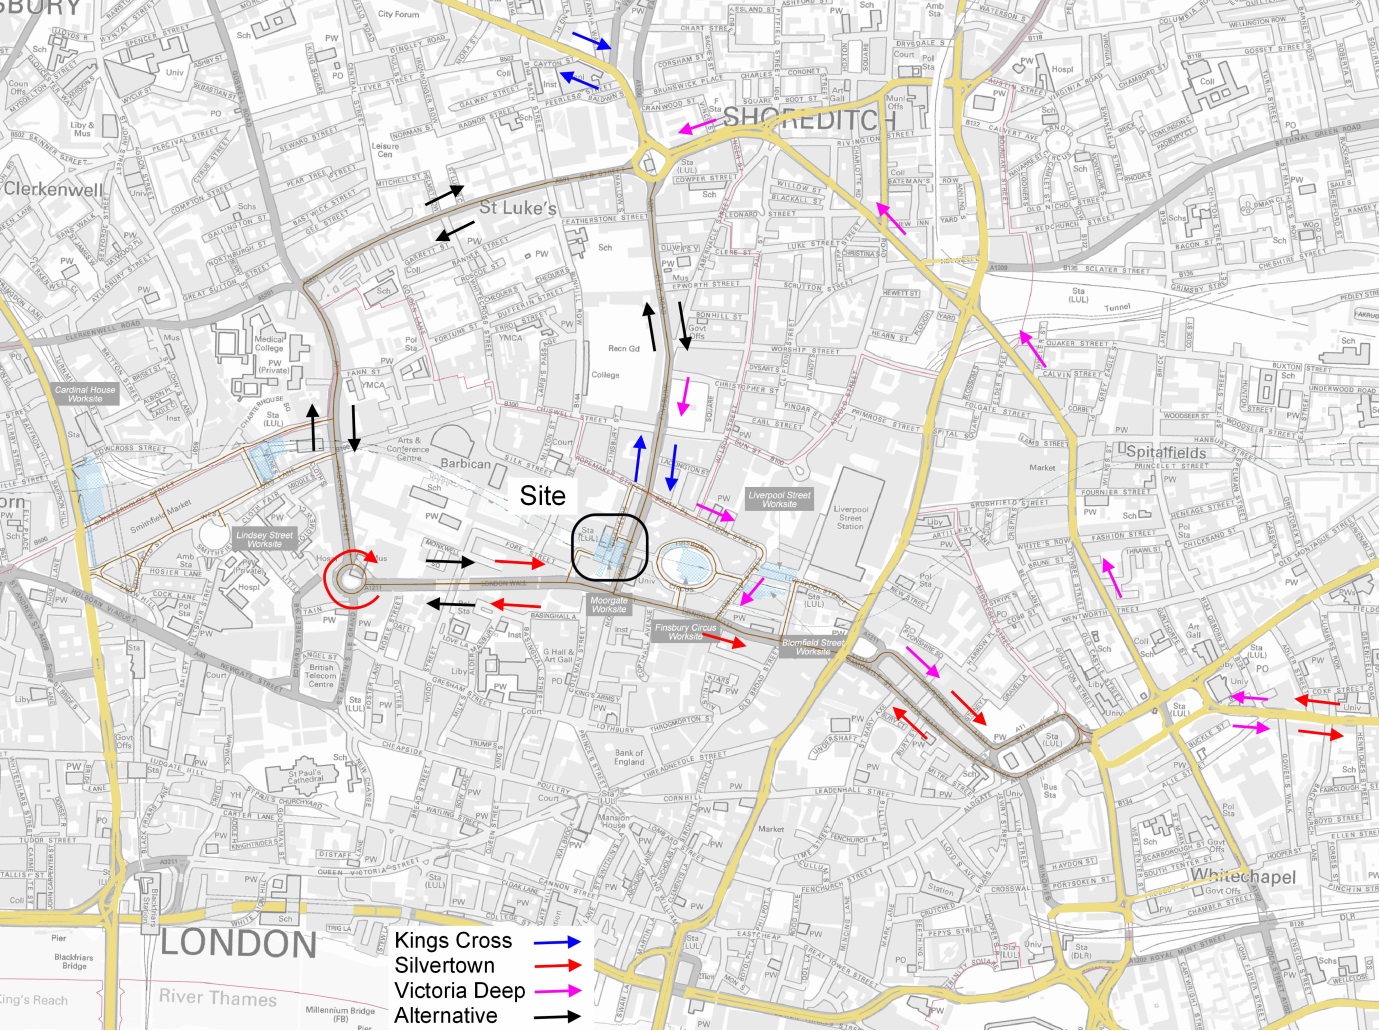
Figure 18 – Routes into the holding area Personnel (each shift) Equipment Materials BNK nominated concrete co-ordinator
3 shift engineers
1 electrician
2 slingers
15 concrete operatives
1 concrete wagon booking operative
6 operatives at the concrete pump
6 security guards
Canteen staff
5 gate men
6 concrete testing technicians
Traffic management sub-contractor team
3 main concrete pump drivers
1 back up pump driver
1 Camfaud fitter
2 no. 63 m reach concrete pumps
1 no. 36 m reach concrete pump
1 no. 56 m reach concrete pump (back up)
Tower crane
Crawler crane
Vibrating pokers
Hand tools
2 m3 concrete skip
3 m3 concrete skip
Roller screeds
3 batching plants
25 concrete wagons
Thermocouples and data loggers
3 propane heaters
Frost Blanket
screed rails
Stainless steel tying wire
Spray applied curing membrane
Full diesel bowser
Table 4 – Resources planned for pour The road closure for the pour was booked from 20:00 on Friday through to 06:00 on Monday to allow for setting up, clearing away and significant delays.
Within the shaft an access bridge was constructed from the main access jetty over to the previously cast sump to enable exit from the shaft bottom after finishing to one side of the slab (Figure 24). The site canteen was planned to be open throughout the pour and free of charge. In the days leading up to the pour the following were put into place:
• All quality control documentation for construction drawings, material conformance records etc., agreed and signed off;
• Testing of dowel bars and embedded drainage completed;
• Record sheets prepared and sufficient printed off;
• Concrete placement lines assembled on reinforcement;
• Screed rails set to level and secured;
• Thermocouples installed;
• Embedded drainage pipes filled with water to prevent flotation;
• Proposed traffic routes inspected for diversions or road works.Concrete pour
The road closure for the pour was put into place at 20:00 on Friday. The two 63 m reach Camfaud concrete pumps were set up on Moorgate to the east of the shaft, aligned so that one received concrete wagons from the north and the other from the south. The 36 m reach pump was set up to the north of the shaft and connected to a static line installed for the shaft construction as shown in Figure 4.
The first concrete was delivered at 23:10. It was found that the reach of the 63 m reach pumps was sufficient to cover the whole area of the pour so the moveable concrete lines on the reinforcement cage were deemed unnecessary and removed. When planning the pump layout it was assumed that the arms were vertical or horizontal. In practice it was possible to angle some of the arm segements down the shaft with some increase in reach. The 36 m reach pump was stood down from 10:30 on Saturday. Only one of the 63 m reach pumps was used from 15:00 on the Saturday, the reduced pour rate allowing for the effort required for finishing. Concreting was complete by 16:15. The number of wagons departing each hour is shown in Figure 19.
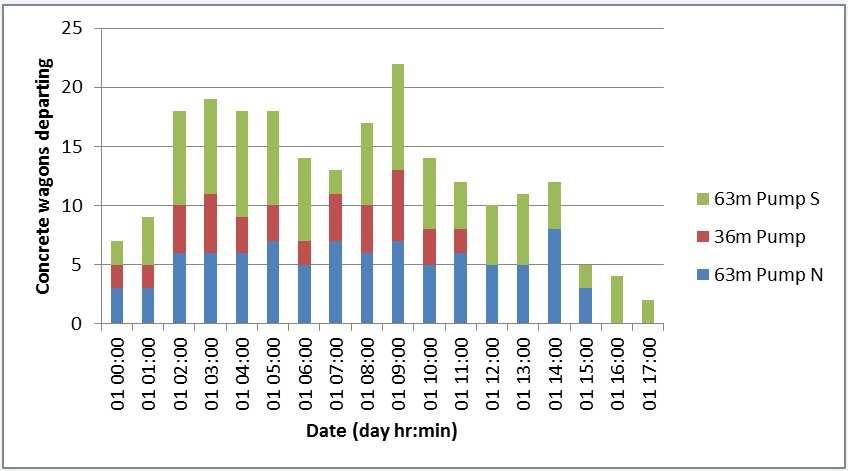
Figure 19 – Number of concrete wagons departing each hour during the pour There were no delays to the concrete supply or incidents during the pour. Review of the delivery tickets indicated that a maximum pour rate of 150 m3 was sustained for one hour. The pour rate was reduced to 100 m3 per hour during the shift change around 06:00 on Saturday morning. The entire 1750 m3 had been placed in 5 minutes over 17 hours.
The delivery temperature of the concrete (shown in Figure 20) varied from 14ºC to 18ºC with an average of 15.8ºC with no clear correlation to ambient temperature. The flow had a limiting range of 530 mm to 660 mm. Measured flow shown in Figure 21 had an average of 618 mm. Only two of the 50 test results were greater than the upper limit of 660 mm.
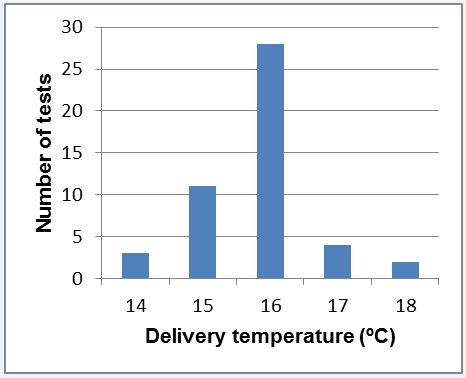
Figure 20 – Variation of concrete delivery temperature 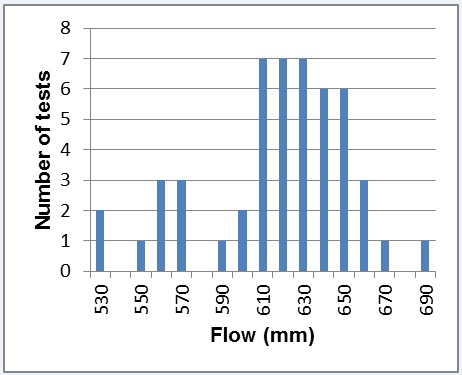
Figure 21 – Variation of measured concrete flow at delivery The only causes for concern were the unseasonably high temperature of 21ºC on the Saturday afternoon and the heavy rain on the Sunday afternoon. Inspection of the concrete surface, when accessible on the Monday showed that the rain had not had any detrimental effects.
The equipment and progress of the pour is illustrated in Figure 22 to Figure 26.
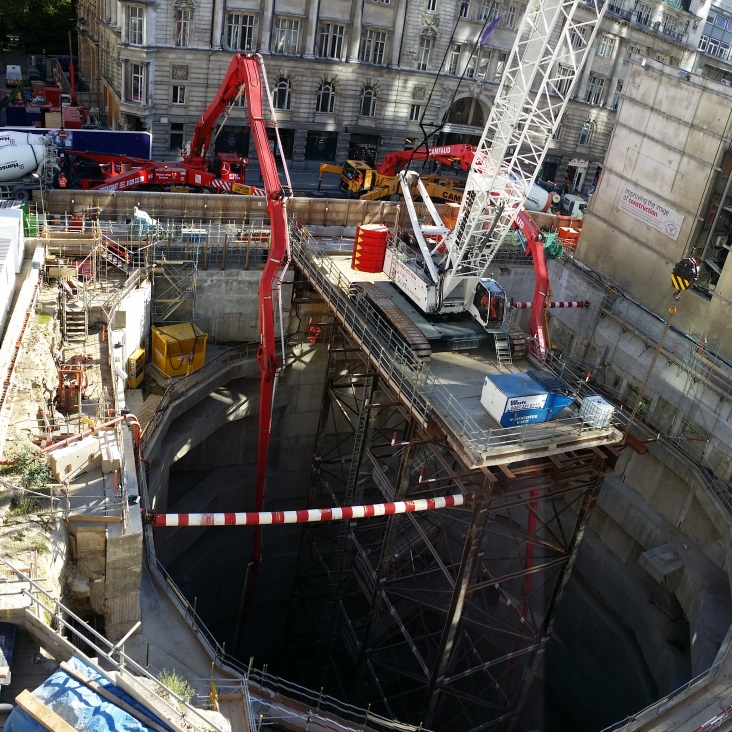
Figure 22 – The two 63m reach pumps on Moorgate 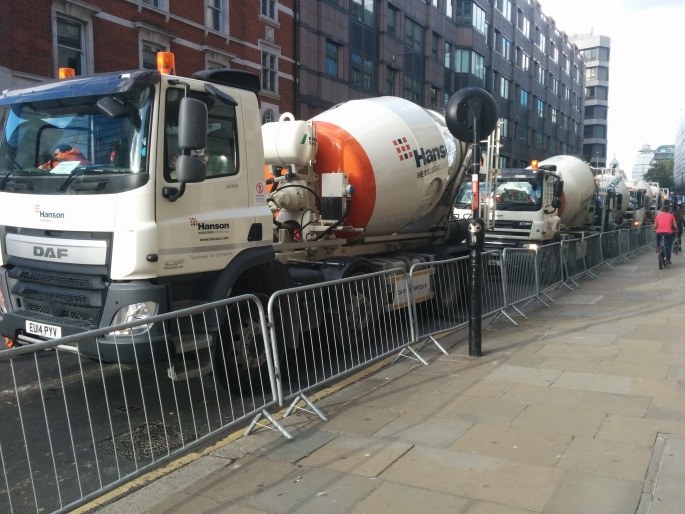
Figure 23 – Wagons marshalled on Moorgate 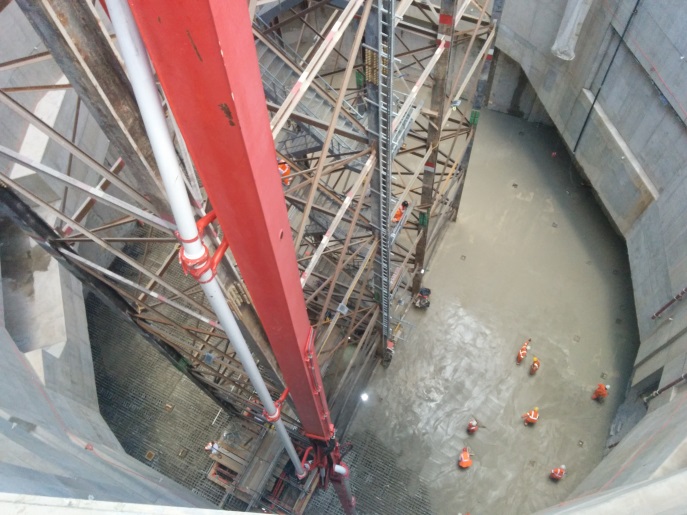
Figure 24 – Nearing completion 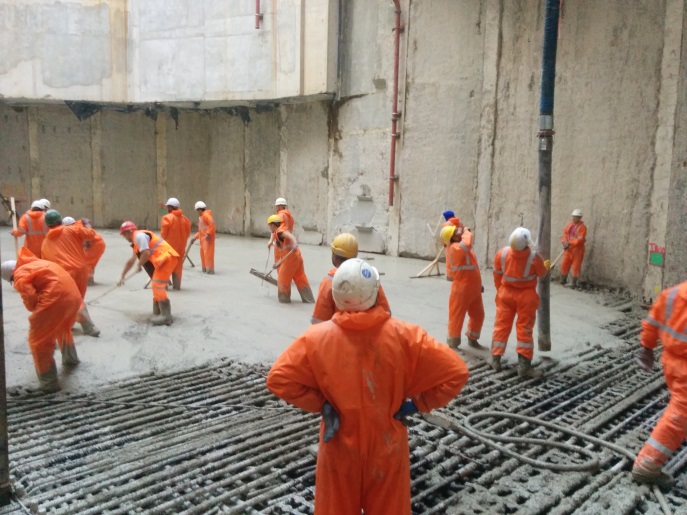
Figure 25 – Finishing works 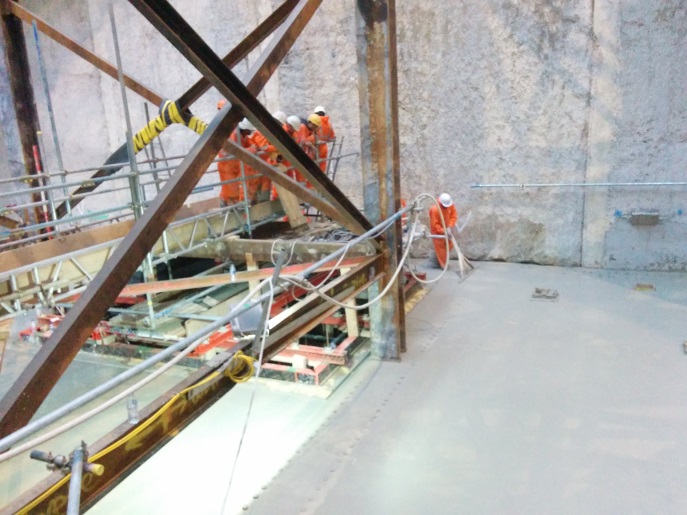
Figure 26 – Last man off Temperature in slab
Temperatures were monitored after the concrete pour. The concrete temperature when poured varied between 15ºC and 23ºC. As the predicted maximum temperature was based on a maximum delivery temperature of 25ºC, with the low ambient temperatures in the first week there was no cause for any contingency measures. The predicted temperature shown in Figure 27 is based on the average as placed concrete temperature of 15.8ºC.
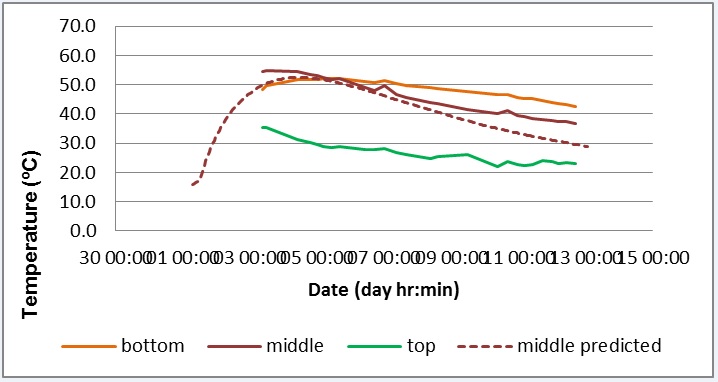
Figure 27 – Actual and predicted temperature in slab The initial fall in temperature is estimated accurately, but after about five days there is a significant divergence between measured and predicted. The differential temperature, shown in Figure 28, was underestimated, but the time of the maximum differential temperature was accurately predicted.
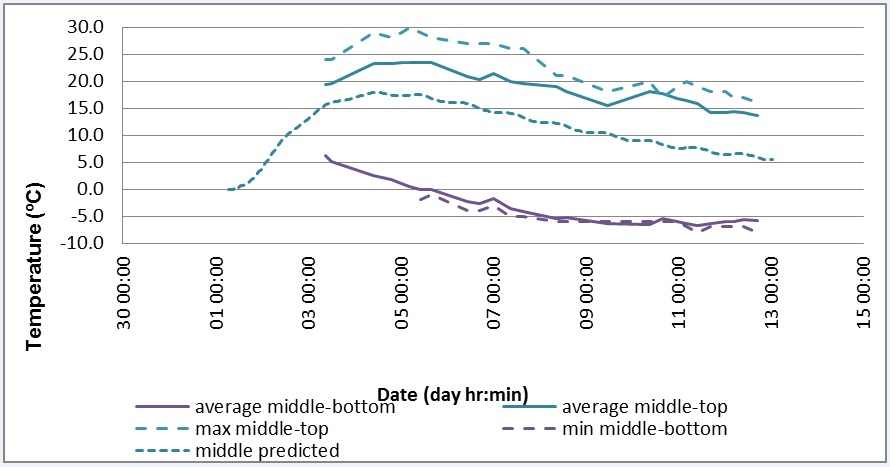
Figure 28 – Actual and predicted differential temperature in slab The development over time of temperature profile through the slab is shown in Figure 29.
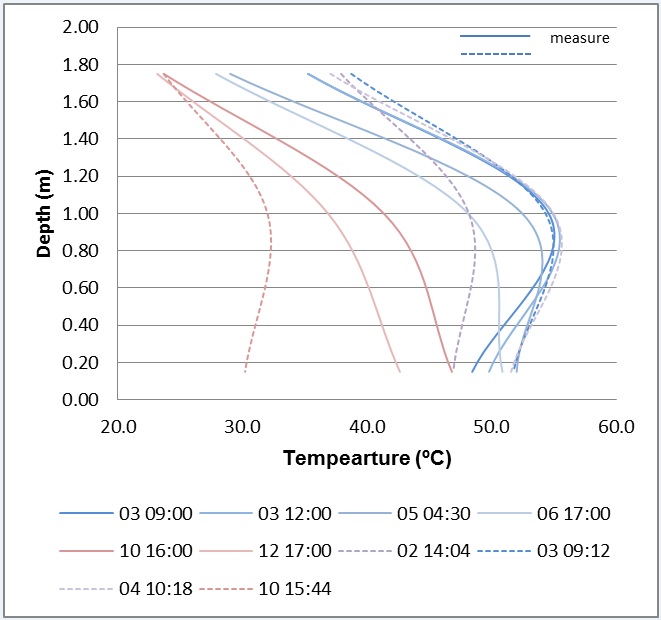
Figure 29 – Actual and predicted temperature profile in slab Initially the measured and predicted profiles are similar, but after 4 days they have diverged with the bottom temperature remaining much higher than predicted. At 10 days, although the surface temperature is similar to the predicted, the peak and bottom temperatures are significantly higher than predicted.
Cube tests
Cubes were taken for concrete strength compliance from each 100 m3 of concrete delivered. These were tested at 7 days and 28 days under standard test conditions as the trial mix had indicated that testing at 56 days was not required.
The follow on works in the shaft could not start until the slab concrete had reached 30 MPa design strength. This was expected to be achieved with the seven day cubes. The results of the seven day cubes are shown in Figure 30.
The average of the first six cubes was less than required. However, two of the lowest strength cubes were sampled late on Friday and therefore tested at slightly less than seven days. These were in the bottom layer of the pour and remote from where the follow on contractor wished to start work. In practice the follow on works did not start until late on Saturday and the work did not significantly load the slab until early the following week so there were no concerns over the strength. The results were slightly lower than the trial mix which is possibly due to adjustments in the dose of retarder.
The 28 day cube test results are summarised in Figure 31. These show that the design strength of 45 MPa is exceeded. Due to a single low test result the characteristic strength of the results is 53 MPa, that is 4 MPa more than the lowest result in accordance with BS EN 206.
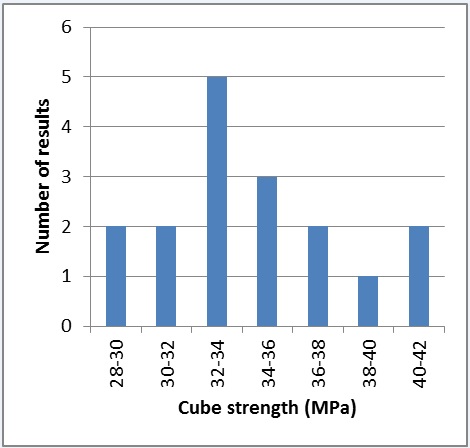
Figure 30 – Concrete cube strength tests at 7 days 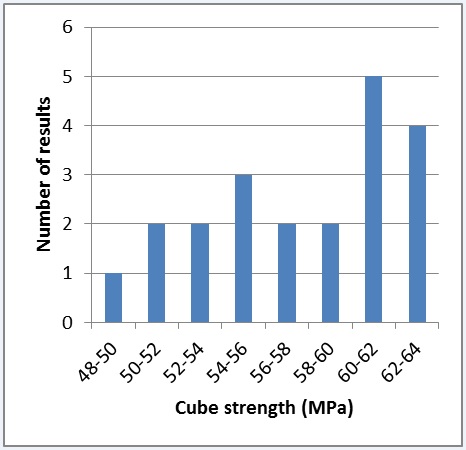
Figure 31 – Concrete cube strength tests at 28 days Conclusion
The temperature monitoring of the slab gave the project team confidence that a watertight concrete slab has been achieved within the specified parameters. Temperature prediction gave mixed results. When significant heat is being generated by the setting concrete the CIRIA Guide C660 spreadsheet matches the measured temperature accurately, but during the cooling phase this is not the case, and is attributed to the slab being cast onto a well insulated base. The peak concrete temperature is accurately predicted and the maximum differential temperature reasonably predicted.
Separating design intent for the reinforcement from the detailing by the contractor, although normal practice for buildings, was difficult to manage for this heavy civil engineering work.
Colour coding of the reinforcement drawings was effective and the 3d modelling essential in places to avoid clashes, define the construction sequence and avoid gaps in the reinforcement.
Outline design of temporary works supporting the heavy weight of top reinforcement and appropriate assessment of the construction loads was required to specify the required working strength of the void former and therefore the collapse load used in the design of the slab.
Careful planning of the concrete pour from reinforcement detailing through to road closures to give access to a constrained site in the heart of the City of London, the contingency measures for disrupted concrete supply and the control of concrete temperature led to the successful execution of what was at that time Crossrail’s largest concrete pour..
References
Bamforth, P. B., 2007. Early-age thermal crack control in concrete (C660), London: CIRIA.
BSI, 2004. Eurocode 7: Geotechnical design – Part 1: General rules (BS EN 1997-1). London: BSI.
BSI, 2005. Eurocode 1 – Actions on structures, Part 1-6: General actions – Actions during execution (BS EN 1991-1-6). London: BSI.
BSI, 2006. Concrete – Complementary British Standard to BS EN 206-1 – Part 1: Method of specifying and guidance for the specifier (BS 8500). London: BSI.
BSI, 2006. Eurocode 2 – Design of concrete structures – Part 3: Liquid retaining and containment structures (BS EN 1992-3). London: BSI.
BSI, 2009. Executaion of concrete structures (BS EN 13670). London: BSI.
The Concrete Centre, 2011. Specifying Sustainable Concrete, Understanding the role of constituent materials. Camberly: mpa.
-
Authors

Adrian Douglas Eur Ing, MEng CEng MICE - Mott MacDonald
Principal Engineer
M Smith BSc(Hons) - BAM Nuttall Kier
Construction Manager
J Hunter BEng(Hons) CEng MICE - Crossrail Ltd
Site Manager
