Observations of tunnelling effects on a large diameter jointed concrete pipe on Crossrail Contract C310 at North Woolwich, Newham, London.
Document
type: Technical Paper
Author:
Alex Liew, ICE Publishing
Publication
Date: 31/08/2016
-
Read the full document
Notation
D is the tunnel diameter ɛaxial is non flexural axial strain due to ground movements ɛflex is flexural strain along pipe length Lp i is the standard deviation of the curve / transverse distance from the tunnel centre line to the point of inflexion of the Gaussian distribution curve K is a parameter to determine trough width / “trough width parameter” Lo is the initial slice length / spacing between nodes Li is distance between nodes after ground movement mATD Meters Above Tunnel Datum (100 mATD corresponds to 0 mAOD) ρ is the radius of curvature, estimated as Lp / sin2α. See Figure 6. RF is a strain reduction factor after Attewell et al (1986)[1], See Figure 5. This is introduced to allow for slippage between the pipe and ground. S is settlement at transverse distance y from the tunnel centre line Smax is the maximum settlement above the tunnel centre line (y = 0). TBM Tunnel Boring Machine VL is the tunnelling volume loss expressed as a ratio of the of bored tunnel area y is the transverse distance from the tunnel centre line ypipe is the lever arm of the pipe cross section z Is the depth of tunnel axis level to an arbitrary level z0 Is the depth from surface level to the tunnel axis Introduction
The Crossrail ‘Drive H’ Thames Tunnels comprise twin bored tunnels between Plumstead and North Woolwich, in east London (see Figure 1). Each tunnel is approximately 2.6 km long (constituting 5.2 km of constructed tunnels) and crosses under the River Thames. Two slurry shield tunnel boring machines (TBM) with an external diameter of 7.1m were driven westwards in stages from Plumstead Portal, passing through Woolwich Station approximately midway along the route. The 6.2 m internal diameter tunnels were constructed using 300 mm thick precast concrete segmental linings. The construction of the tunnels, including both entry and exit portals, was carried out under Contract C310 by Hochtief Murphy Joint Venture (HMJV).
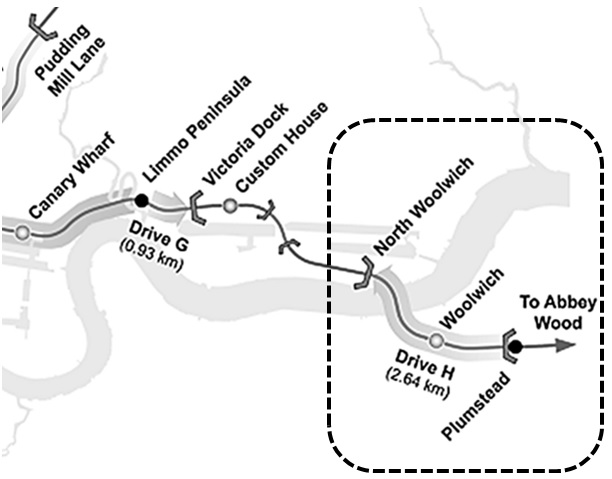
Figure 1 – Contract C310 Thames Tunnel Geological profile
The ground conditions along the route generally comprised a succession of Alluvium, River Terrace Deposits and Thanet Sand underlain by Chalk. Thanet Sand was only present south of the River Thames, see Figure 2. Groundwater level was generally within 1 m of 100 mATD, with up to 3 m of tidally influenced variations observed close to the river. The tunnels were largely excavated in Chalk with superficial deposits encountered at shallower depths at the two ends of the route.
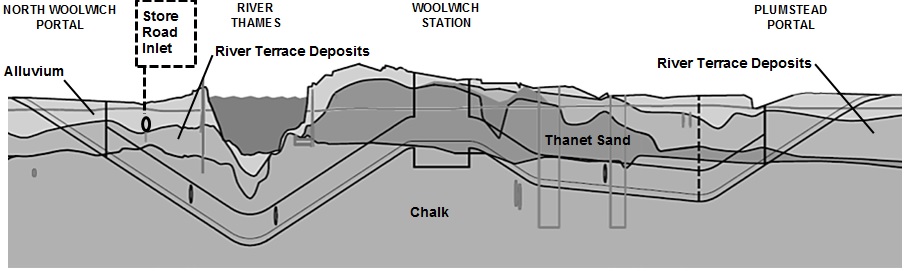
Figure 2 – Geological long section Store Road Inlet
The Store Road Inlet is a new large diameter concrete pipe located at the western end of Drive H, approximately 200 m east of North Woolwich Portal, see Figure 3. It is one of two major inlets which outfalls into the Store Road Pumping Station. The new Inlet is a 2.4 m internal diameter Class 144 concrete pipe 18.6 m in length (excluding connecting chambers). It comprises eight 2.4 m long precast segments with 220 mm wall thickness. A previous inlet at the same location was demolished to enable the removal of a buried sheet piled cofferdam. The cofferdam left behind from the previous construction works would have posed as an obstruction to the tunnel construction. The construction of the new Store Road Inlet and concurrent removal of the sheet piles were carried out as part of Contract C310. The works were completed in October 2013, 3 months prior to the arrival of the first TBM.
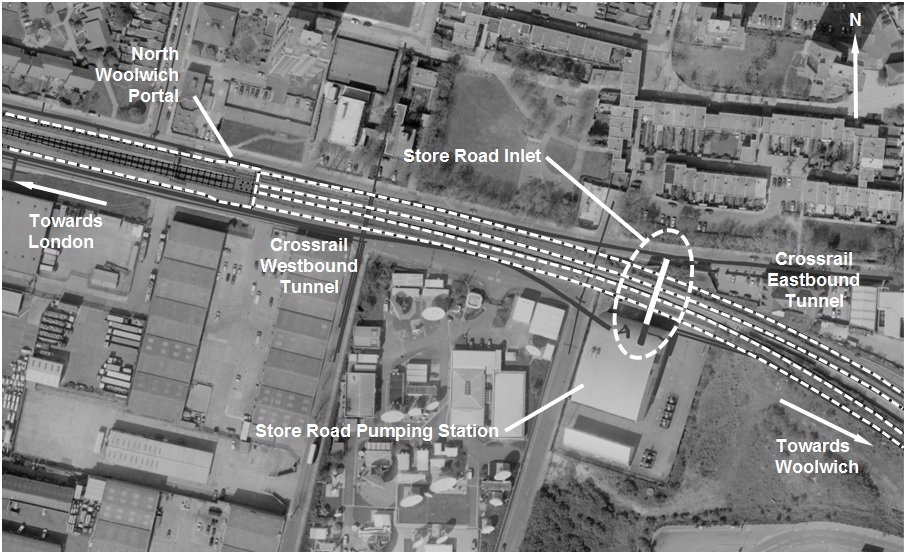
Figure 3 – Location of Store Road Inlet The tunnels are at shallow depth at this location with approximately 10.6 m of cover (depth to tunnel crown). The Inlet sits broadly perpendicular above the tunnels with approximately 4.4m clearance (extrados to extrados), see Figure 4. The ground conditions in the area comprise a sequence of Made Ground, Alluvium, River Terrance Deposits and Chalk and is summarised in Table 1. The ground water level in the vicinity of the Inlet typically varies between 99m ATD and 100 m ATD.
Stratum Depth mATD (thickness m) Description Made Ground / Alluvium 101 – 94 mATD
(7m)
Peaty organic Clay River Terrace Deposits 94 – 91 mATD
(3m)
Well graded clayey silty Sand and Gravel Chalk 91 mATD – depth (Within the tunnel face) Structureless Chalk to Chalk Grades C4 to B2 (Haven Brow Beds) Table 1 – Summary of ground conditions
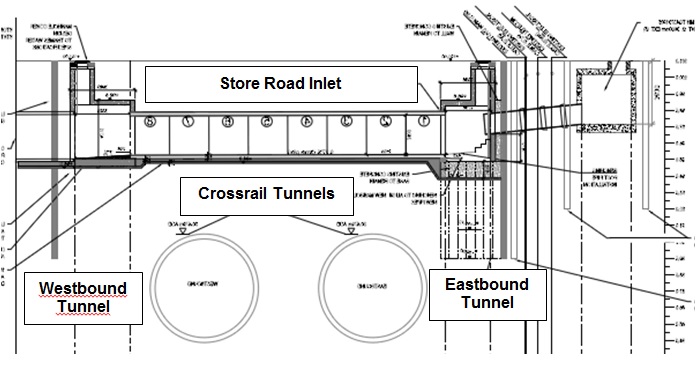
Figure 4 – Crossrail tunnels and the Store Road Inlet Tunnelling ground movements
Ground movement due to tunnelling, its origin and prediction, is well established and documented. Tunnelling ground movements arise due to an over excavation of the tunnel bore in comparison to the final tunnel size. This results in a ‘volume loss’ and radial ground movements towards the tunnel cavity. Transverse surface settlement troughs can be represented by a Gaussian distribution curve as proposed by Peck (1969)[10]. The estimation of ground movements near the surface using a the Gaussian function is described by O’Reilly and New (1982)[9] as,
S = Smax exp (-y2 / 2i2) (1)
Smax is the maximum settlement above the tunnel centre line which can be obtained by integrating Eqn. (1) and equating it to the area of ‘loss ground’ which can be simplified as
Smax = 0.313 VLD2 / π i (2)
Where
S is settlement at transverse distance y from the tunnel centre line Smax is the maximum settlement above the tunnel centre line (y = 0). y is the transverse distance from the tunnel centre line i is the standard deviation of the curve / transverse distance from the tunnel centre line to the point of inflexion of the Gaussian distribution curve VL is the tunnelling volume loss expressed as a ratio of the of bored tunnel area D is the tunnel diameter O’Reilly and New (1982)[9] suggest that the value of i provides a means of defining the width of the settlement trough where i can be expressed as,
i = K z0 (3)
Where
K is a parameter to determine trough width / “trough width parameter” z0 is the depth from surface level to the tunnel axis The value of K can range between 0.3 – 0.7, with the lower and upper bound values typically associated with granular and cohesive type soils respectively. The typical benchmark for the K value is 0.5 for moderately stiff clay. Various approaches to refine the K value are available, including modifications to take into account stratified ground conditions such as that proposed by Mair et al (1993)[7].
Similarly, studies have since been carried into subsurface ground movement. These introduce refinements to the Gaussian function, such as that reported by Mair et al (1993)[7] and New and Bowers (1994)[8] among others. The New and Bowers (1994)[8] approach, also referred to as the ‘ribbon sink’ method, proposes that rather than a point sink at the tunnel axis level, ground losses can be assumed to be distributed uniformly over a horizontal plane equal in width to the tunnel at the tunnel invert level. This approach provides a basis of estimating ground movements close to the tunnel.
The principle of superposition provides a convenient approach of estimating the settlements of a twin tunnel arrangement. The settlements of the first and second tunnel are estimated independently, yielding two settlement profiles. The total settlement from the construction of both tunnels is taken as the summation of the two overlapping settlement profiles. Recent studies, such as that by Addenbrooke and Potts (2001)[1] and Divall et al (2012)[5] have indicated that there is an ‘eccentricity’ to the point of maximum settlement for the second tunnel. It was demonstrated that the settlement profile of the second tunnel can be influenced by the first tunnel, the extent of which is related to the distance between tunnels. This results in an asymmetrical settlement trough about the centreline of the twin tunnels.
For the purpose of assessing tunnelling ground movement parameters, the following approach has been adopted in this paper, 1) surface settlement is after O’Reilly and New (1982)[9], 2) subsurface settlement is after New and Bowers (1994)[8], 3) a constant value K is adopted to determine a best fit settlement curve, 4) in assessing the settlements of twin tunnels, the principle of superposition is used with an adjustment in eccentricity (position of maximum settlement relative to respective tunnel centrelines) to obtain the best fit settlement curve 5) all settlement curves are based on greenfield conditions.
Assessment of buried pipes
An approach to assess the tunnelling impact on utilities was developed for the Crossrail project in consultation with various individual third party asset owners. This approach was based on the method proposed by Attewell et al (1986)[1] and developed by Bracegirdle et al (1996)[3]. The approach was expanded to accommodate the various types of utilities and services, adapted to suit different forms of construction, material type, criticality and size. The particular approach developed for buried jointed pipes, is outlined in the Crossrail Report ‘Damage Assessment of TWUL Wastewater Utilities Over Bored Tunnels – Volume 1’[4] and adopted in this paper to assess pipe behaviour.
The approach considers that a buried pipe deforms to a greenfield ground movement profile from which strains (axial and flexural), joint pullout, and joint rotation are calculated. In summary, the displaced pipe profile is subdivided into multiple slices of fixed lengths. Vertical and horizontal displacements (x, y, z) of nodes at the start and ends of these slices are determined from the ground movement equations described in the previous section. The changes in node displacement then provide a convenient basis for determining the magnitude of pipe deformation. Axial strain is obtained by
ɛaxial = RF (Li – Lo) / Lo (4)
Where
ɛaxial is non flexural axial strain due to ground movements Lo is the initial slice length / spacing between nodes Li is distance between nodes after ground movement RF is a strain reduction factor after Attewell et al (1986)[1], See Figure 5. This is introduced to allow for slippage between the pipe and ground. Assuming a jointed pipe of known segment length, Lp, the strain at distances Lp from an arbitrary point, ɛjoint, is approximated by interpolating between the strains of preceding and following nodes. Joint pull-out is obtained by
Joint pull-out = Lp ɛjoint (5)
Pipe joint rotation is the difference in angle (2α) between two adjacent segments of displaced pipe length Lp as shown in Figure 6.
A simple albeit conservative method of then predicting flexural strain ɛflex, for a particular pipe segment length Lp deforming to a greenfield settlement profile is approximated as follows,
ɛflex = ypipe / ρ (6)
where
ɛflex is flexural strain along pipe length Lp ypipe is the lever arm of the pipe cross section ρ is the radius of curvature, estimated as Lp / sin2α. See Figure 6. The total strain within a particular pipe segment Lp is the sum of axial strain, ɛaxial, and flexural strain, ɛflex.
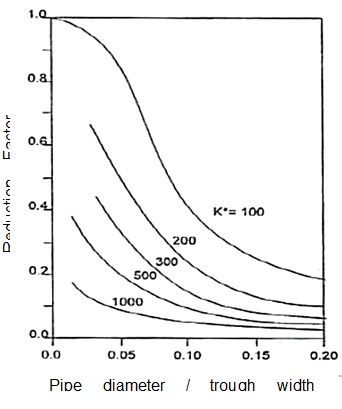
Figure 5 – Reduction factor for transverse pipes after Attewell et al (1986) 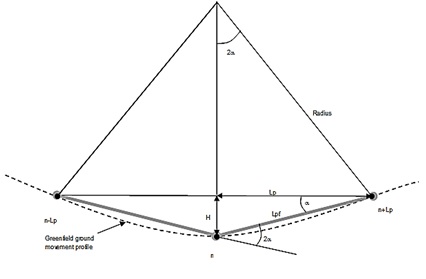
Figure 6 – Idealised joint rotation (2a) between pipe segments along deformed pipe profile Instrumentation and Monitoring
As evident from the previous section, the behaviour of buried pipes subject to tunnelling ground movements is well theorised and presented in numerous publications. Numerical formulations and a detailed parametric study on jointed pipes is presented by Klar et al (2008)[6] which demonstrates the impact of pipe joint configuration and varying soil-pipe stiffnesses. The general consensus is that in reality, there are typically numerous variables and unknowns requiring as many assumptions when attempting to predict the impact of tunnelling on buried pipes.
The construction of the new Inlet as part of contract C310 presented a unique opportunity to instrument and monitor a large diameter jointed pipe under tunnelling ground movements. Case histories of existing buried pipes which have been monitored are rare due to the considerable logistical challenges. The instrumentation and monitoring implemented on this project formed part of the planned mitigation measures during tunnel construction. The instrumentation comprised a system of Vibrating Wire Strain Gauges (VWSG), Shape Accel Array (SAA) and fibre optic strain gauges, Fibre Bragg Gratings (FBG). The monitoring instrument setup is shown on Figure 7.
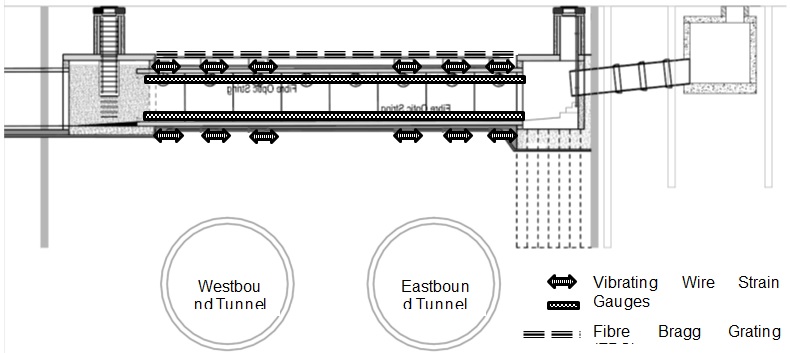
Figure 7 – Store Road Inlet Instrumentation and Monitoring Arrangement Twelve VWSGs were installed externally, six in the tunnel crown and invert respectively. The VWSGs were located at the mid-span of three consecutive segments above each of the individual tunnels. Due to logistical constraints, the positions of the VWSGs were offset slightly from the Inlet centre line both at the crown and invert. A 20 m long SAA chain was installed externally over the Inlet crown. Two 20 m long arrays of FBGs were installed internally at the Inlet crown and invert respectively with individual sensors (within the array) at 1m intervals. In addition to the Inlet instruments, a line of ground levelling studs over the Inlet centreline at 2.5m intervals was also installed.
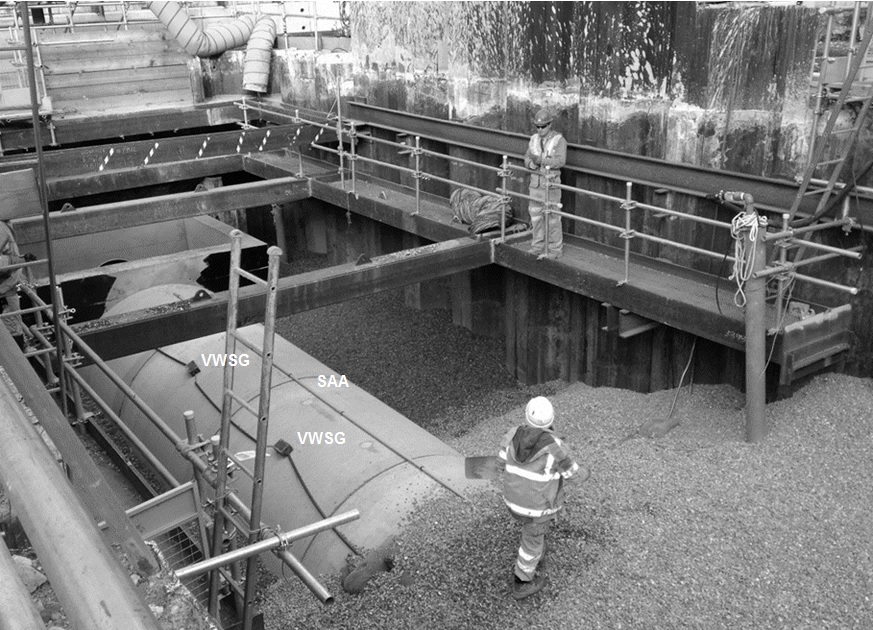
Figure 8 – Backfilling of the Store Road Inlet during construction Monitoring Results and Observations
Tunnelling Ground movement
The westbound tunnel was constructed first, with the TBM underpassing the Store Road Inlet on the 16th of January 2014[1]. The second TBM for the eastbound tunnel construction underpassed four months later on the 1st of May 2014. In general, the maximum observed settlements over this section of the route ranged between 10 and 15 mm. At the design stage, the risk of excessive settlements and volume loss was considered to be high due to potentially difficult ground conditions and shallow tunnel depth. The low settlements and corresponding low tunnelling volume losses are attributed to the excellent performance of the slurry shield TBMs and well controlled excavation and tunnel construction.
The monitoring results of the tunnelling ground movements at surface level and Inlet crown level are shown in Figure 9 and 10 respectively. The tunnels were 14.1 m below ground, with the surface transect being at an equivalent of 2 D (two multiples of tunnel diameter) above tunnel axis level. The SAA (Inlet crown) level was at 3.5 m below ground level, corresponding to 1.45 D. Three sets of settlement data are presented for each of the tunnels and total settlements from both. Curve-fitting was carried out for the individual tunnel settlements while the best fit total settlement curve was a superposition from both. This is also indicated in Figures 9 and 10.
Curve fitting after O’Reilly and New (1982)[9] provides a good correlation against monitored settlements at surface level, see Figure 9. The maximum monitored settlements, Smax, for the westbound and eastbound tunnels were 9 mm and 5 mm respectively with a maximum total settlement of 12 mm. The estimated volume loss from construction of the first tunnel is 0.32%. In comparison, volume loss from the second tunnel was considerably lower, by almost half at 0.165%. The derived trough width parameter K, was 0.4 for the first tunnel and 0.39 for the second. The eccentricity of Smax for the second tunnel is approximately 3 m from its centreline towards the first tunnel. This results in a similar shift of maximum total settlement from the alignment centre line of the twin tunnels.
Similar ground movement trends were observed at subsurface level for both tunnels. Smax for the first, second and combined settlements were 9.6 mm, 4.7 mm and 11.8 mm respectively. Settlement trough profiles derived after New and Bowers (1994)[8], provide the best correlation against monitored data. Based on this, the estimated volume loss for the first and second tunnel are 0.34% and 0.17% respectively with corresponding K values of 0.38 and 0.4. Similarly, the volume loss from the second tunnel is approximately half that of the first and a similar offset of Smax for the second tunnel was observed. The eccentricity of Smax for the second tunnel at this depth is 2 m. Table 2 provides a comparative summary of tunnelling ground movement parameters at surface and subsurface level.
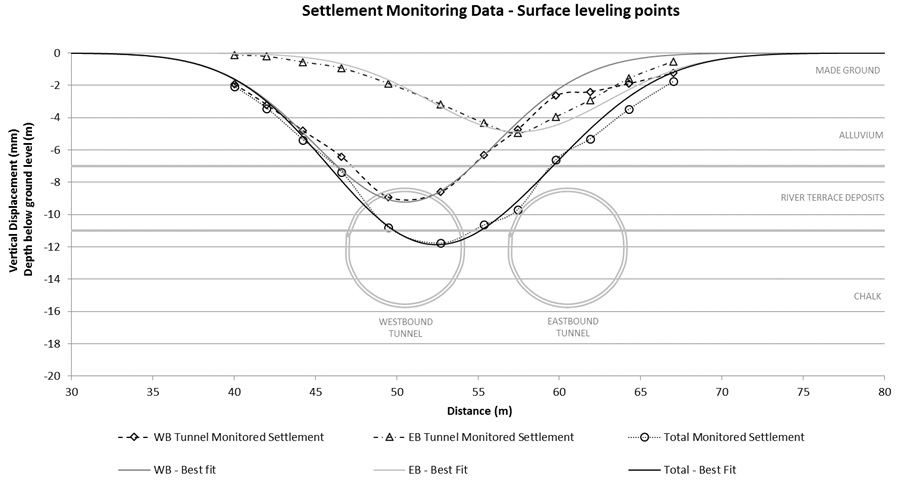
Figure 9 – Monitoring data and transverse settlement trough at surface level 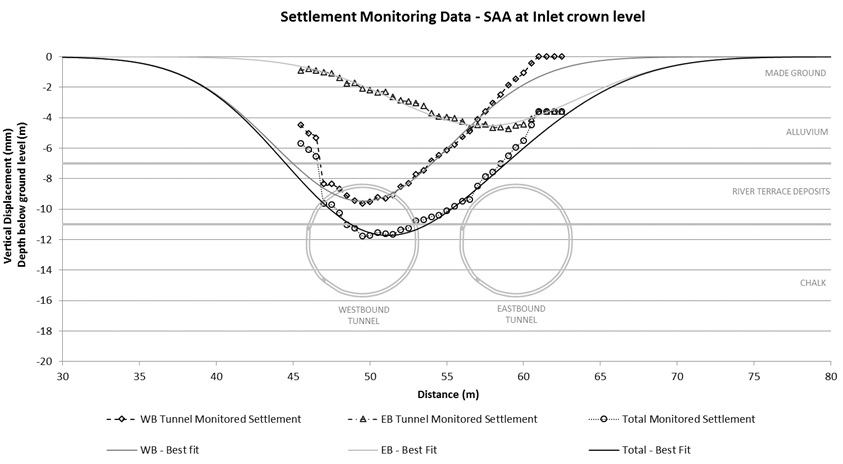
Figure 10 – Monitoring data and transverse settlement trough at Inlet crown level Tunnel Depth1 Ground movement curve Volume loss (%) K Smax eccentricity2 Westbound tunnel 2D O’Reilly and New (1982)[9] 0.32 0.4 0 Westbound tunnel 1.45D New and Bowers (1994)[8], 0.34 0.38 0 Eastbound tunnel 2D O’Reilly and New (1982)[9] 0.165 0.39 3 m Eastbound tunnel 1.45D New and Bowers (1994)[8], 0.17 0.4 2 m 1 Depth refers to distance of monitored line from tunnel axis
2 Eccentrictiy of Smax from tunnel centre line towards first / westbound tunnelTable 2 – Summary of tunnelling ground movement parameters
It is interesting to note that the volume loss of the second tunnel was approximately 50 % lower in comparison to the first. This trend was prevalent along this section of the tunnel drive and is anomalous to the current understanding of twin tunnels constructed side by side. Several publications, including Addenbrooke and Potts (2001)[1] note that an increase in volume losses can be expected for the second tunnel and provide guides of estimating this, largely based on empirical correlations and numerical modelling. Typically, under similar operating parameters and conditions, the volume loss for the second tunnel can be expected to be between 10 to 30 % greater than the first.
The reason for the observed phenomenon is not immediately apparent although there are some potential mitigating circumstances. A generally better advance rate for the second TBM drive was achieved, an average rate of 14.6 m/day[2] in comparison to the 10.5 m/day for the first. Anecdotally, measures to improve recycling and processing of the slurry support fluid were introduced for the second TBM drive. However, there was no actual change (in bentonite content) to the slurry mix design. The effect of secondary grouting was considered, particularly in view of the ground conditions and shallow depth. However there were no notable differences in grout uptake trends for both tunnels. Gains in the tunnelling advance rate perhaps suggest that experience gained from the first tunnel drive enabled efficiencies to be achieved in the second, improving the overall mining and tunnel ring construction processes.
The observed trend in eccentricity of Smax for the second tunnel towards the first tunnel is broadly in agreement with the model suggested by Addenbrooke and Potts (2001)[1]. The magnitude of this eccentricity decreases slightly from 3 m to 2 m with depth. Taking a basic relationship of i = kz, the reduction in eccentricity with depth is intuitive since this corresponds with the reduction in settlement trough width. The associated parameters of these tunnels are at the boundary of the range proposed by Addenbrooke and Potts (2001)[1] and it is not immediately clear if these observations would have fitted within their model.
Monitoring data from the SAA attached externally to the Inlet crown is shown in Figure 10. The settlement plots indicate that the Inlet largely adopts the ground displacement profile with exception at the start and end sections. This observation is compared against strain measurement in the next section. While the Inlet has a high pipe-soil rigidity factor based on Klar et al (2008)[6], its displacement profile indicates that its behaviour tends towards a fully hinged system where there is little joint rotational stiffness. As observed in this instance, the pipe tends towards a greenfield settlement trough. A jointed pipe generally experiences lower bending moments as compared to a continuous pipe or pipes with high joint stiffnesses.
Strain Monitoring
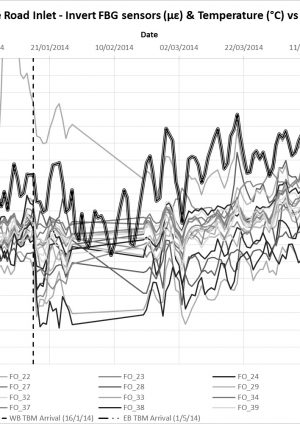
VWSGs and FBGs were installed in the crown and invert of the Inlet to monitor changes in strain[3] as a result of tunnel construction. Monitoring data from the VWSG at the crown and invert level is presented in Figures 11a and 11b respectively. Figures 12a and 12b present similar monitoring data for the FBGs in the same order. The dates of when the first and second TBM underpassed the Inlet are also indicated on the charts. Since the Inlet and all attached sensors are buried, it is considered that ambient temperature remained relatively constant such that variations between the temperature of the sensor and structure are negligible. Therefore, the total strain detected by the sensors is considered to be a product of axial strain arising from external influences (ground movement) and temperature related strain. The average temperature readings obtained from the built in temperature sensors in the VWSGs are plotted alongside strain data on the charts.
The strain profile along the length of the Inlet is provided in Figure 13a for the first TBM passage and Figure 13b for the second. The data is presented in terms of the change in strain, Δ, before and after passage of the TBMs. The variations in temperature over this period were observed to be sufficiently low (±1°C) such that thermal effects are considered to be negligible. As such the total change in strain, Δ, is regarded to be representative of strains induced in the Inlet as a result of ground movements. Both these plots provide clearer picture of strains induced by tunnelling ground movements. ‘Pure’ axial and flexural strains at invert level, calculated based on the methods outline in the earlier section are also plotted to provide a comparison of against theoretical values. A reduction factor, RF=0.1 is applied to the theoretical strain values after Attewell et al (1986)[1].
In general, the changes in strain due to tunnel construction are observed to fully occur within 2 days of TBM passage and tunnel ring construction. There is negligible creep in the strain data beyond this period associated with tunnelling induced ground movements. This compares to, on average, 90% of maximum ground movements within the same period. The development of ground movements was generally observed to occur in its entirety within a week of TBM passage on this contract.
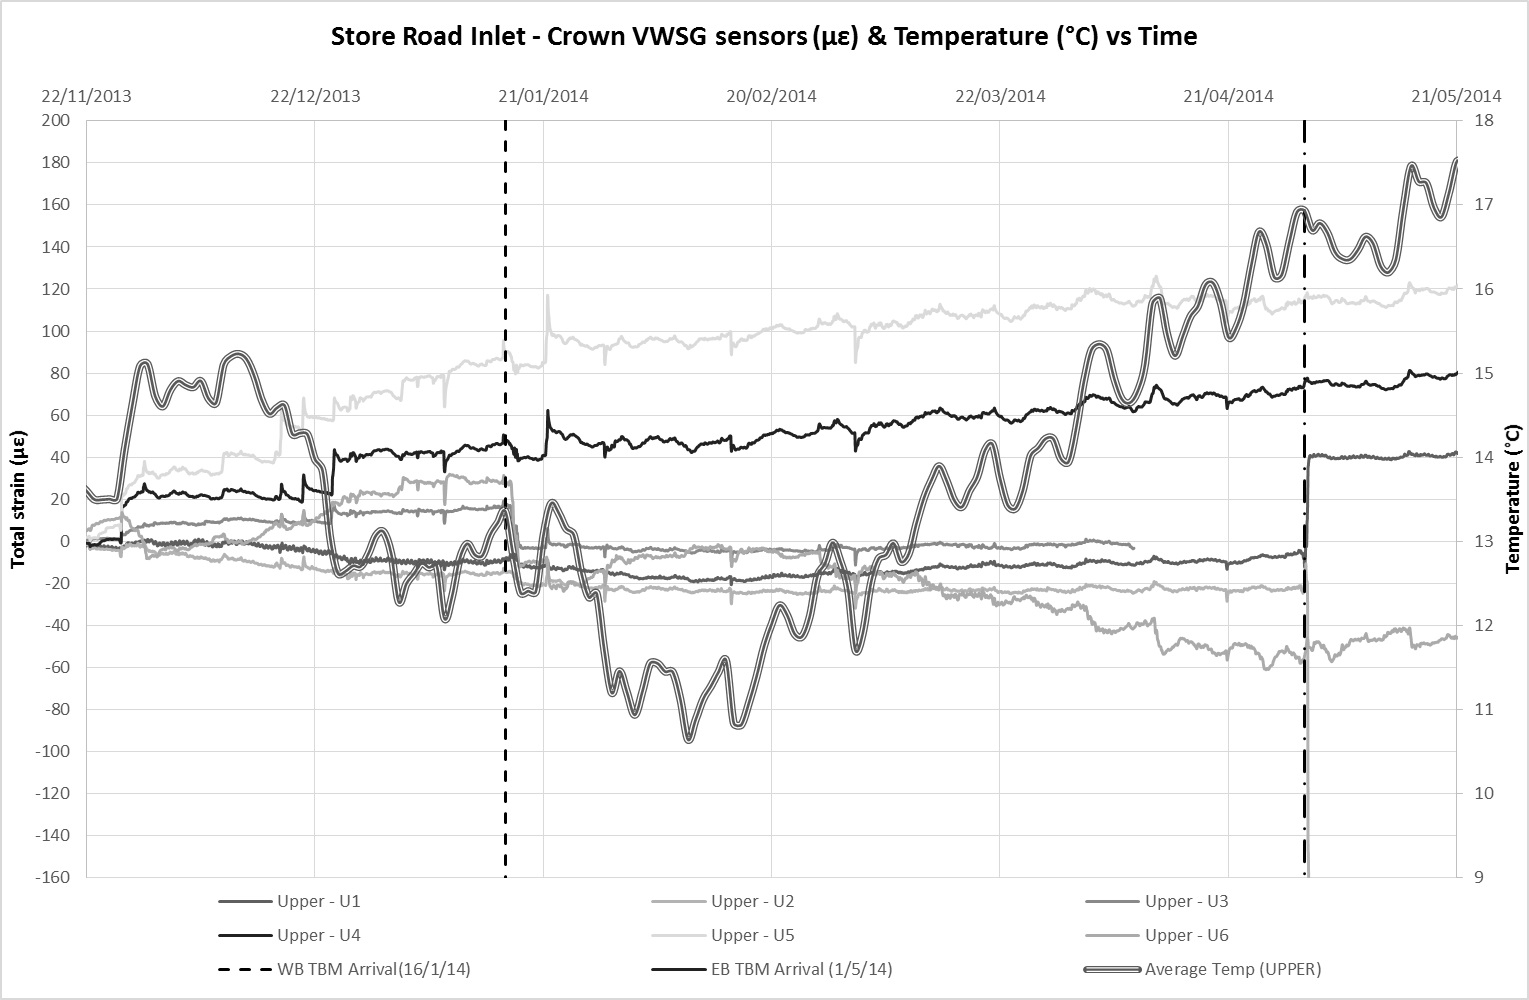
Figure 11a – VWSG with average temperature data at crown level against time 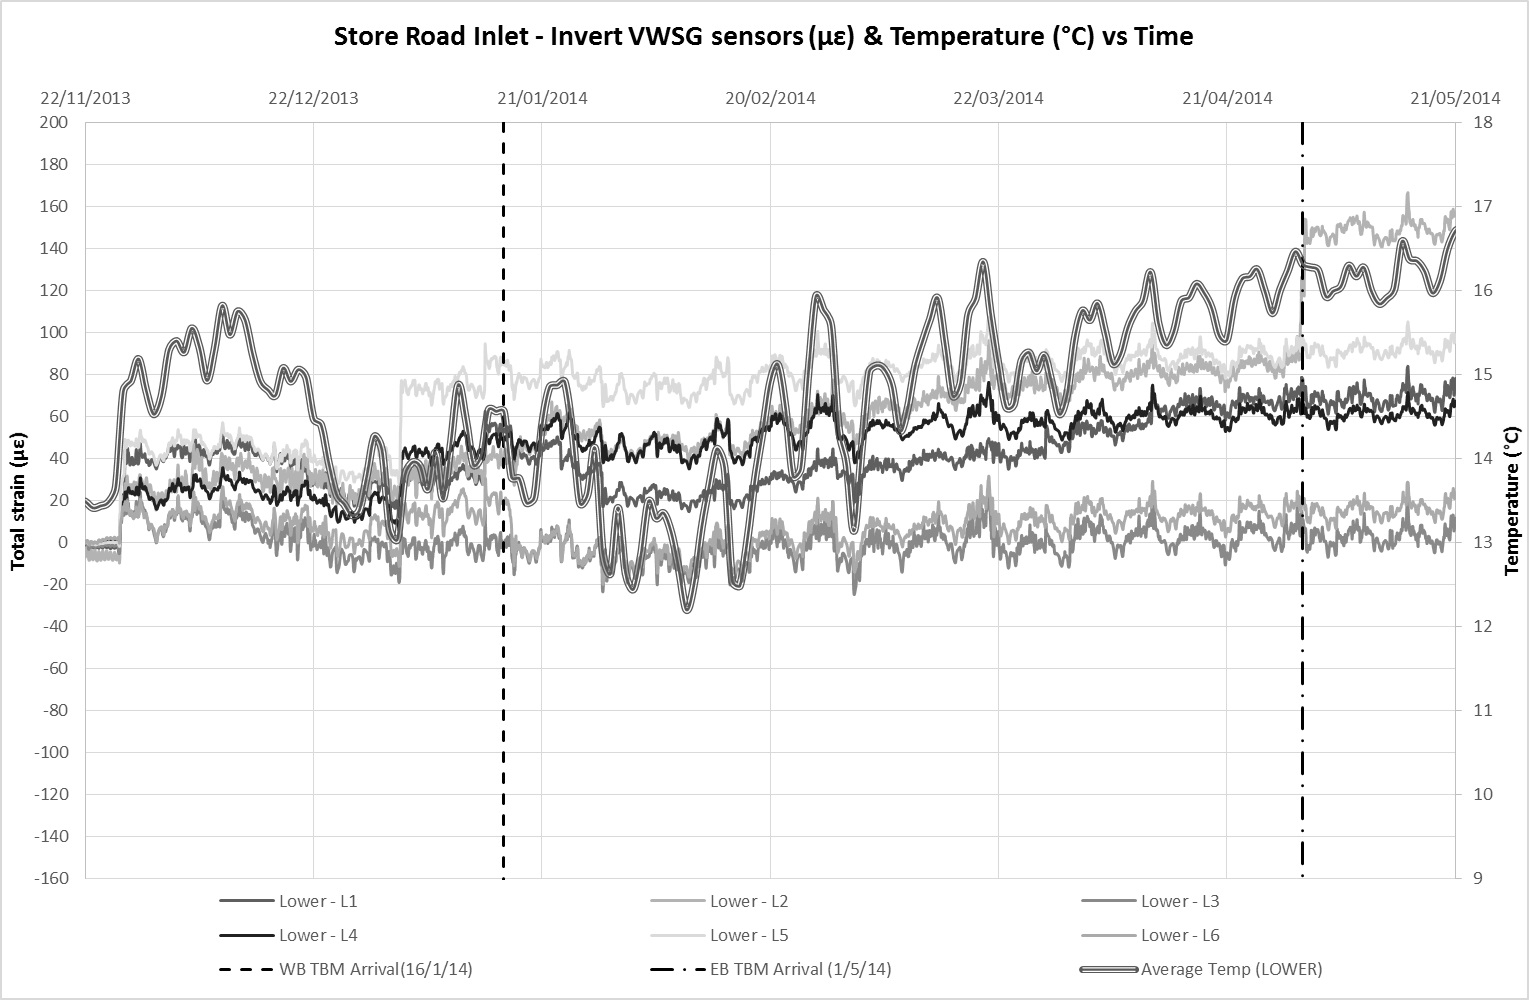
Figure 11b – VWSG with average temperature data at invert level against time 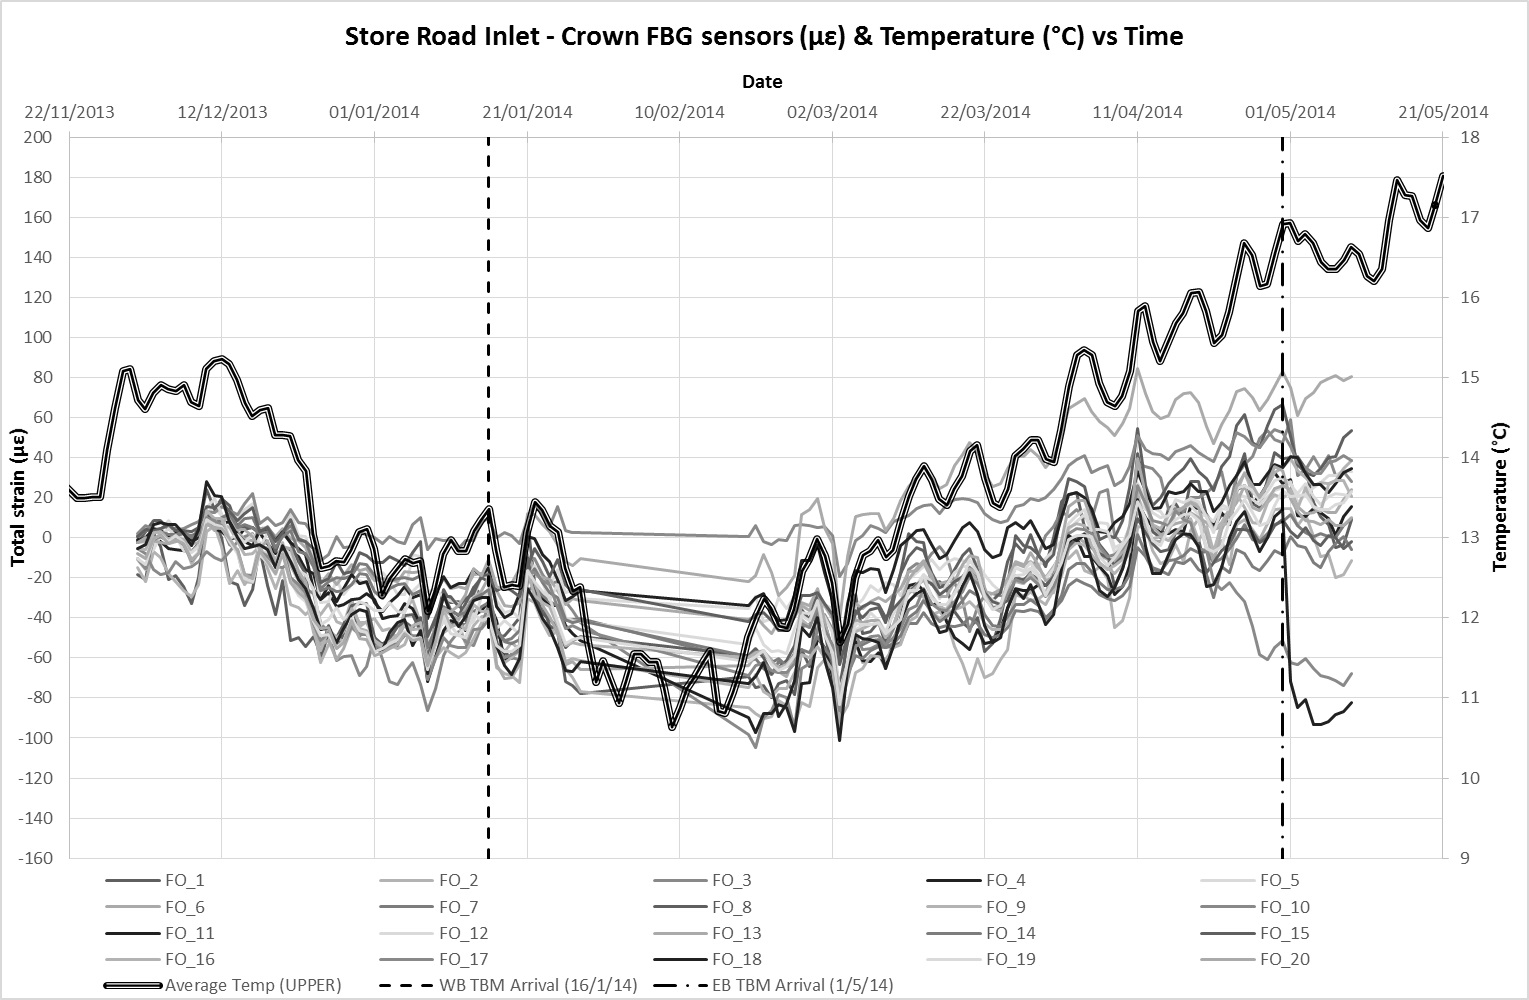
Figure 12a – FBG strain data and average temperature at crown level against time 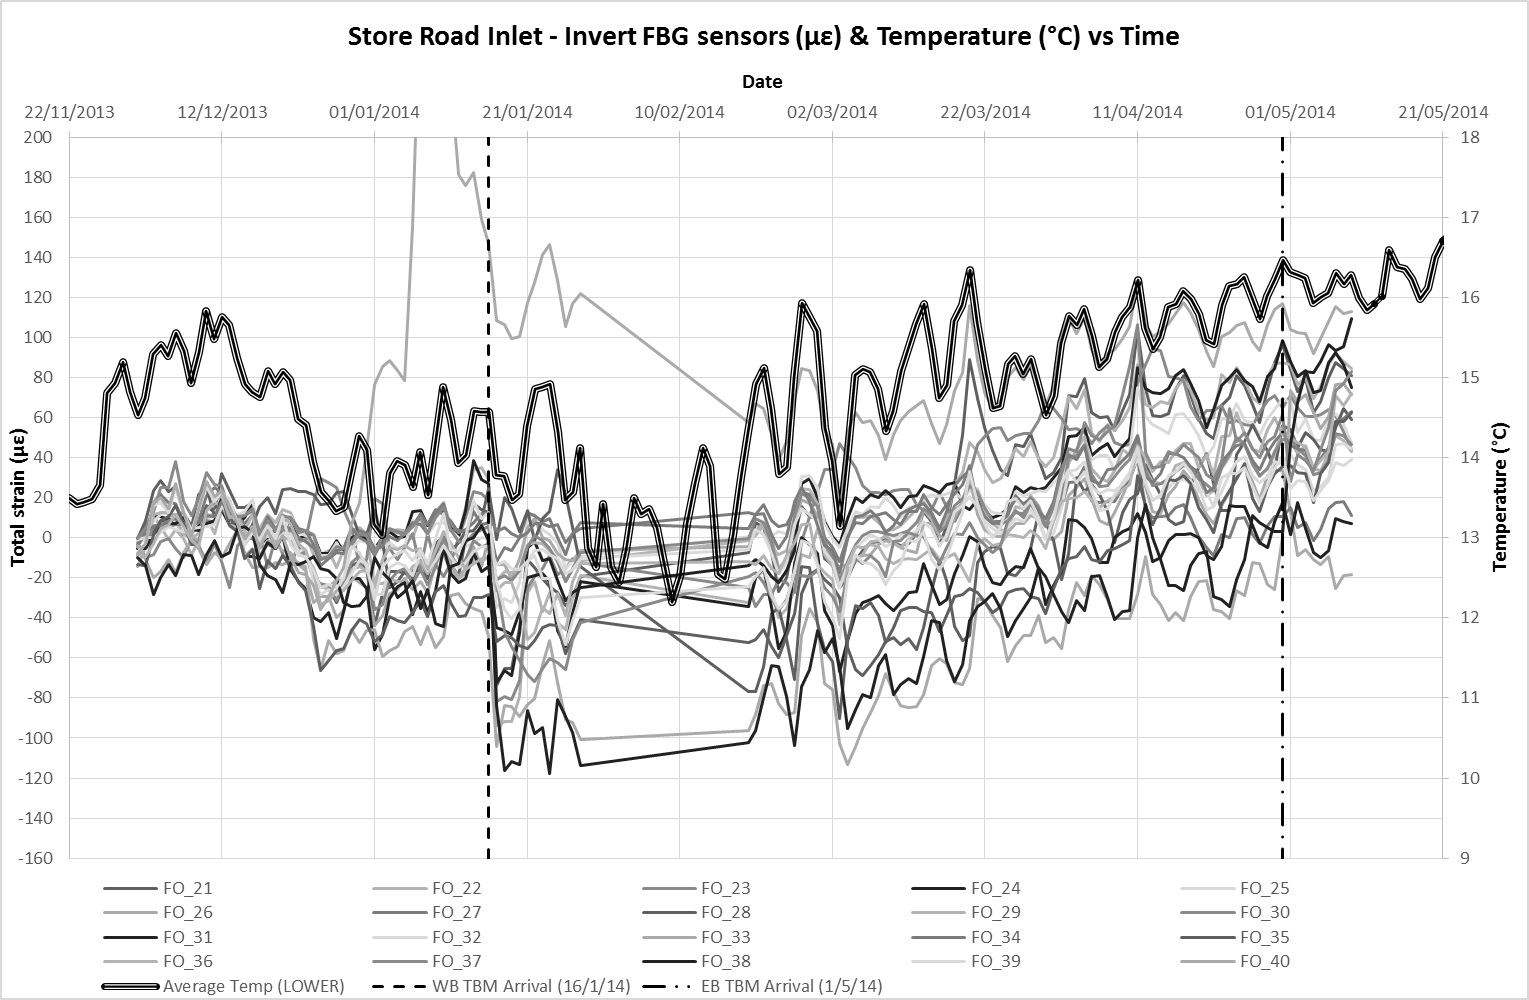
Figure 12b – FBG strain data and average temperature at invert level against time 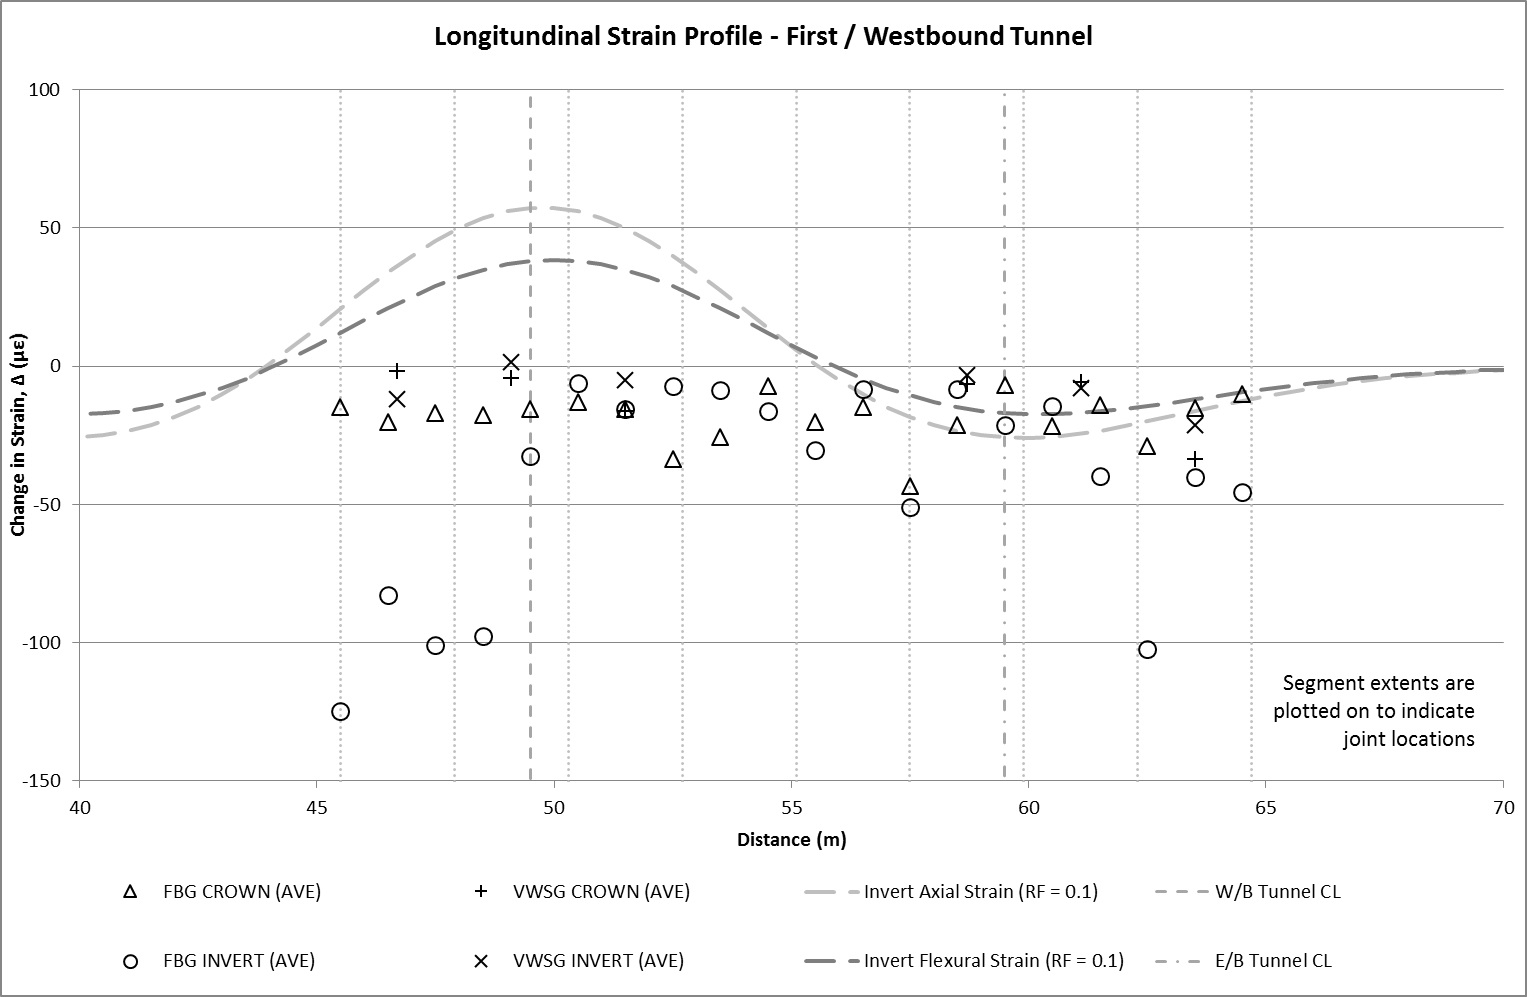
Figure 13a – Longitudinal strain profile after first / westbound tunnel construction 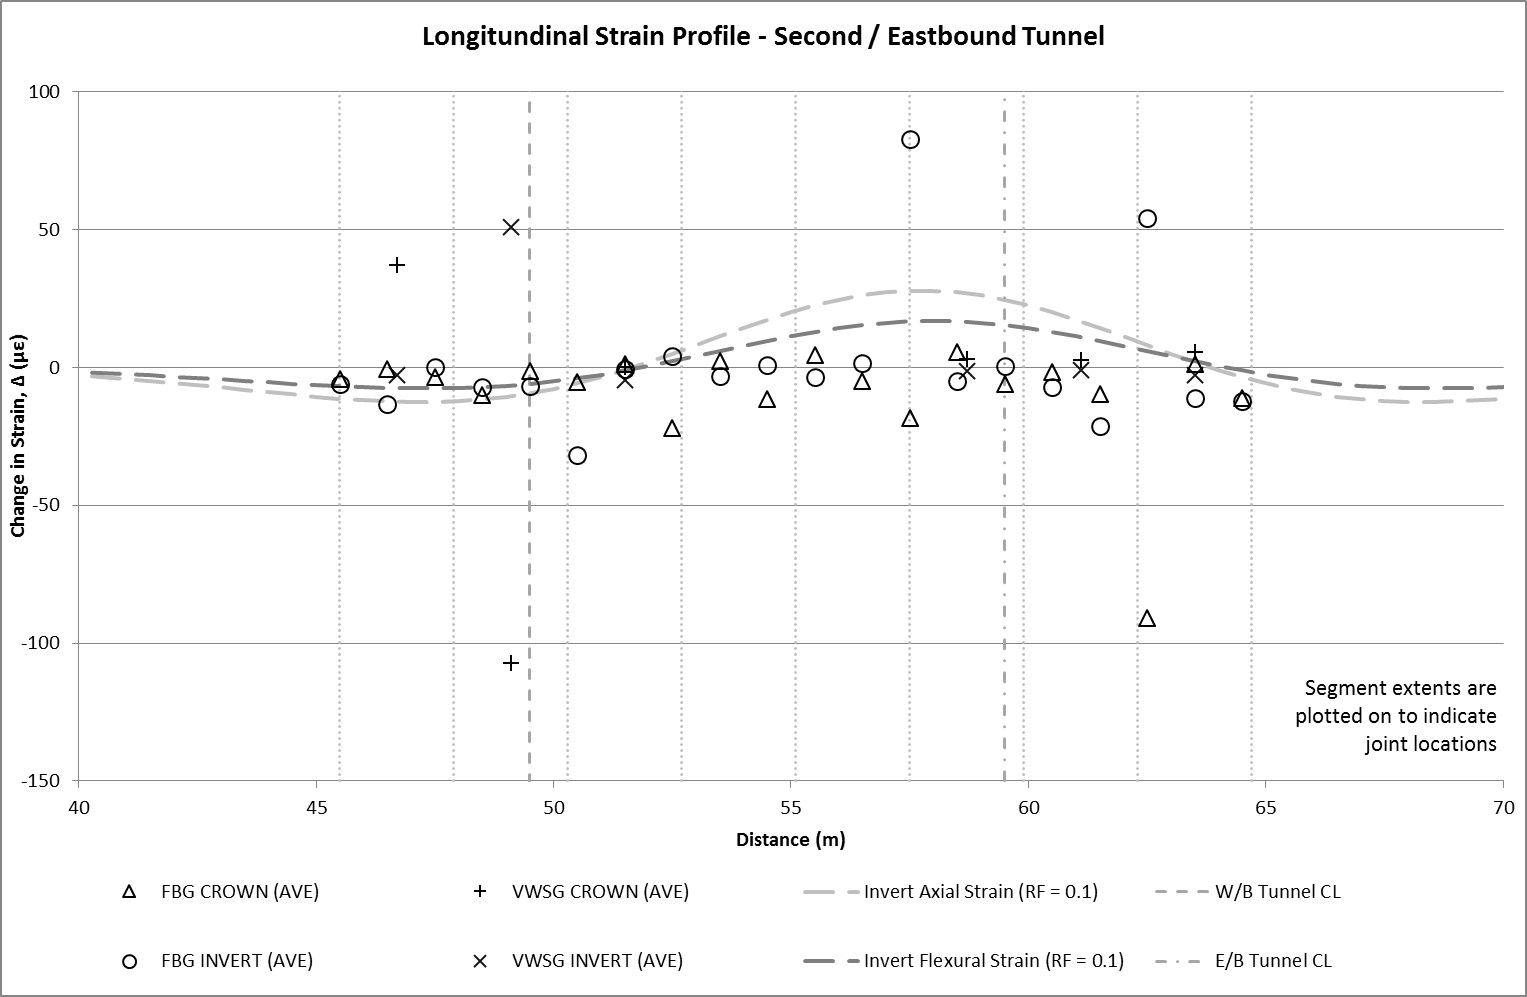
Figure 13b – Longitudinal strain profile after second / eastbound tunnel construction Observations of the Inlet
There is a good correlation between the monitored strains in the FBGs with temperature which were obtained from probes embedded in the VWSG. Movements due to thermal expansion and contraction largely dominate the strain observations with time. Thermal strain correlation is less distinct in the VWSGs data suggesting a higher sensitivity of the FBGS (the VWSGs have not been temperature compensated). Allowing for a coefficient of linear thermal expansion of concrete, α, in the range of 10 – 14 x 10-6/°C, it is estimated that the average overall increase in strain due to tunnelling ground movements at Inlet crown level is approximately 40 µε and 90 µε at invert level. The difference between the two averages suggest an overall ‘sagging’ profile of the Inlet after tunnel construction.
As indicated in Figure 13a, passage of the first / westbound tunnel TBM, appears to induce compressive strains in the Inlet invert. This is particularly evident at the south end of the Inlet where peak strains are observed. This is at the connection of the Inlet to the pumping station chamber and is likely to be attributed to the joint connection. The induced strains at this end is consistent with a clockwise[4] rotation mechanism of the end segment displacing to tunnelling ground movements. There is some apparent fixity/restraint at this end which is evident from the observed Inlet settlement profile (see Figure 10). This has resulted in some compression within the end segment which was detected by both the FBG and VWSG sensors. Compressive strains indicating joint movement were notable at location 57.5m and 62.5m (Figure 13a). While these exceed the theoretical values, it is largely consistent with anticipated behaviour.
The lower volume losses observed for the second TBM are reflected in the broadly lower strains detected by the sensors as shown in Figure 13b. It is interesting to note that due to the eccentricity of the subsurface settlement profile, the point of theoretical maximum tensile strain curve coincides with a joint location at 57.5m. The FBG data indicates peak tensile strains in the invert and compressive strains in the crown. This suggests the two adjacent segments at this node rotating away from each other, roughly at axis level. This is consistent with the anticipated behaviour of the Inlet.
Conclusion
The low settlements and corresponding low tunnelling volume losses are attributed to the excellent performance of the slurry shield TBMs and well controlled excavation and tunnel construction. The volume loss of the second tunnel was approximately 50 % lower in comparison to the first. This trend was prevalent along this section of the tunnel drive and is anomalous to the current understanding of twin tunnels constructed side by side.
Curve fitting after O’Reilly and New (1982)[9] provided a good correlation against surface settlement while the subsurface displacement close to the tunnel were best represented by the New and Bowers (1994)[8] method. An eccentricity to Smax for the second tunnel towards the first was observed which narrowed slightly with depth.
The displacement profile of the Inlet which generally adopted the profile of a greenfield settlement trough indicates that it’s behaviour tends towards a fully hinged system. Although this was the case, the observed axial strains were lower than that predicted, possibly indicating greater horizontal slippage between pipe and soil. This is possibly linked to be due to the high pipe-soil rigidity factor.
The monitoring results of the Inlet demonstrated a natural range of movement and distortion in normal service which was greater than originally anticipated prior to tunnel construction. The variation in transmitted flow is more significant for large diameter pipes as this can impose a substantial fluctuation in loading. In this instance, although the Inlet was impacted by tunnelling ground movements, the influence of thermal movement and service loads on strains were observed be higher.
While the displaced profile of the Inlet can provide a theoretical estimate on the magnitude of the various pipe distortion mechanisms, the observations indicate that its behaviour is as much affected by the particularities of its construction. This can result in a counter-intuitive impact which is greater than that predicted based on conservative models.
More often than not, the criticality of a buried pipe to an asset owner tends to be proportional to its size. The implications of service disruption and the necessary logistics for corrective works to such assets are correspondingly high. Understandably, a conservative risk management approach is favoured since the consequences of failure or disruption to these assets often pose significant costs and disruption, both to the asset owner and the wider public. In instances where the pipeline is subjected to external mechanical distortion, an appropriate analytical approach is essential in determining the impact on pipeline and developing corresponding mitigation measures. However, this is complicated by the fact that the condition of existing buried pipes are often unknown and typically insufficient to inform a detailed assessment of it.
References
[1] Addenbrooke, T.I. and Potts, D.M., (2001). Twin tunnel interaction – surface and subsurface effects. International Journal of Geomechanics, Vol.1, pp. 249-271
[2] Attewell, P.B., Yeates, J., and Selby, A.R. (1986). Soil movements induced by tunnelling and their effects on pipelines and structures. Blackie and Son Ltd.
[3] Bracegirdle, A., Mair, R.J., Nyren, R.J., and Taylor, R.N. (1996). A methodology for evaluating potential damage to cast iron pipes induced by tunnelling. Geotechnical aspects of underground construction in soft ground, Balkema, pp. 659–664.
[4] Contract C122 Arup Atkins Design Team (2011). Damage Assessment of TWUL Wastewater Utilities Over Bored Tunnels – Volume 1 (Document Reference C122-OVE-C4-RST-CRG01-00006). Unpublished
[5] Divall, S., Goodey, R.J. and Taylor, R. N. (2012). Ground movements generated by sequential Twin-tunnelling in over-consolidated clay. Proc. 2nd European Conference on Physical Modelling in Geotechnics 2012, Delft University of Technology, Netherlands.
[6] Klar, A., Marshall, A. M., (2008) Tunnelling effects on jointed pipelines. Canadian Geotechnical Journal. pp.131-139
[7] Mair, R.J., Taylor, R.N. and Bracegirdle, A., (1993). Subsurface settlement profiles above tunnels in clays. Geotechnique, Vol.43, No.2, pp. 315-320.
[8] New B. M., and Bowers K. H. (1994). Ground movement model validation at the Heathrow Express Trial Tunnel. Proc. Tunnelling 1994. I Institution of Mining & Metallurgy. pp. 301-327
[9] O’Reilly M. P. and New B. M. (1982). Settlements above tunnels in the United Kingdom – Their magnitude and prediction. Proc. Tunnelling 1982, Institution of Mining & Metallurgy. pp. 137-181
[10] Peck, R.B., (1969). Deep excavation and tunnelling in soft ground. Proceedings of the 7th International Conference on Soil Mechanics and Foundation Engineering, Mexico City, Vol.3, Balkema. pp. 225-290.
[1] The underpass dates indicated are the dates for when the TBM (cutter face) was directly under the Store Road Inlet. This does not include the extent of influence zones before and after the TBMs.
[2] The rate is the average rate from the TBM launch to breakthrough at the portal and includes planned inspection stoppages, interventions and shut downs.
[3] Sign convention: Positive and negative strain denotes tensile and compressive strain respectively
[4] Based on the orientation of figures presented in this paper
-
Authors

