Observed differences in the behaviour of the London Clay sub-units during SCL works for Bond Street Station and Tottenham Court Road Station (C300/410)
Document
type: Technical Paper
Author:
Shawn Sismondi, BEng FGS, Vicky Potts MA MSc PhD, Wolfgang Weinmar, MSc MEng, ICE Publishing
Publication
Date: 07/09/2015
-
Read the full document
Notation
TCR – Tottenham Court Road
BOS – Bond Street Station
cu – Undrained Shear Strength
GSIR – Geotechnical Section Interpretive Report
Ø – Tunnel Diameter
LCF – London Clay Formation
mATD – Meters Above Track Datum (Ordinance Survey Datum +100m)
MC – Moisture Content
kPa – Kilopascals (1000 pa)
IP – Plasticity Index
RMS – Regular Monitoring SectionIntroduction
BFK (BAM, Ferrovial, Kier joint venture) was awarded Crossrail contracts C300/410 in January 2011, this included 6.4km of twin bore tunnels between Royal Oak Portal and Farringdon, two new underground stations at Bond Street and Tottenham Court Road, a crossover at Fisher Street and six running tunnel cross passages. Donaldson Associates Ltd, in conjunction with IGT, were appointed as Contractor’s SCL Designer.
The Sprayed Concrete Lining (SCL) excavation works at Bond Street and Tottenham Court Road have formed the main focus of this paper. The works have provided an opportunity to observe first-hand the mechanical behaviour of the ground during construction. These observations combined with geotechnical ground investigation information obtained prior to construction and in-tunnel convergence monitoring obtained during construction enable an understanding of mechanics responsible for the observed behaviour.
Each SCL tunnel is formed by excavating sequential advances to an excavation profile and chainage. Advances are excavated in a pre-determined sequence, a typical arrangement is shown in Figure 1. Once completed the face and profile of the excavated advance are sprayed with an initial lining of fibre re-inforced shotcrete, this provides short term support while longitudinal structural joints are prepared, before the primary lining is then applied. This provides support over the lifetime of the construction phase and allows installation of the regulating layer, waterproofing layer and the secondary lining. Together with the primary lining these form the permanent works of the tunnel shell.
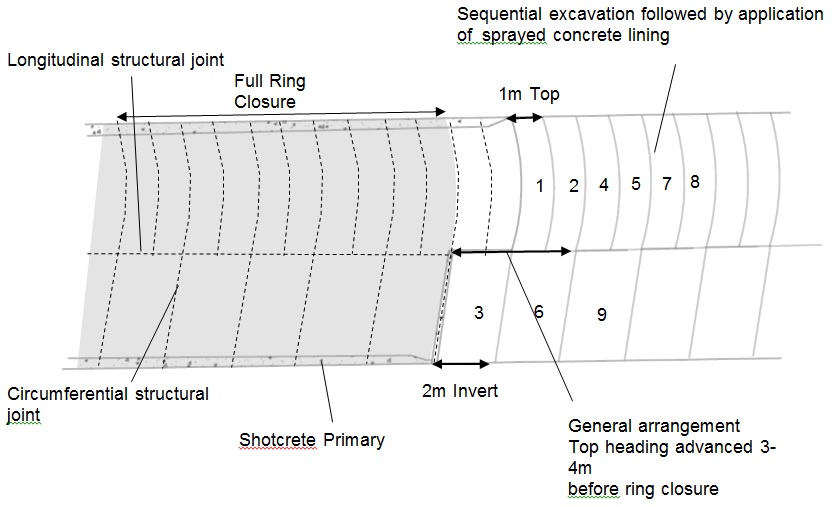
Figure 1 – Typical Excavation Sequence
The risk of failure of the lining due to ground conditions is at its greatest after application of the initial lining. This is also when the risk of injury to the workforce is at its greatest as preparation of joints must be done by hand. It is therefore important that the potential for failure of the ground, leading to failure of the lining is identified and appropriate support measures taken, e.g. installation of appropriate temporary measures or increasing the thickness of the initial lining. The most efficient means of identifying potential areas of instability is to effectively predict and mitigate, for this an understanding of the mechanical behaviour and the factors controlling this behaviour is required.
Regional Geology
The Crossrail project is situated within the London Basin north of river Thames. The London Basin is formed of Cretaceous age Chalk overlain by various deposits from the Palaeogene and Quaternary, a summary of this sequence is shown in Figure 2. The work falls largely within the Eocene deposits, in Particular the London Clay Formation (LCF), as shown in the geological plan and section of the works in Figure 3.
The main geological structures in relation to the tunnel alignment are an anticline structure to the North and a corresponding syncline to the south creating a regional dip of 2° to 5° south south-east within the Palaeogene stratigraphy. A large dome structure has also been identified to the North of Bond Street and Tottenham Court Road.
This regional dip is evident in Figure 4 which shows a contour plot for the base elevation for the LCF between Bond Street (BOS) and Tottenham Court Road (TCR). Generally the trend at both sites is for the strata to follow the regional trend. However at BOS an anticline results in the strata dipping towards an associated syncline situated in the eastern end of the site. This feature could more accurately be described as a minor localised dome which has formed in conjunction with the large dome to the north east. The presence of these dome features may indicate BOS has been subjected to higher tectonic induced stresses.
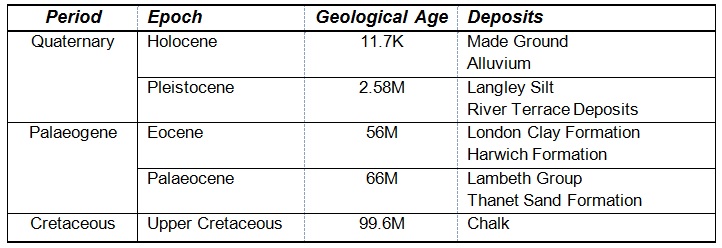
Figure 2 – Simplified Summary of London Basin Stratigraphic Sequence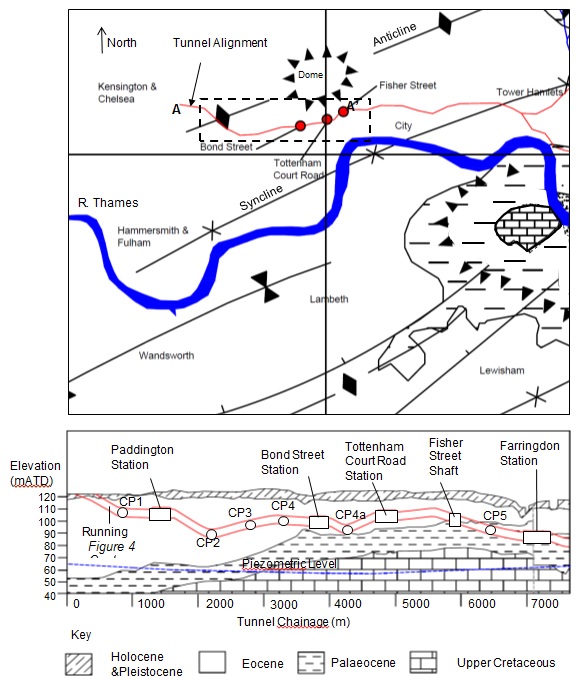
Figure 3 – Simplified Geological Map and Section West to East (based on GSIR)
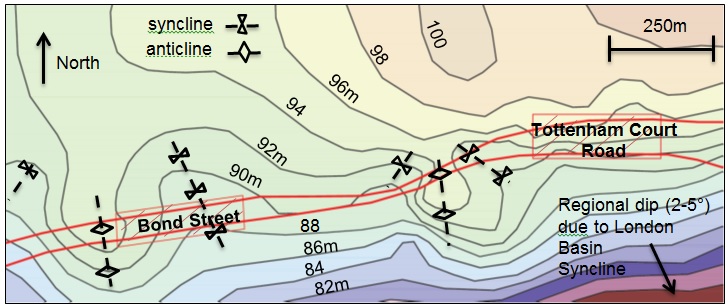
Figure 4 – Contour plot of base elevation of LCFLondon Clay Formation
The London Clay Formation (LCF) was deposited in the London-Hampshire basin during the Eocene 52 to 55 million years ago. Sea level rises, caused by subsidence related to the formation of the Alps, resulted in inundation of the London-Hampshire basin.
At the time the London-Hampshire basin formed a single shallow inner to outer marine shelf basin on the edge of the deep water North Sea basin (Aldiss[1]) . The shoreline was located west of London, this can be observed regionally in a general coarsening up east to west within the LCF sequence. Deposits towards the East represent outer marine with those to the West being inner marine.
King [6] suggested the original thickness of the LCF in central London was between 120 to 130m. Up to 100m of this has been removed by the formation of the River Terrace Gravels during the Pleistocene. Tectonic activity associated with the Alpine orogeny during the Quaternary formed the Weald Anticline creating the Hampshire and London Basins and associated tectonic structures. This combination of unloading and tectonic forces has resulted in a complex stress history and a mechanically over-consolidated clay.
Additionally prior to the 19th Century the London Basin Lower Aquifer, which can be taken to be the lower Palaeocene and Cretaceous deposits, was artesian in nature. Subsequent industrial de-watering has resulted in an under-drained groundwater profile. This is observed in the LCF as an underdeveloped piezometric groundwater profile becoming increasingly sub-hydrostatic towards the base of the LCF.
Stratigraphic Framework
During the Crossrail project the stratigraphic framework for the London Clay Formation (LCF) followed was that proposed by King [6]. The framework is based on a series of coarsening-upwards depositional sequences. Each sequence can be identified by variations in lithology, concretions, fabric, fossils, fauna and laminations which are in part a result of periods of regression followed by transgression.
The depositional sequences were given a designation A to E with A being the basal unit. The works at BOS encountered the bottom three sub-units of King’s sequence, at TCR only the bottom two units were encountered. A summary of the units as encountered is shown in Figure 5.
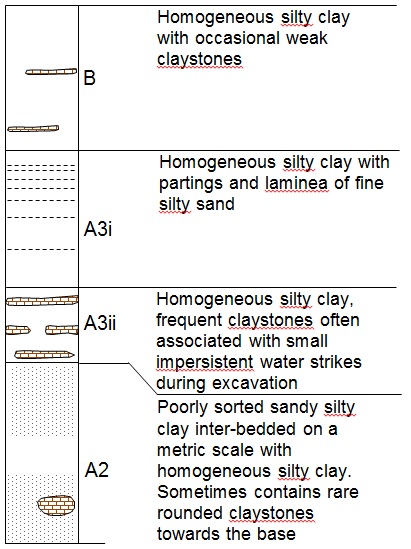
Figure 5 – London Clay Formation Stratigraphy (not to scale)
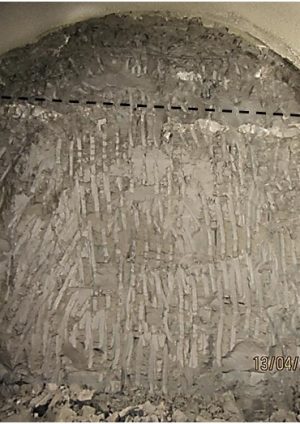
The primary method for discerning the location of works within the stratigraphic sequence was identification of claystone bands within the tunnelling works. These were used to estimate the dip of the strata and the location within the framework described by King. An example of an assumed boundary based on the claystone bands is shown in Figure 6.
Although the boundary between the A2 and A3 is generally recognised as being relatively straightforward to identify, this still requires close observation of the clay fabric, colour and minor constituents. This is not possible in tunnelling works, foremost because of entry restrictions in place near unsupported ground. While it is recognised that the use of claystones as a marker bed is not accurate to a millimetre scale the correlation provided between existing borehole data and data collected during pre-tunnelling construction works (probe drilling, piles, D-walls, box excavation records) suggest this method was fit for purpose.
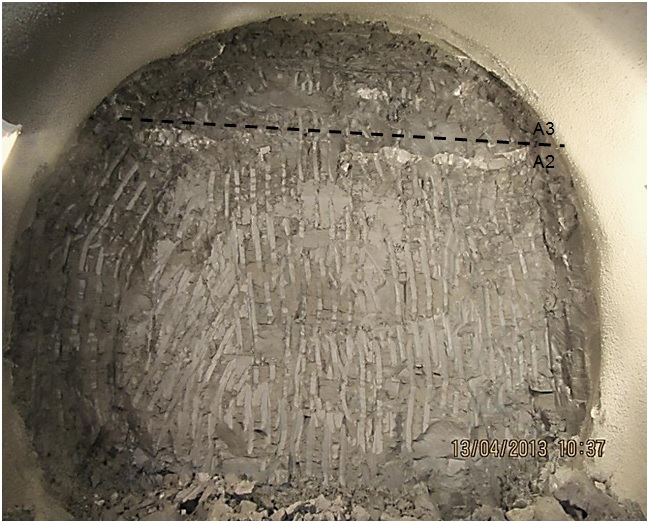
Figure 6 – Example of claystone boundary
Structural Discontinuities
Works undertaken by Fookes and Parrish[2] into fissures present in the LCF across both the Hampshire and London Basin identified possible trends in orientation and type. These characteristics were linked to regional geological structures, bedding and erosional history.
It was suggested that smooth curved discontinuities formed in shear and rough discontinuities formed in tension with the orientation of both being dependant on the tectonic stress field at the time of deposition. Discontinuities parallel to the bedding formed as part of variations in deposition (sand partings etc) and discontinuities parallel to the surface formed due to unloading of overburden pressure. Of particular interest was the observation that the orientation of fissures was similar to the jointing observed in nearby brittle weak rock formations.
As the works described in this paper are made during tunnel excavations the observed scale is at maximum 10-12m and in many cases much less. With reference to regional scale the observed geological structures and discontinuities would fall into the mesoscopic. Examples given by Fookes and Parrish included Small Folds and Faults, Joints and fissures.
Discontinuities that are impersistent, curved to planar with a visible extent generally being less than 0.5m have been described as fissures. Persistent discontinuities greater than 0.5m have been described as joints. Due to health and safety restrictions with regards to entering unsupported ground no detailed analysis of in-situ discontinuities has been made.
Mechanical Behaviour of the London Clay Formation
There have been three periods of geotechnical data collection that have been considered for this paper. Not including the substantial archive of data now available on the LCF these include the site investigation phase, excavation phase and primary lining phase.
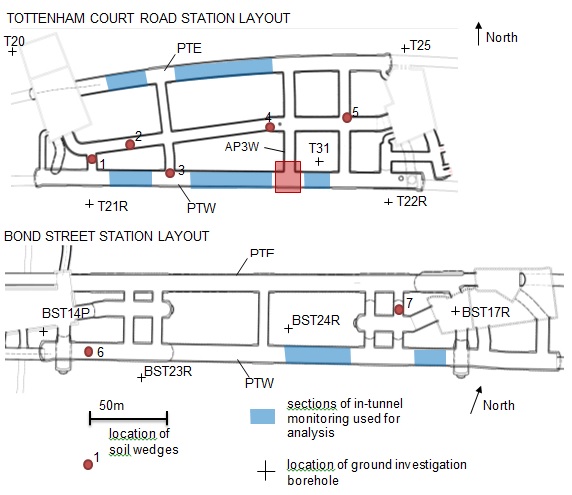 Figure 7 – Site Layout for BOS and TCR
Each phase provided a different perspective, for example during the site investigation phase it was possible to collect highly detailed and accurate geotechnical information. This data is however limited in its scale, effectively representing a pin-point of information across a large area – the site investigation borehole locations are shown in Figure 7. In contrast tunnel excavations provided the ability to observe ground conditions over a wide area but this information was of very limited detail and highly subjective.
These different data sets were combined to give a more comprehensive understanding of the ground conditions as excavation works progressed.
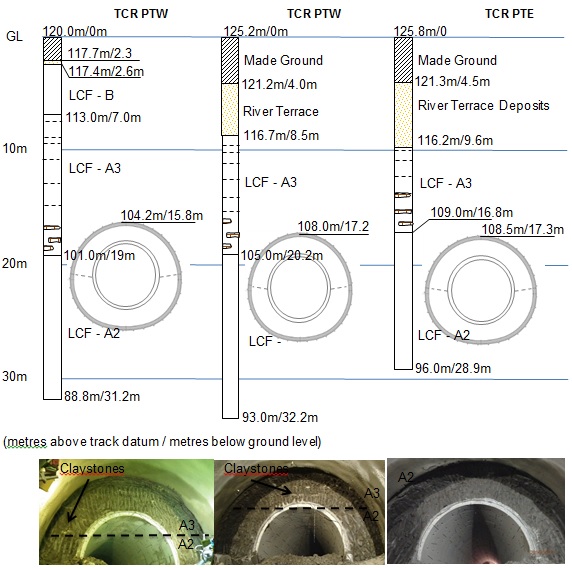
Figure 8 – Stratigraphic Location of Platform TunnelsFinally the primary lining phase allowed collection of geotechnical data in the form of in-tunnel deformation monitoring, i.e. deformation of the shotcrete shell after spraying. Ground conditions can be inferred from this although care must be taken. There are a large number of factors that can affect the behaviour of a shotcrete lining and all must be taken into account in order to effectively infer the influence of any one variable. For this paper, assessments have been focused on PTW and PTE at TCR and the first half of PTW at BOS.
The specific areas are highlighted in Figure 7 and have been selected due to identical excavation sequences and tunnel profiles.
Figure 8 shows the stratigraphic position of PTE and PTW at TCR and PTW at BOS; the overburden of the tunnels varies from 15.8 to 17.3m. The crown of BOS PTW is located above the claystone bands found within the A3 whereas the crown of TCR PTW is located within the claystone bands of the A3. TCR PTE is entirely within the A2.
BOS and TCR have been selected for analysis as the sites provide a unique opportunity to assess two sites that have been constructed using the same plant, shotcrete design mix, construction method, temporary works design, permanent works design and in-tunnel monitoring equipment and software. In addition the bulk of the site investigation works were undertaken under the same package by the same contractor.
Standard Geotechnical Laboratory Test Data from Site Investigation Phase
Much work has been done researching the mechanical properties and behaviour of the London Clay Formation, notable studies include Hight et al. [5] and Standing and Burland [7]. In both studies the trend in properties are similar to those shown for TCR and BOS shown in Figures 9 and 10. The connection between geological composition and mechanical properties is a well established priniciple.
Results assesed include moisture content, plasticity index and undrained shear strength, these have been selected from the most recent ground investigation package. Values for undrained shear strength, cu, have been obtained by undertaking quick unconsolidated undrained triaxial tests on U100 or core samples. Results have been plotted with reference to height above the base of the LCF.
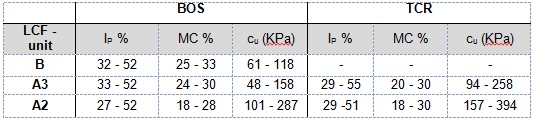
Figure 9 – Summary of Standard Geotechnical Testing
Results showed a general decrease in plasticity index and moisture content towards the base of B, an increase towards the base of A3 and an overall decrease towards the base of A2, although it should be noted an increase is noted towards the very base of the A2 at TCR.
Undrained shear strength shows a consistent trend at both sites, generally increasing with depth. It is notable however that the soil strength at BOS is typically around 50-100kPa lower in the A3 and A2 units than at TCR, this could be explained by the presence of elongated dome structures in the vicincinty of Bond Street suggesting the ground has been subjected to higher degree tectonic stress.
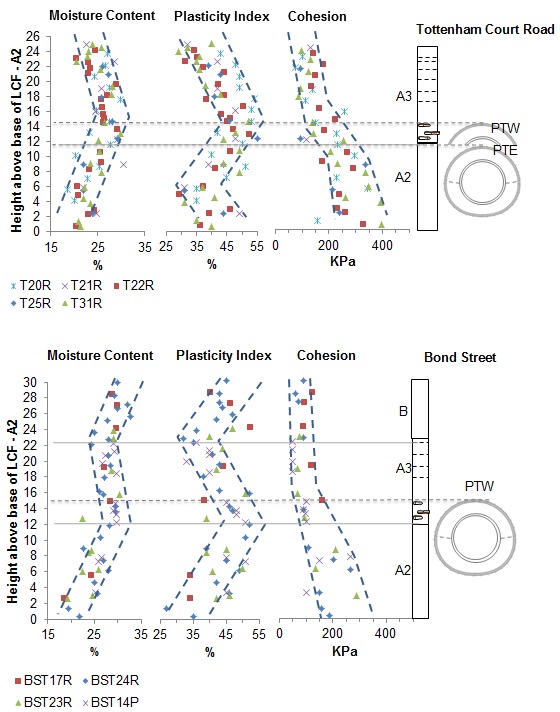
Figure 10 – Standard Geotechnical Laboratory Results
Values of undrained shear strength within the A2 are of particular interest, while overall values show an increased rate of strength gain, the lower and upper limits, as represented by the trend line envelope, diverge by a greater degree towards the base of the LCF. It is known that the presence of fissuring in the clay means that inherent scatter in the results of undrained shear strength testing should be expected (Standing and Burland[7]). Nonetheless it is suggested that this widening range is indicative of two distinct factors controlling the soil strength; that the upper limit represents the strength of the intact soil fabric and the lower limit that of the discontinuity surfaces such as fissures and joints. In the latter case the clay will behave in as a blocky material, similar to a jointed rock mass.
Furthermore it is noted that the undrained shear strength of the London Clay is highly anisotropic and can vary depending on the direction of shearing (Gasparre et al[3]). The rotation of principle stresses that will develop during tunnel excavation means that further variation in undrained shear strength might be expected, hence the importance of assessing the soil strength during excavation.
Observations of Behaviour during Excavation Phase
During excavation at Bond Street and Tottenham Court Road there were no instances of large scale face or crown instability, however there were instances of local overbreak and it was observed that the likelihood of these occurrences increased significantly during breakouts of child tunnels and temporary headwalls. It was also noticeable during the works that this type of behaviour has been restricted to the A2, the brittle nature of which was noted by Gasparre et al[3].
‘Child’ tunnels are those which have been formed by breaking out at right angles from an existing ‘parent’ tunnel, the ground is therefore subject to relaxation from the parent tunnel construction and the resulting potential for fissures and joints to open, with a corresponding reduction in mass strength, is to be expected. Intersection of joints leading to multiple plane sliding appears to be the most common mode of local instability in these cases.
Assessment of soil samples from excavated faces under normal tunnel conditions shows that significant hand pressure is required to break a soil sample along discontinuities. It is therefore considered that the strength across fissures and joints under normal tunnelling conditions remains sufficient to prevent these localised slippages.
It has been noticeable during excavations that A3 appear to have higher occurrence of discontinuities when compared to the majority of the A2, particularly fissures. However detailed observations of discontinuities is not possible during excavations so no data exists to quantify this assessment and a review of borehole logs has proven inconclusive. Jointing has been observed in the A3 but the tendency for it to be exposed during excavation is very low and normally only occurs during excavation through relaxed material (for example at junctions); generally the behaviour during excavation seems to be controlled by the numerous fissures in the A3, obscuring the presence of joints.
It is suggested that the behaviour noted within the A2 is due to its tendency to behave as a brittle wedge able to undergo sliding behaviour along joints. In contrast the A3 response is governed by fissuring and does not appear to slide as a block but rather slumps during excavation.
Undrained shear strengths were checked during excavation using a pocket penetrometer. For safety reasons access to the unsupported face was not feasible, and so tests were undertaken on excavated spoil. As a result the intact strength of potentially disturbed clay was being tested – although every effort was made to avoid material that was clearly disturbed the results were treated more as a means of identifying relative differences in soil strength rather than as giving absolute values for the mass strength of the ground. Some of of the recorded values are given in Figure 11.
Examples of excavations in the A2 and A3 are shown in Figures 12 and 13 respectively. Figure 12 shows the A2 behaving in a blocky manner with horizontal and vertical jointing clearly shown. In contrast the A3 shown in figure 13 is breaking along very to extremely closely spaced fissures. Details of recorded wedges leading to overbreak are described in Figure 13 with examples shown in Figures 14, 15, 16 and 17.
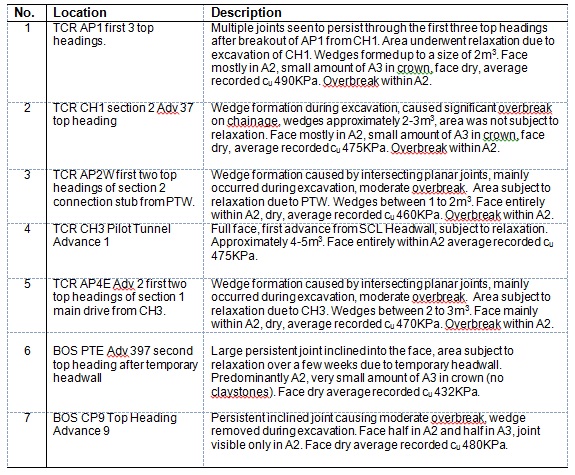
Figure 11 – Description of Notable Wedges
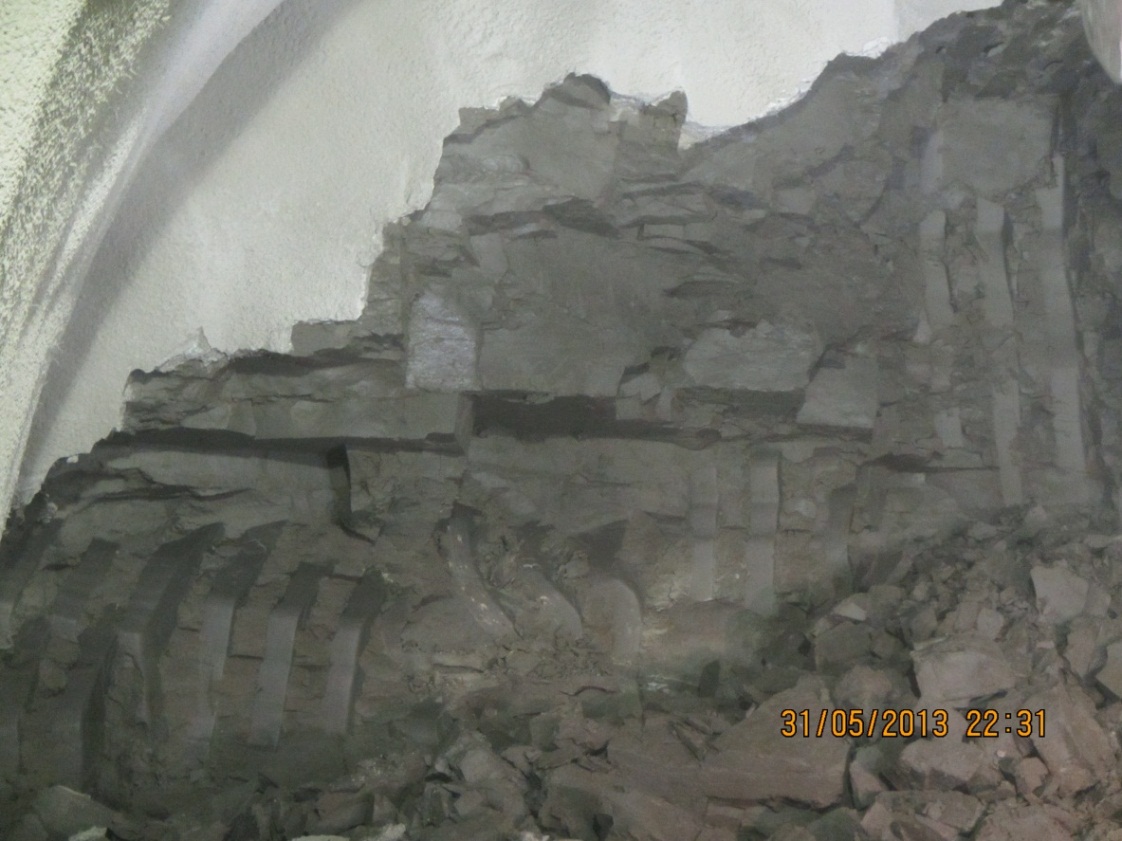
Figure 12 – Excavation of LCF – A2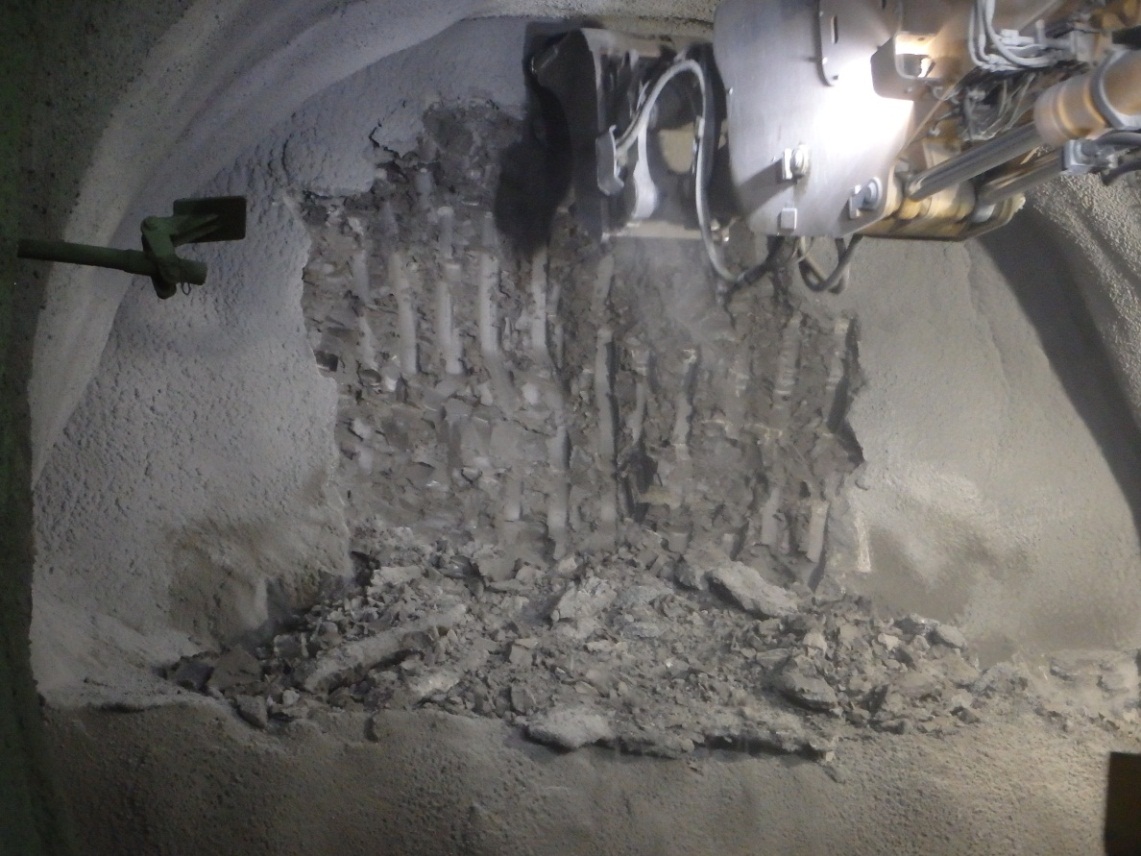
Figure 13 – Excavation of LCF – A3
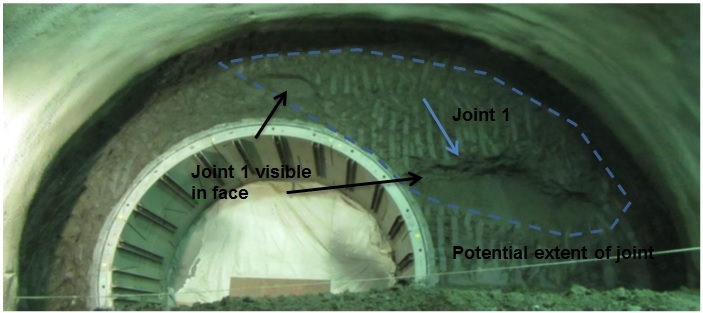
Figure 14 – No. 6 Exposed joint in top heading enlargement of TBM pilot tunnel
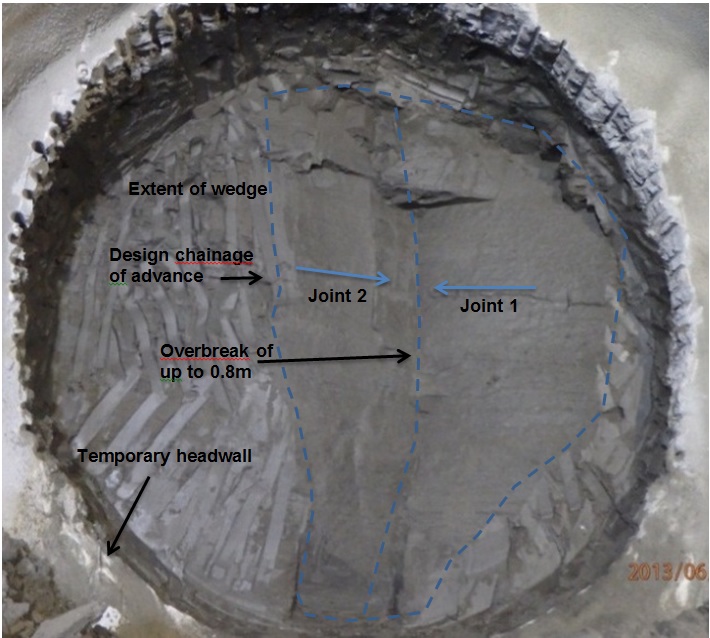
Figure 15 – No.4 Exposed joint in pilot tunnel
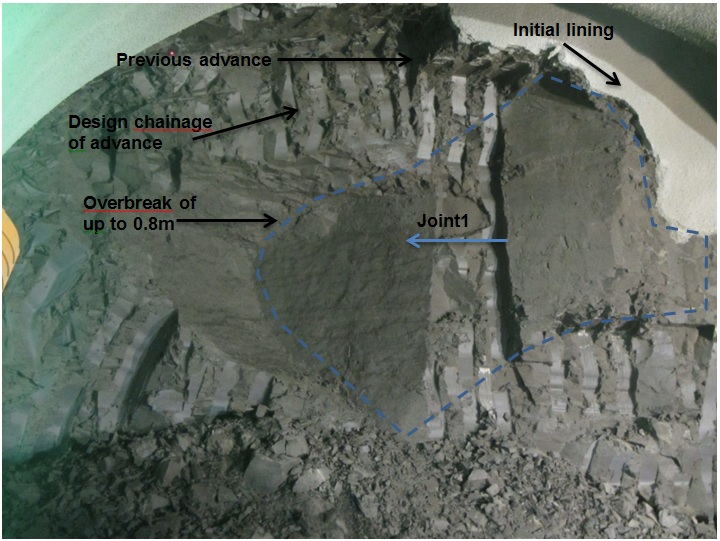
Figure 16 – No.2 Exposed joint in top heading
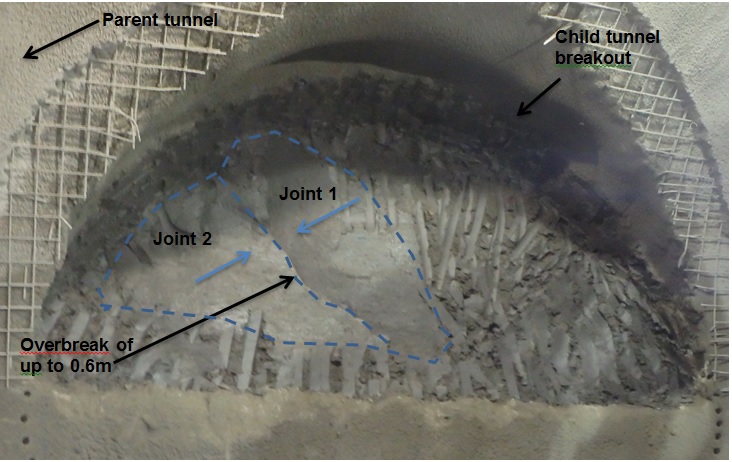
Figure 17 – No.3 Exposed joint in top heading
In-Tunnel Deformation and Convergence Monitoring from Primary Lining Phase
In-tunnel deformations occur as loads from the soil surrounding recent excavations are transferred onto the tunnel lining. The rate and extent of the deformations that occur are dependant on three main variables:
– The magnitude of loads and rate at which these loads are transferred onto the tunnel lining.
– The rate at which the lining gains strength.
– The geometry and size of the tunnel being constructed.The rates at which loads are transferred onto the tunnel lining are controlled by the ability of the ground to support itself during and after excavations, which could be referred to as a soils arching capacity. Arching capacity will be reduced for soil masses with a relatively low mass cohesion. For example zones of faulting with increased permeability or ground that has been subjected to relaxation due to adjacent tunnelling.
The lining strength is dependent on the shotcrete design mix with variations occurring due to quality control issues during batching, transport and application. The geometry is subject to the design of the tunnel before construction and to a lesser extent profile control during excavation, although variations during construction should reasonably be within 300mm.
Monitoring of the in-tunnel deformations was undertaken on the C300/410 contract through the use of monitoring targets installed in the shotcrete lining. A Regular Monitoring Section (RMS) of monitoring targets is installed as soon as possible after completion of the primary lining.
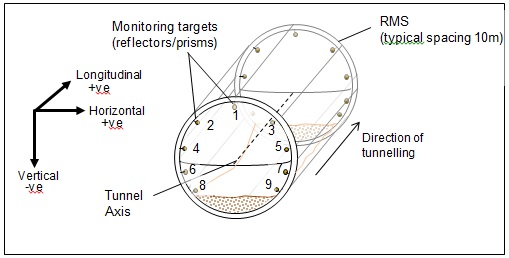
Figure 18 – General arrangement of In-tunnel Monitoring
A general arrangement for an RMS is shown in Figure 18. Movements of the tunnel lining are measured as absolute coordinates (Easting’s, Northings and Elevation) and converted into deformation relative to the tunnel axis. These are reported in millimetres as vertical (-ve for down), horizontal (+ve towards axis) and longitudinal (+ve with direction of tunnelling).
As part of the geotechnical assessment undertaken for this paper it was decided review the behaviour of the shotcrete lining with the aim of identifying variations due to ground conditions. In order to undertake the assessment comparisons must be made between tunnels of the same geometry and construction sequence. The platform tunnel enlargements provided the best opportunity for assessment, each being of the same design and an overall length exceeding 250m. Sections selected for assessment have been highlighted in Figure 7, not all areas could be used as the construction sequence for PTE and the second half of PTW at BOS were different to PTW and PTE at TCR. In addition areas of tunnel that were subject to pre-relaxation of the ground ahead of excavation due to adjacent tunnels have been excluded, as well as junction sections which had a thicker lining and correspondingly larger excavation profile.
Average values of vertical and longitudinal deformation from the selected tunnels sections of PTE and PTW at Tottenham court Road and PTW at Bond Street are shown in Figure 20. All results shown are for the crown monitoring targets, these were selected as they tend to undergo the highest level of deformation and would appear to be the most responsive to variations. Polynomial trend lines were added, from these average 5 day deformation lines were drawn. A period of 5 days was selected as a visual inspection of the trend lines indicates this was approximately the point at which the lining begins to stabilise. The data is based on information from 5No. RMS for BOS PTE, 8No. RMS for TCR PTE and 10No. RMS for TCR PTW. This initial assessment shows a significant increase in movements, particularly longitudinal deformations, within BOS PTW when compared to TCR PTW and PTE.
Work done by Steindorfer [8] established a connection between longitudinal deformations and ground conditions. Although that work was based on the presence of faulting within rock tunnelling the principle may still be applicable and can indicate relative changes in ground conditions. Therefore the variations in movements seen between tunnels could be attributed to differing ground conditions. To verify this conclusion an assessment of deformations through areas of ground known to have a reduced mass strength was done.
The assessment focussed on excavation through the junction section of PTW and AP3W at TCR. AP3W was excavated to within 8.4m of the central axis of PTW 5 months ahead of the excavation of PTW reaching this area. A plan view of this is shown in Figure 19. This provides the opportunity to assess the behaviour of the tunnel lining as it was constructed through known relaxed ground conditions.
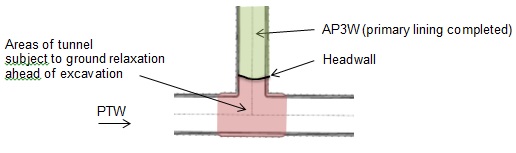
Figure 19 – Plan View of TCR PTE Ground Relaxation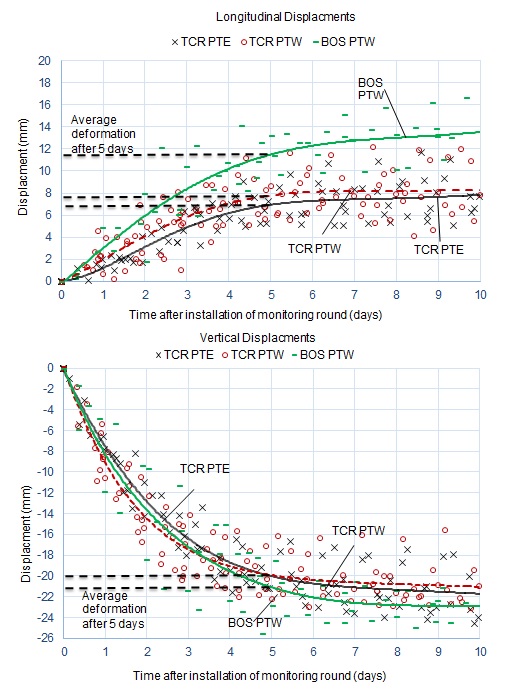 Figure 20 – Deformation Monitoring Assessment
The normal sections of platform tunnels have an external diameter of approximately 10m with the enlarged junction sections have an external diameter of approximately 11m to accommodate an increased lining thickness. Data from RMS in junction sections was not included in the original assessment because of this variations in size.
An influence line diagram produced using IGT’s Tunnel Monitor software is shown in Figure 21. This particular example shows vertical and longitudinal deformations for crown points between chainage 190 and 156 of PTW at TCR. Average 5 day deformation lines taken from Figure 20 have also been plotted for reference.
An influence line diagram presents an interpretive longitudinal section based assessment of tunnel deformations. Put another way it allows assessment of deformations of one target type for the entire tunnel in one diagram. This makes identifying trends and potential adverse trends more intuitive. The basic principle is that each influence line intercepts monitoring data taken in the same round of monitoring. The line then intercepts the x axis at the tunnel chainage for excavation at the time of monitoring. The rate and degree of deformation between the influence lines can then be used to infer trends.
Typical ground conditions (i.e. no evidence of relaxation) are shown to have occurred during excavations between chainages 90 and 120. A temporary headwall was installed at chainage 124, which acted as a vertical slab within the tunnel, stabilising ground movements and therefore reducing tunnel deformation. The effects of this can be seen in the reduced rate at which the longitudinal and vertical deformation develops once the excavation progresses beyond chainage 120 and up to chainage 124.
The headwall was in place for 7 days with recorded vertical deformations of around 1mm prior to breakout. Influence lines during this time have been removed and replaced with a single influence line in order to simplify the diagram. As excavation works recommence there is a marked increase in the rate at which both longitudinal and vertical deformation develops. Although relaxation due to the temporary headwall may contribute to this the principal reason is the relaxation of the ground due to the excavation of AP3W ahead of PTW.
As excavation for PTW reach the central axis of AP3W, at chainage 138, the crown target at chainage 137 shows development of negative longitudinal deformation. During this time no increase in longitudinal deformation is shown at chainage 129. This suggests that the lining at chainage 137 is restraining further longitudinal movement at chainage 129. As time progresses and ring closure is achieved at chainage 137 the tunnel lining moves forward with the direction of excavation. This can be seen in the positive longitudinal deformation at chainage 137 and also the increase in longitudinal deformation at chainage 129.
This process is visualised in Figure 22 using a shotcrete utilisation diagram produced using Tunnel Monitor. The diagram shows the theoretical utilisation of available strength within the lining at a given time. Blues indicate a low level of utilisation with reds indicating a high level, assumptions have been made with regards to shotcrete properties and results should only be taken as indicative.
It can be seen that as the negative longitudinal deformation develops shotcrete utilisation between chainage 129 and 137 starts to increase. The highest concentration of utilisation within the lining appears to coincide with the central axis of AP3W.
 Figure 21 – Influence Line Diagram
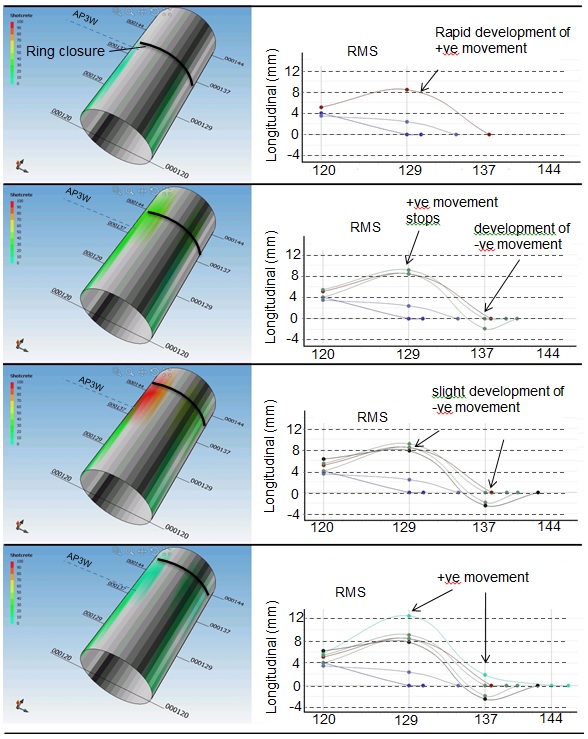 Figure 22 – Shotcrete Utilisation Diagram
It is important to note the inherent inaccuracies involved with in-tunnel monitoring, generally it is accepted that horizontal and vertical displacements can be taken to a high degree of accuracy, longitudinal however is more prone to errors and can be more affected by the level of dust, ambient temperature, setting out location during monitoring and a variety of other factors.
It is therefore important to review monitoring data from the whole RMS taking into consideration the trend of the deformation not just the values. A realistic working accuracy for the longitudinal deformation is taken as +/- 2mm for longitudinal and +/- 1mm for horizontal and vertical.
Figure 23 shows the horizontal, vertical and longitudinal deformation with time for all targets within RMS 137. The negative longitudinal deformation of the crown targets mentioned in Figure 19 and 20 can be seen to be mirrored in targets 1 to 5. The possibility that the negative longitudinal deformation is a false reading must be considered, for this a review of the horizontal and vertical displacements must be made.
Significant levels of longitudinal deformation without corresponding horizontal or vertical deformation should be viewed with suspicion, in this instance longitudinal deformations are supported by the vertical and horizontal movements. However the negative longitudinal deformations are still within the working margin of error, meaning the readings could be zero or just above positive.
After ring closure and installation of targets 6 to 9 longitudinal deformation in targets 4 and 5 stabilise and targets 1 and 3 turn to positive. It is at this point in Figure 22 that shotcrete utilisation within the lining are shown to return to normal. Point 2 has been damaged and values should be dismissed although the on-going trend still provides information. Reviewing the data and taking into account an accuracy of +/- 2mm, deformations for RMS 129 and 137 are still showing considerable variations outside of what could be considered normal behaviour.
Figure 22 shows deformations for RMS 100 which are considered to have occurred under typical ground conditions. The deformation trend is considered representative of the RMSs used for the average deformation assessment shown in Figure 20. What is shown is a tendency for the crown to move forward with minimal movement shown in the horizontal axis targets and negative longitudinal deformations shown in the invert targets. This suggests pivotal movement around the horizontal axis.
Horizontal and longitudinal deformations after 5 days at RMS 130 and 137 have shown significant variation from average 5 day deformations. The likely cause for this is the relaxation of the ground around AP3W leading to a reduction in the mass strength of the clay. As well as the increased longitudinal movement observed as the tunnel is driven towards the axis of AP3W, the negative longitudinal deformation observed close to the AP3W axis may indicate longitudinal deformations are a particularly sensitive indicator of ground conditions.
Applying this principle to the average deformations for BOS and TCR, as shown in Figure 20, indicates a relative reduction in ground quality at BOS. Although vertical deformations at BOS are not significantly greater than those seen at TCR there is a large increase in the longitudinal deformations which may suggest a reduction in ground quality.
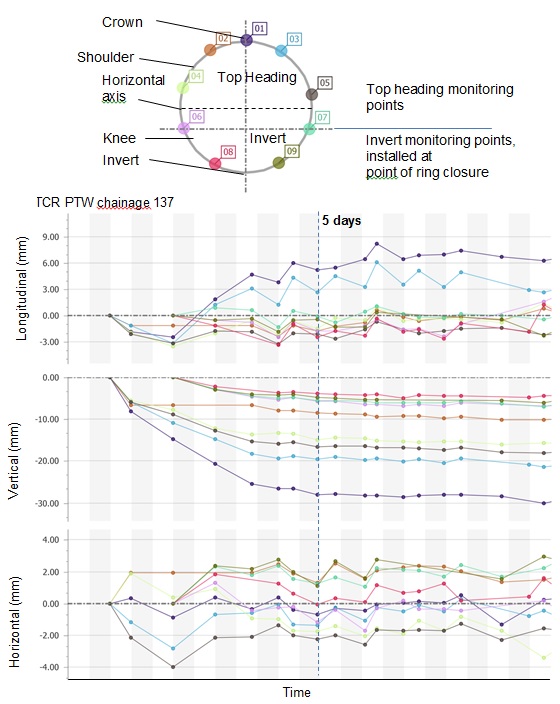 Figure 23 – 3D Deformations for RMS 137 (relaxed ground conditions)
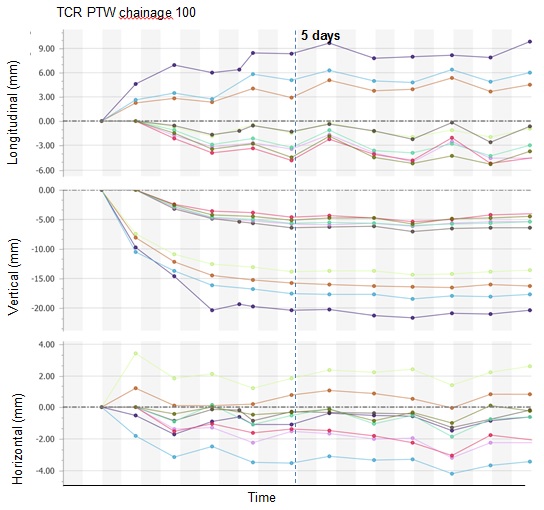 Figure 24 – 3D Deformations for RMS 100 (normal ground conditions)
Risk Management
Clearly the risk of failure of the face and/or crown posed risks to the work force, and, if large enough, to the overall excavation stability. A set of temporary measures, designed to work in conjunction with the partially completed lining, were developed to mitigate the risks associated with large scale failures, as follows:
- Pocket excavation, to improve face stability by reducing the size of the open face area at any given time (to be used wherever the undrained shear strength of the clay fell below a design value required to ensure face stability).
- Face dowels, again to improve face stability wherever low clay strengths were encountered. These were considered to be less preferential than pocket excavation as they were slower to install, required removal in subsequent excavation rounds, and could not be used wherever there was an obstruction ahead of the face (e.g. running tunnel or ticket hall box).
- Spiling, to improve crown stability in blocky ground
The ground conditions encountered during the works to date have been favourable and no such temporary measures have been needed. The clay fall-outs described in this paper have been much smaller, localised issues.
As noted previously the initial lining was a vital element in protecting the workforce who were required to enter beneath it on order to prepare the joints in the tunnel lining. The nominal thickness for the initial lining given by the designer of the SCL was 75mm. Using the ground information available prior to the commencement of tunnelling, the likely patterns and spacing of fissuring was assessed in conjunction with the proposed tunnelling sequences (one metre advances, and then whether or not the tunnel was full face or divided into a top heading with a bench and/or invert, or if a pilot tunnel was to be used) and used to determine a block size (modelled as a point load) that the initial lining needed to be capable of supporting. This review concluded that a point load of 40kg, equivalent to a block of clay the size of a piece of carry-on airline baggage, was a realistic load case. The various different tunnel sequences and geometries were then assessed to determine a minimum strength requirement for a 75mm thick layer of shotcrete to support this. Geotechnical logging of the face and crown became critical to ensure that the fissure spacing assumed in the design remained consistent with conditions in the field, and if there were concerns about the potential for larger blocks to be loosened during excavation then further measures could be deployed to improve stability:
- In the face, dowels could be used to the restrain potentially loosened soil wedges if these were identified, the curvature of the face could be increased to enhance the arching action in the initial lining, or the initial lining thickness could be increased and/or a higher shotcrete strength specified before entry below was permitted.
- In the crown, spiles could be used to restrain potentially loosened soil wedges, the excavation lengths could be reduced to minimise the size of opening, and again the initial lining thickness could be increased and/or a higher shotcrete strength specified before entry below was permitted.
Localised fall-outs of the type discussed in this paper (i.e. described in Figure 13 and illustrated by Figures 14 to 16) were difficult to design against and did not in themselves pose a risk to the overall stability. In these instances any loose material was removed before spraying the initial lining. Exclusion zones were rigorously maintained to protect the workforce from any such falls of material (Crossrail[14]).
Conclusions
As has been shown there are significant variations in the behaviour of the London Clay Formation. It would appear likely the differences observed in the LCF are controlled by variations in soil properties and distribution of discontinuities. These in turn would appear to be controlled by deposition, subsequent unloading and tectonic induced stresses.
Variations in soil properties are consistent with the geological boundaries, with sub-units showing distinct mechanical properties. In addition at a regional scale undrained shear strength of the soil mass appears dependant on the proximity to tectonic structures however the localised trend for development undrained shear strength appears dependant on geological boundaries and depth.
During the course of excavations no occurrences of overbreak were recorded in the A3, in contrast a number of instances were recorded to have originated from within the A2. It is suggested the reasons for this is a combination of less fissuring within the A2 and a generally higher undrained shear strength in the intact material which, in conjunction with jointing, can lead to formation of brittle wedges and sliding. In contrast it appears that the A3 behaves less as a single cohesive mass and more as a ductile soil mass able to deform in several directions along numerous fissures and joints, effectively slumping.
This was supported to some extent by the deformation monitoring with the highest vertical and longitudinal deformation occurring in the A3 at BOS, followed by the A3 at TCR and lowest levels occurring within the A2 at TCR. The increase in deformations within the A3 at BOS is likely in part to be due to the overall decrease in undrained shear strength suggested by lab testing. It is suggested this is due to increased tectonic induced stresses as indicated by dome features in the vicinity of BOS.
It can also be noted that the number of instances of overbreak recorded was much higher at TCR than BOS. This could be attributed the variations in geology, with a higher percentage of tunnel headings excavated mainly in the A3 at BOS. Additionally an increase in localised tectonic features at BOS could suggest a higher frequency of fissuring and jointing, this would work to break up the soil mass thereby reducing potential wedge size and therefore weight, which reduced the likelihood of slippage.
An overall reduction in undrained shear strength at BOS could also suggest the A2 does not exhibit brittle behaviour to the same extent as the A2 at TCR, which could reduce the likelihood of slippage occurring.
In conclusion the following points can be made
- The importance of high quality geotechnical site investigation data that is collected by suitably trained site geologist under appropriate supervision cannot be understated. As has been shown geologically boundaries are clearly connected with geotechnical properties. Emphasis should also be placed on detailed and accurate descriptions of discontinuities.
- Standard laboratory test results shown a consistent connection to geological boundaries at a site level and regional level. The trend for undrained shear strength is also consistent across sites although overall strength appears influenced by regional tectonic structures.
- It can be noted that the LCF A2 exhibits a brittle weak rock like behaviour during excavation when compared to the overlying A3, which behaves as a ductile soil mass. This can result in larger wedge size and a higher occurrence of sliding within the A2.
- Advanced assessment techniques of in-tunnel monitoring, such as influence lines and shotcrete utilisation diagrams, may provide useful additional methods for understanding the behaviour of the shotcrete lining and ground conditions.
References
[1] Aldiss D T 2014. The stratigraphical framework for the Paleogene successions of the London Basin, UK. British Geological Survey Open Report. OR/14/008
[2] Fookes P G, Parrish D G 1969, Observations on small scale structural discontinuities in the London Clay and their relationship to regional geology. Quarterly Journal of Engineering Geology and Hydrogeology, v.1; p217-240.
[3] Gasparre, A, Nishimura,S., Minh, N., Jardine, R. J., Coop, M. R., 2007. The stiffness of natural London Clay. Geotechnique 57, No. 1, 33-47
[4] Hight D W, F McMillian, J J M Powell, R J Jardine, C P Allenou. 2003. Some characteristics of London Clay, Characterisation and Engineering Properties of Natural Soils. Tan et al. (eds.), Swets & Zeitlinger, Lisse, Vol.2, 851908
[5] Hight D W, Gasparre, A, Nishimura,S., Minh, N., Jardine, R. J., Coop, M. R., 2007. Characteristics of the London Clay from the Terminal 5 site at Heathrow Airpor. Geotechnique 57, No. 1, 3-18
[6] King, C (1981). The Stratigraphy of the London Basin and associated deposits. Tertiary Research Special Paper 6, Rotterdam: Backhuys
[7] Standing J. R., Burland J. B., 2007. Unexpected tunnelling volume losses in the Westminster area. London, Geotechnique 57, No. 1, 11-26
[8] Steindorfer A, 1998, Short Term Predictions of Rock Mass Behaviour in Tunnelling by Advanced Analysis of Displacement Monitoring Data, Technische Universität Graz
[9] Crossrail (2014). Best Practice Guide to Exclusion Zone Management. -
Authors

Shawn Sismondi, BEng FGS
BAM Ferrovial Kier (BFK) Joint Venture
Vicky Potts MA MSc PhD - Donaldson Associates Ltd
Donaldson Associates Ltd
Wolfgang Weinmar, MSc MEng
IGT Geotechnik und Tunnelbau
