The Protection of Existing DLR Viaduct Against Cross-Passage Construction Impact
Document
type: Technical Paper
Author:
Vipul Chandegra MEng, Richard Bailey, Francisco Bernardo MEng, ICE Publishing
Publication
Date: 30/09/2017
-
Read the full document
Notation
CPT Cone Penetration Test
h height of cone of depression
mATD metres Above Tunnel Datum
SGI Spheroidal Graphite Iron
TAMs Tubes à manchette
UCS Unconfined Compressive Strength
Introduction
The protection of the Docklands Light Railway (DLR) River Lea Viaduct became the subject of extensive scrutiny as temporary groundwater control was undertaken to facilitate the safe construction of cross-passage 14 (CP14) on the Crossrail project.
Initial dewatering, undertaken in late 2013, resulted in ground movements greater than originally predicted without achieving the groundwater levels required to allow CP14 excavation to proceed. The resulting ground movements affected the stiff post-tensioned concrete viaduct, located 40 m away from CP14 at its closest point at Pier L4 (Figure 1). Consequently local dewatering at CP14 was stopped in January 2014.
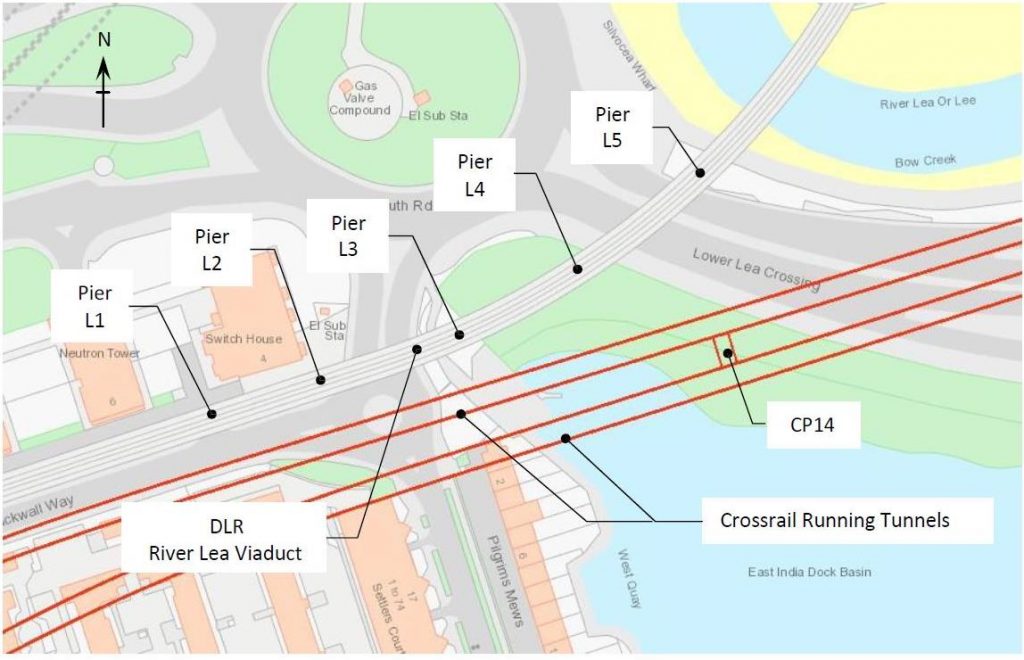
Figure 1. DLR River Lea Viaduct and Cross-passage 14
At this stage, a revised damage assessment was undertaken. The revised assessment resulted in tight trigger values and additional precise monitoring being specified to protect the viaduct against further dewatering impact.
Dewatering was reconnected in phases from July 2014. During this period, challenges were encountered with the live monitoring data, which required interpretations and analyses to be carried out to demonstrate the viaduct remained within the implemented trigger values. The monitoring data was further used to validate assumptions made in the additional assessment and to support redefining trigger values where appropriate.
The dewatering scheme was later supplemented by local grouting. At this stage a further analysis was undertaken in which the observed ground movements were back-analysed using information from CIRIA reports R113 and C515, while accounting for the observed ground movements due to local grouting, to predict the impact on the viaduct from further dewatering.
This subsequently allowed the CP14 construction to continue without further adversely impacting the viaduct, while supporting the overall Crossrail construction programme.
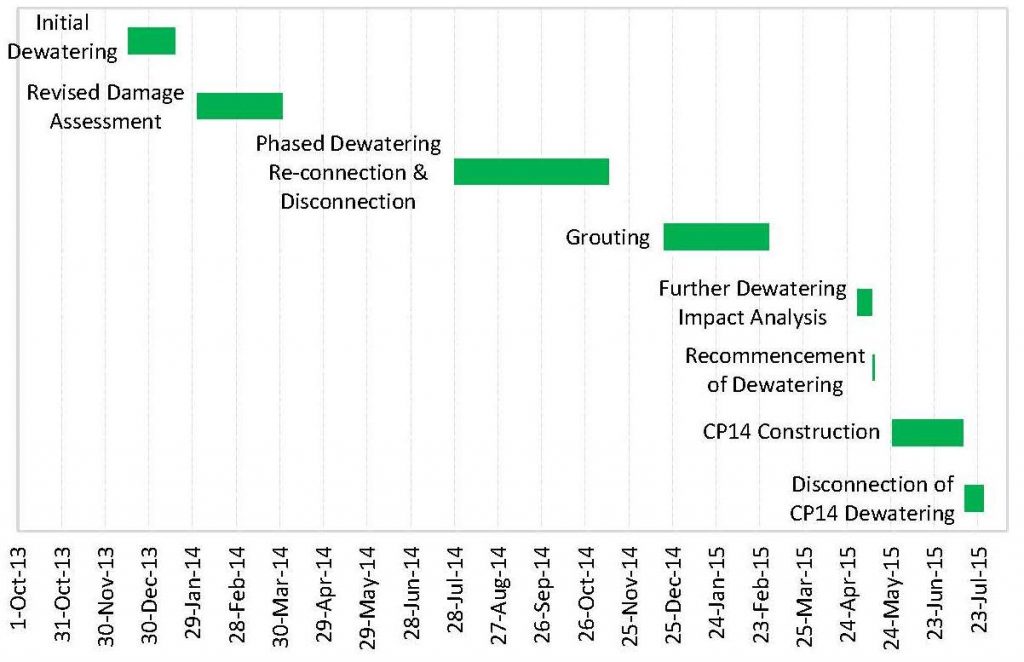
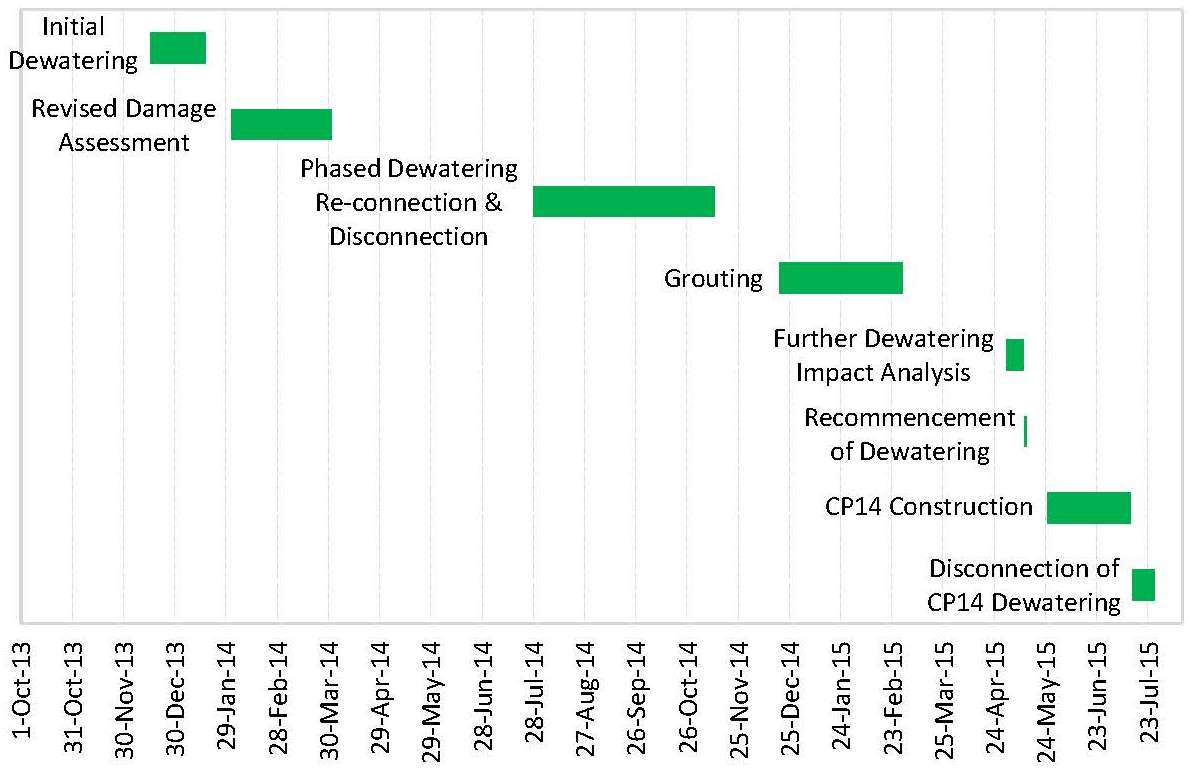
Figure 2. Timeline of activities
This paper will describe the challenges encountered in undertaking the revised assessment, interpreting the live monitoring data to support redefining trigger values and summarise the further analysis that facilitated the continued protection of the viaduct as CP14 was constructed.
DLR River Lea Viaduct
The DLR River Lea Viaduct, built circa 1990, is a seven span segmental post-tensioned concrete box girder carrying two tracks. The layout of the affected part of the structure is shown in Figure 1, while a typical deck cross-section is shown in Figure 3.
The main 74 m span, which crosses the river, and the two adjacent half spans were built by balanced cantilever method. The remaining spans typically of 40 m were assembled on temporary supports. Foundations were mainly bored piles with the exception of pier L3 which was founded on top of an old river wall. The viaduct is S-shaped in plan and rises to a crest over the river. Pier L5 is the fixed point for bridge articulation. No information on the alignment was included on the bearing schedule and so the bearings at the piers were assumed to be guided parallel to the tracks locally.
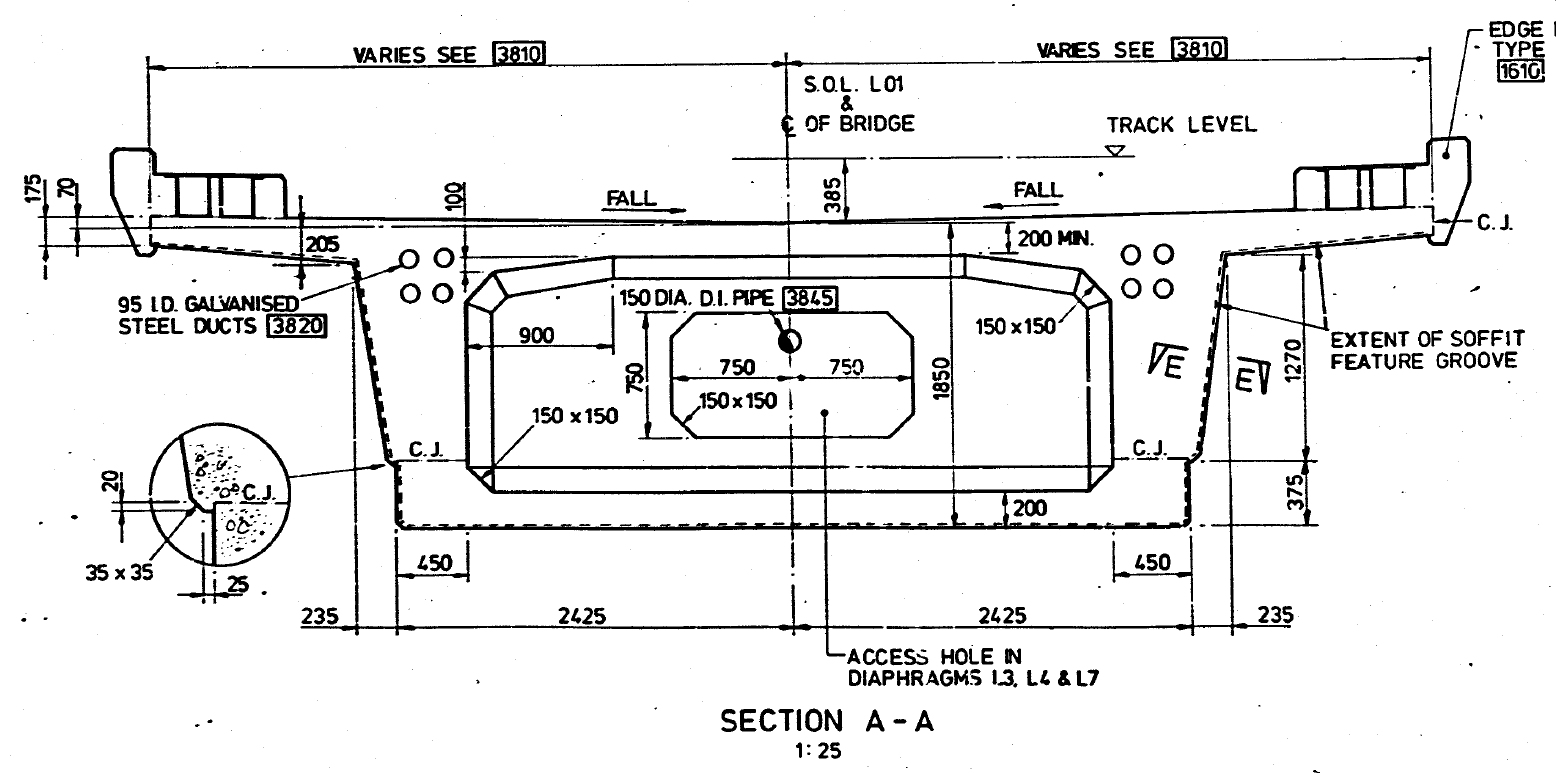
Figure 3. Typical deck cross-section over approach span to piers
CP14 Construction Strategy
CP14 is located on the Crossrail route between Stepney Green Junction and Victoria Dock Portal and is beneath the old East India Dock. It has a 3.8 m internal diameter and was to be constructed by hand mining methods using timber headings with SGI rings and a concrete collar at the junctions to the twin-bored running tunnels. A dewatering strategy was developed to facilitate the safe construction of CP14 by reducing the risk of water ingress and loose granular material collapsing into the open faced excavation.
Ground Conditions
The ground conditions at the location of CP14 comprised layers of interbedded sand and clay of the Lambeth Group. Table 1 summarises the ground conditions in the vicinity of CP14. The CP14 invert level is at 69.3 mATD (37 m below ground level).
Table 1. Summary of ground conditions
Stratum Top Level (mATD) Upper
Aquifer
Made Ground 106.4 Alluvium / Terrace Gravels 102.0 London Clay 91.0 Intermediate
Aquifer
Lambeth Group – Clay 77.9 Lambeth Group – Sand Channel (Top) 76.9 Lambeth Group – Sand Channel (Base) 72.4 Lambeth Group – Mid-Lambeth Hiatus 69.4 Lambeth Group – Clay with Sand Channel 68.3 Lower
Aquifer
Thanet Sand 59.3 Chalk 48.0 (approx.) Dewatering Strategy
The initial dewatering strategy, from late 2013 to early 2014, comprised surface ejector wells to depressurise the intermediate aquifer. At this stage the dewatering of the lower aquifer solely used installations at locations distant from CP14, meaning their impact was widespread and could therefore be ignored. These installations remained ongoing throughout CP14 construction.
Dewatering was reconnected in phases in July 2014, as a measure to control the resulting ground movements. The phased reconnection comprised depressurisation of the intermediate aquifer using surface ejectors, which were temporarily disconnected at various stages based on the observed ground movements, and local in-tunnel wells. To achieve the required additional localised drawdown within the lower aquifer, further in-tunnel wells were bored from the running tunnels.
The groundwater levels were monitored by 5 No. piezometers installed from ground surface in the vicinity of the dewatering area with a further 3 No. installed from within the twin-bored running tunnels.
Ground Treatment
Due to difficulties in achieving the drawdown required, the surface ejector wells in the intermediate aquifer were disconnected in November 2014. Further options (ground freezing and ground treatment) were considered to supplement the dewatering scheme. In late 2014 to early 2015, local permeation grouting was undertaken.
Grouting was undertaken from ground surface using an array of tubes à manchette (TAMs), installed to target the cross-passage collar areas. The aim was to improve ground conditions by targeting the sand layers with a view to achieving a minimum 0.3 MPa UCS.
Validation of the grouting was carried out through CPT tests. This allowed an undrained shear strength to be determined and thus allowing the UCS to be calculated. The CPT results indicated a UCS value greater than 4 MPa had been achieved.
Initial Ground Movement Assessment
As the dewatering scheme was to be Contractor designed, the initial ground movement assessment took into consideration an indicative dewatering scheme to provide a potential range of movements. A drawdown profile was constructed with subsequent settlement being calculated. The settlement calculation was based on the reduction in pore water pressure and subsequent changes in effective stress, as per CIRIA C515.
Less than 14 mm total settlement was calculated at the location of CP14 due to the indicative dewatering scheme. The maximum calculated differential settlement across the nearest viaduct pile cap was less than 0.3 mm, with a maximum settlement profile gradient of 1:18500. The calculated settlement, combined with the predicted movements from the running tunnels, was deemed negligible.
However, as piers L1 to L4 fell within the 1 mm tunnelling induced settlement contour, based on the moderately conservative assessment, automatic prism monitoring was attached to the viaduct deck and columns at these locations.
Initial Dewatering and Revised Damage Assessment
Initial dewatering of the intermediate aquifer commenced in late 2013, with the connection of 14 No. surface ejector wells. Ground movements of up to 22 mm were recorded using levelling studs at ground surface in the vicinity of CP14. The recorded ground movements exceeded the predicted amount without achieving the groundwater levels required. The dewatering was therefore stopped in January 2014.
Revised Damage Assessment
A revised damage assessment of the viaduct was undertaken to assess the impact of the movements that had been observed from the initial dewatering phase. This was made complicated as the frequency of the automated prism monitoring on the viaduct had been reduced following the completion of the twin-bored running tunnels in early 2013. Upon recognising the observed ground movements were greater than predicted, the prism monitoring frequency was increased in January 2014. However the data was known to contain anomalies.
The revised assessment was also required to define trigger values for the asset protection of the viaduct against further dewatering induced movements. At this stage it appeared the only available archive information for the viaduct was general arrangement drawings and a Design Statement.
Movement from the initial dewatering period had been recorded using prisms each side of the deck from piers L1 to L4, each side of the top and bottom of columns from piers L1 to L4, and track levels between piers L1 and L5. Vertical movement could be inferred from the prisms and track levels. Lateral movements of the deck could be inferred from the high level prisms. Rotation of the deck about its axis could be inferred from prisms on the two sides of the deck, and from the track levels. Inconsistency between the three forms of monitoring was significant compared with the amount of movement which appeared to have occurred.
The greatest inferred lateral movement at track level was 8 mm over piers L3 and L4. The greatest differential lateral movement was likely to be between the positions of piers L4 and L5. The lack of a monitored movement over pier L5 was a significant handicap, and it was necessary to make a cautious estimate for this value using engineering judgement.
The lack of archive information, combined with the uncertain movements, made any sophisticated analysis inappropriate. Simple and approximate manual calculations were therefore used. The simple manual analysis indicated that:
- The deck is very stiff in lateral bending: differential lateral movements within the range of possible ones that could be inferred from the monitoring data would have resulted in forces being applied at the guided bearings which were significant in relation to the capacity of the bearing guides;
- The deck is extremely stiff torsionally: twisting of the deck which was scarcely measurable with the then-current instrumentation could have caused significant torsional shear stresses to develop;
- The deck is more flexible in vertical bending, but the imposed differential movements were greatest in a vertical direction;
- The webs of the girder would in some places be adversely affected by both twisting and differential settlement.
The shortage of archive information made it impossible to compare existing and applied load effects, from the observed ground movements, with capacities. It was possible to compare applied vertical web shears with the existing ones (ignoring any previous distortions), and this showed that the applied effects were of the same order as the excess capacity which is often initially designed in.
As a result the following actions were taken:
- Tiltmeters were installed on the deck at each pier position so that further twisting of the deck could be accurately measured;
- Tight trigger levels of further deformation of the deck and piers were set (Table 2);
- Regular visual inspections of the viaduct were implemented, both from ground level, track level and of the bearings using mobile access equipment.
Table 2. Trigger values following revised damage assessment
Criterion Trigger Differential vertical movement at L3 relative to a straight
line joining L2 and L4
4 mm
Differential vertical movement at L4 relative to a straight
line joining L3 and L5
2 mm
Differential lateral movements between piers
L1-L2, L2-L3, L3-L4
3 mm
Differential lateral slope downwards to the north at L3
relative to L2
1:2200 Differential lateral slope downwards to the north at L4
relative to L3
1:3000
Observed Movements and Further Analysis
Dewatering was reconnected in phases between July and August 2014. During this period, the live monitoring data was extensively scrutinised, primarily deck twist and lateral triggers which were closest to the triggers.
It was identified the deck twists from piers L2 to L4 were occurring in the opposite sense to what was anticipated. Consequently new trigger values were required to cover this. At this stage additional archive drawings were located, including the reinforcement and post- tensioning drawings. This allowed the structure to be further analysed with a view to increasing the differential settlement triggers between adjacent piers.
Simple manual calculations provided estimates of the girder strength for a typical 40 m span. Reasonable estimates were made for distortion which might have occurred prior to Crossrail construction. The result was a modest increase in the allowable twist in the deck (to +/-1:2000 over any span), and a more significant increase in the allowable differential settlement between adjacent pier locations (to an offset at any pier from a straight line joining the two adjacent piers of 10 mm sagging or 5 mm hogging). Because the revised trigger levels were still very small they were applied to other spans with simple checks that the strength to stiffness ratios were broadly similar. The differential lateral triggers remained unchanged at this stage.
Temperature Affected Deck Tilt
The tiltmeters were installed on the deck in mid-May 2014. The initial readings indicated significant variability which led the monitoring contractor to adjusting how the measurements were taken. The variability of the early readings were ignored and the tiltmeters were baselined in July 2014.
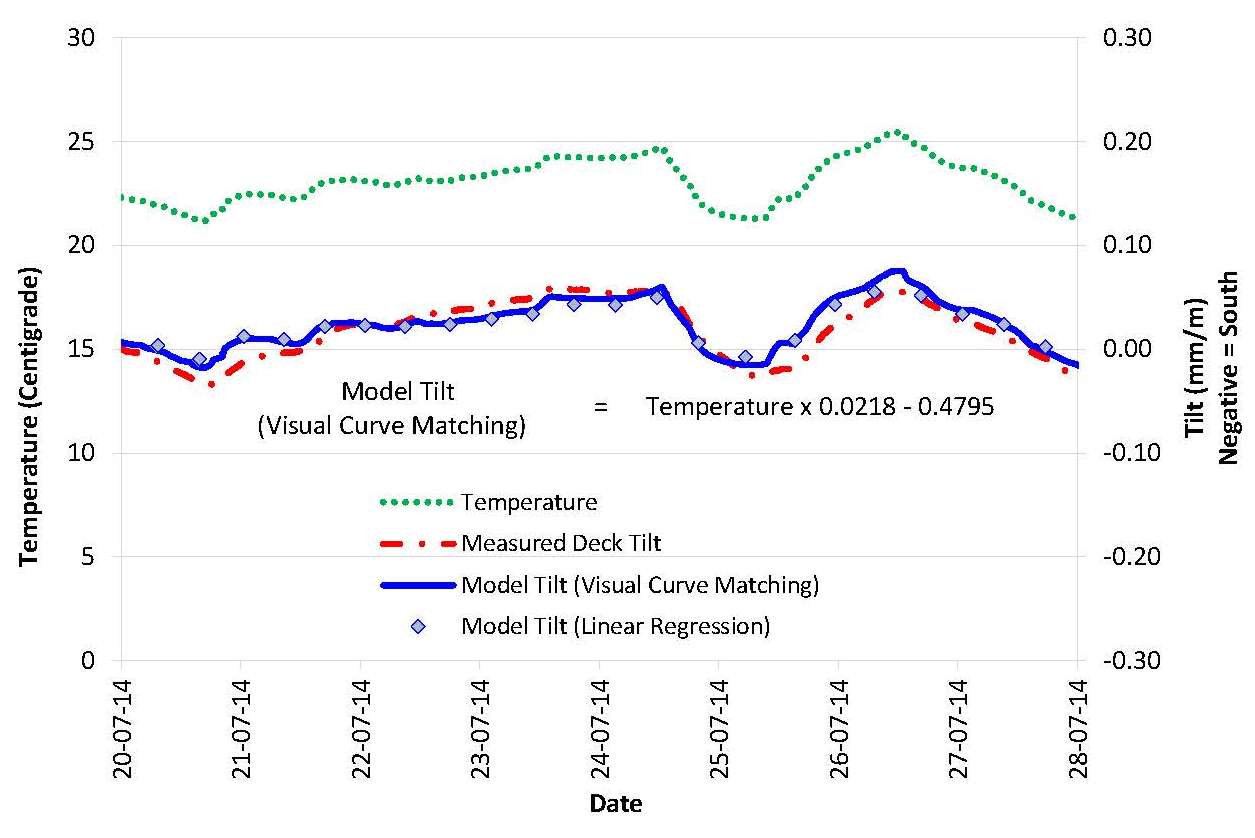
Throughout the phased reconnection and disconnection of dewatering from July 2014, a trend was identified in the behaviour of the deck twist for pier L4 relative to L3. This was initially thought to be due to dewatering influence, which at the time was considered logical due to the location of these piers relative to the works. Upon further inspection of the data, a strong linear relationship between the deck tilt readings at pier L4 and temperature readings was identified (Figure 4). Pier L1 was the only other pier to exhibit slight signs of a linear relationship of tilt with temperature. This pier included a free spherical bearing, due to it being at the movement joint, and a longitudinal guided bearing. The observed slight relationship between deck twist and temperature might have been caused by the longitudinal bearing guide at being parallel to the tracks and the resulting lateral guide force being applied below the centroid of the deck girder.
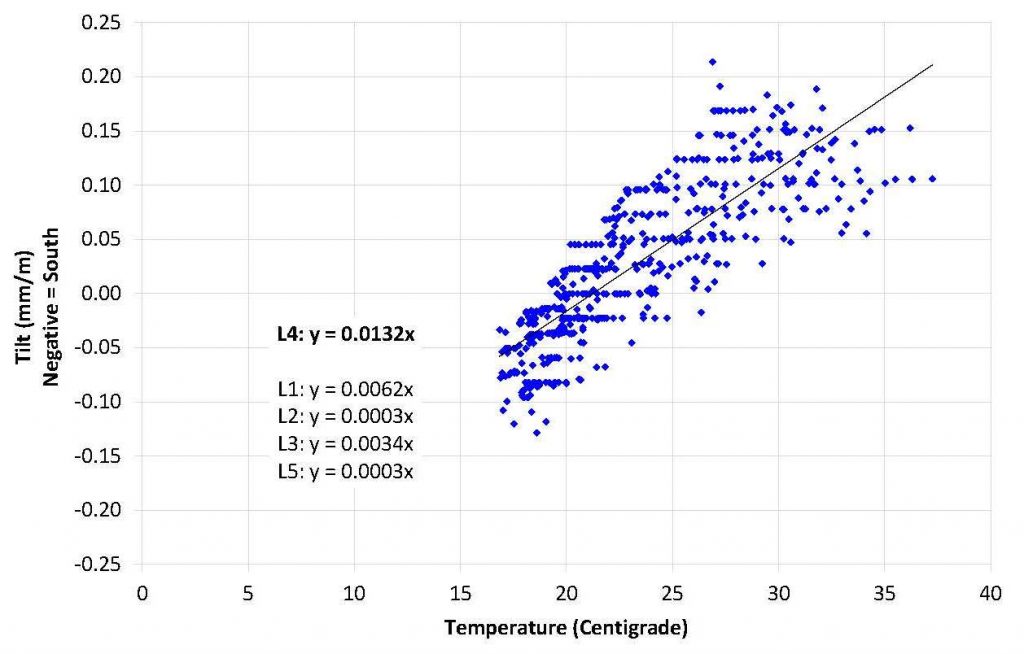
Figure 4. Linear relationship between pier L4 measured deck tilt and temperature
An analysis was undertaken to eliminate temperature effects from the measured pier L4 deck tiltmeter readings using visual curve matching. A model tilt was determined using constants to curve match the measured temperature profile to the measured tilt profile. Divergences of the model tilt from the measured tilt would represent an effect other than due to temperature.
The visual curve matching was undertaken over a very limited period of baseline monitoring prior to the reconnection of the surface ejector wells. A regression analysis was also undertaken to match the measured temperature profile over this baseline period. The regression analysis provided similar constants to those obtained from visual curve matching, to a good degree of accuracy (Figure 5).

Figure 5. Curve matching for pier L4 deck model tilt
Through eliminating the temperature effects, it was identified the resulting deck tilt was less and in the opposite direction to what had previously been recorded (Figure 6). Furthermore the effect of dewatering could be identified and related to the phased activities taking place at the time. There were three particular instances where the dewatering influence on the deck tilt could be identified;
- Delayed increase in tilt to the north in mid-August 2014 when surface ejector wells and in-tunnel wells were connected;
- Small and delayed increase in tilt to the north in late September 2014 when surface ejector wells were reconnected;
- Delayed increase in tilt to the north in early November 2014 following phased reconnection of surface ejector wells from late October 2014.
Periods when the dewatering was disconnected showed no discernible change in the tilt.
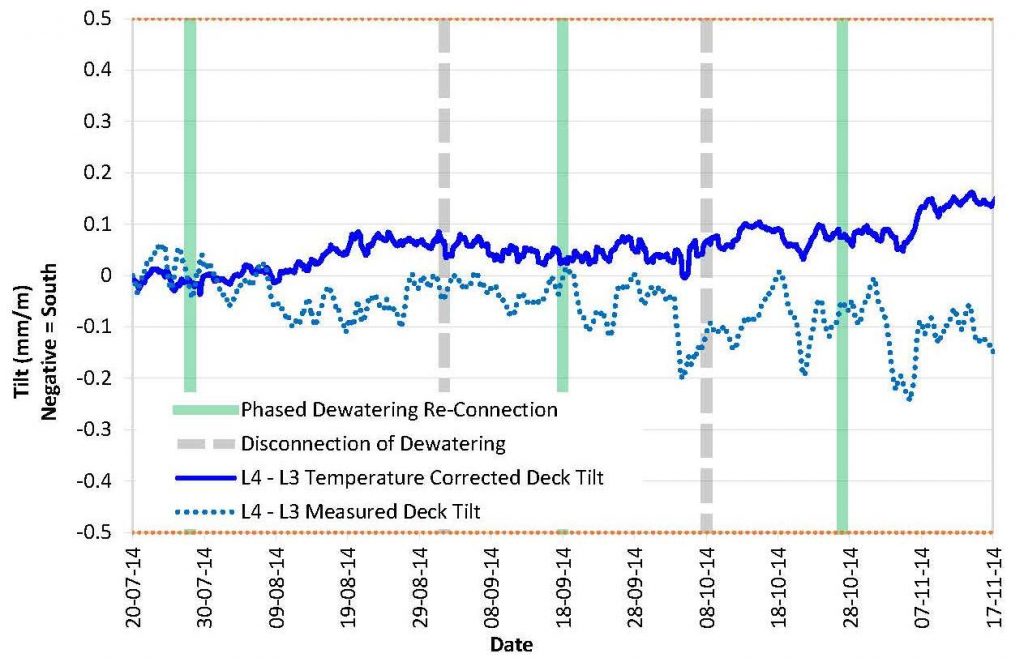
Figure 6. Pier L4 deck tilt relative to Pier L3
The analysis proved effective in highlighting the impact of dewatering on the deck tilt, which had not been readily identifiable during the revised assessment. Furthermore, the analysis allowed attention to be focused on monitoring values that were closer to the triggers, primarily the lateral trigger values.
Reformulation of Lateral Triggers
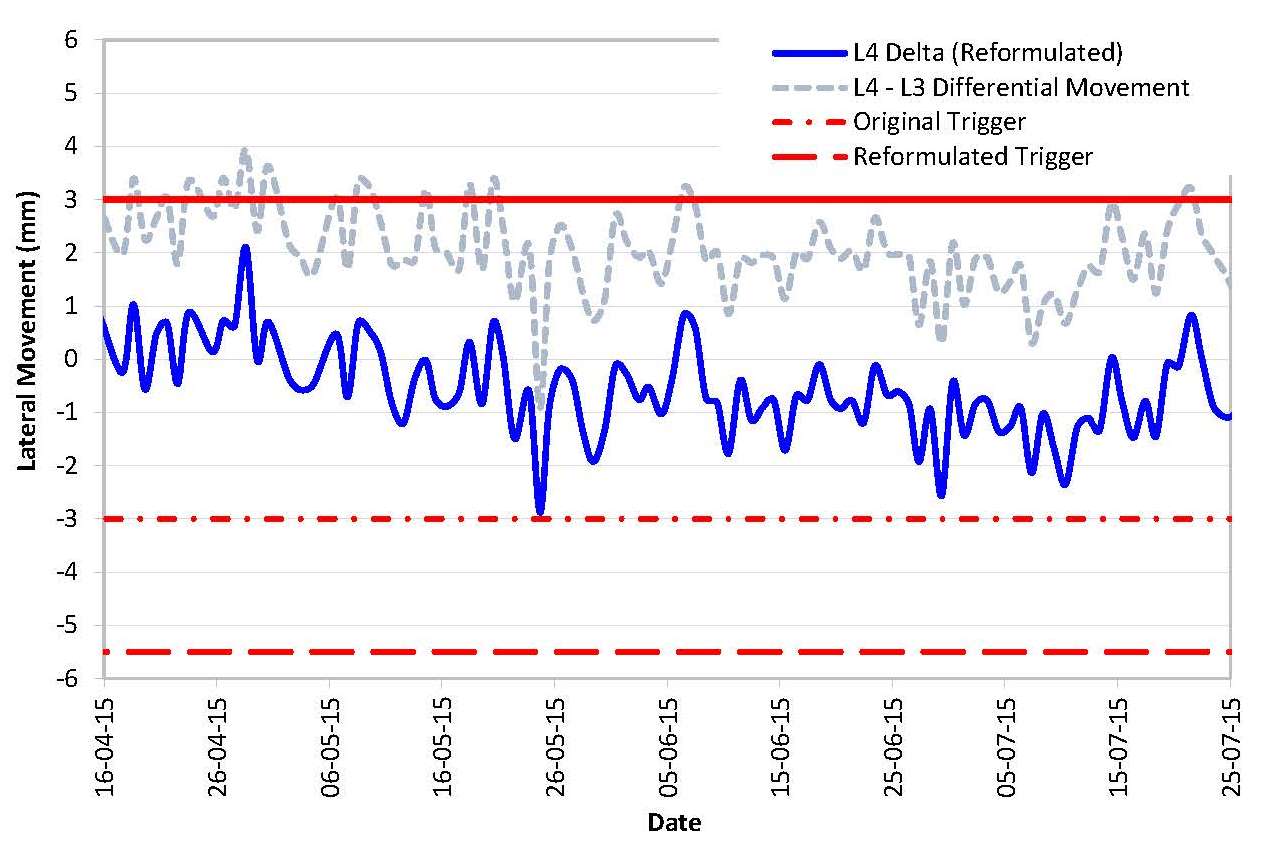
Throughout the phased reconnection and disconnection of dewatering from July 2014, the deck lateral movements were found to be particularly responsive to dewatering activities and very close to the lateral differential triggers, primarily at piers L3 and L4.
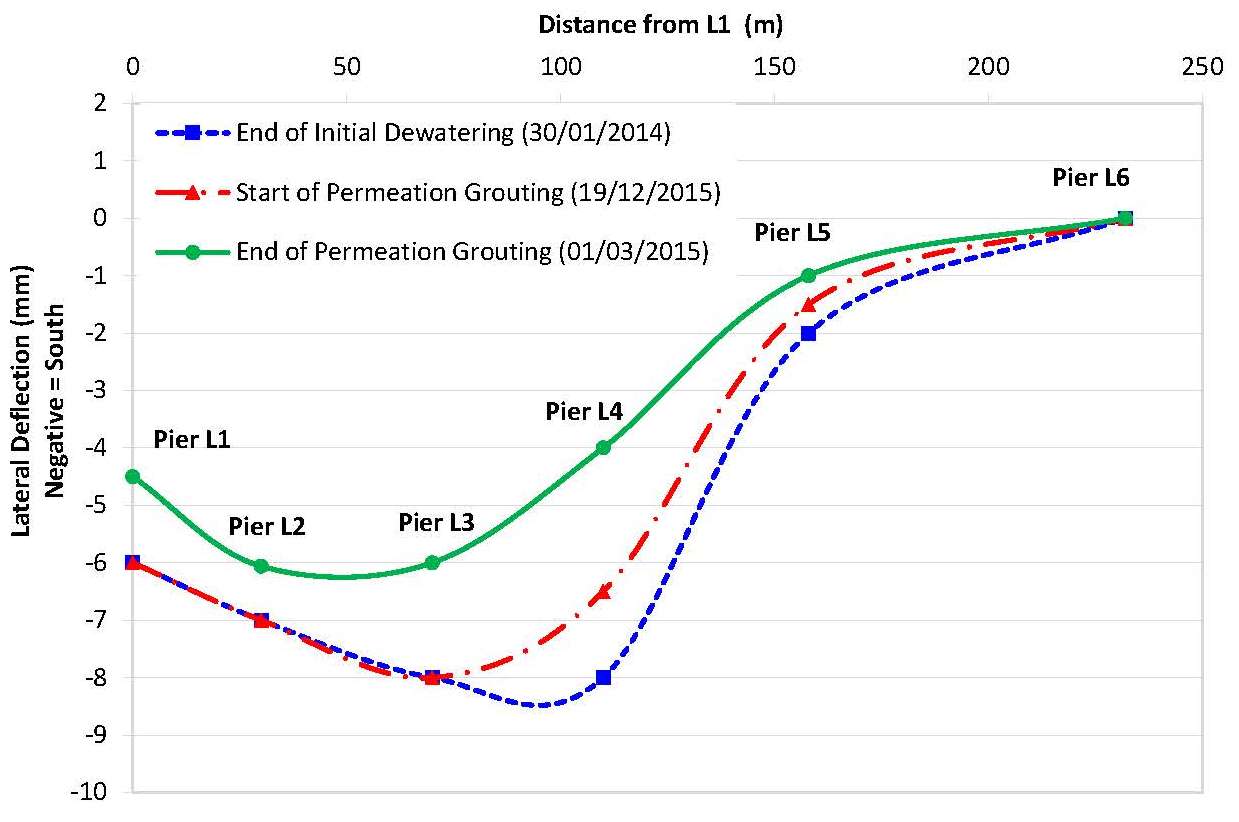
Between January 2014 and up to the end of local grouting in March 2015, the monitoring data showed the deck had moved laterally north, with the overall deflection less than previously recorded. It was further concluded by inspection the induced stresses in the deck were reducing (Figure 7).

Figure 7. Lateral deflection of viaduct
This consequently suggested a need to reformulate the lateral triggers to continue protecting the viaduct against adverse movements, but while allowing additional beneficial movements to occur.
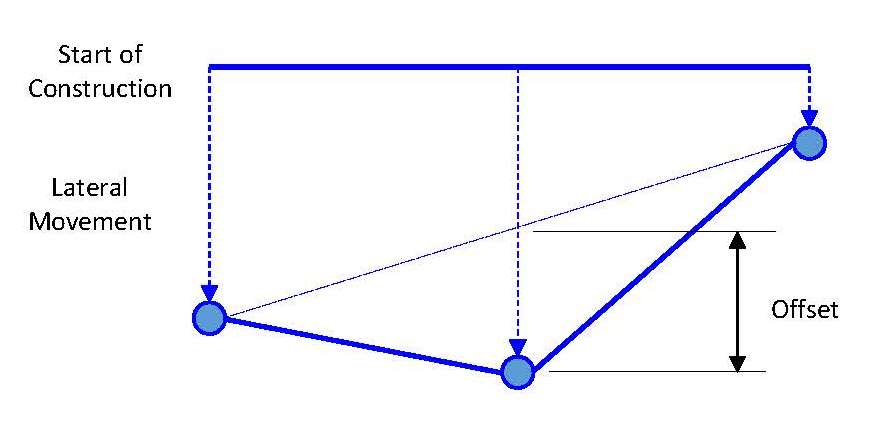
No new analysis was made for the effects of lateral deflections of the deck, but recognising that rigid body rotations of the whole structure would cause no load effects, the trigger levels were reformulated as offsets (typically 3 or 4mm) from a straight line joining the two adjacent piers (Figure 8). The lateral movement of the piers continued to be protected by separate triggers.
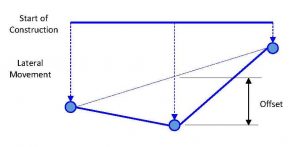
Figure 8. Deck lateral offset
The reformulated triggers provided a clear benefit against the movements that were subsequently observed throughout CP14 construction, with no further trigger breaches occurring (Figure 9).

Figure 9. Pier L4 lateral movement before and after reformulation of triggers
Further Analysis of Dewatering Impact
Upon completion of local grouting and the reformulation of lateral triggers, a further analysis was required to provide assurance the remaining dewatering could be completed without further adversely impacting the viaduct.
At this stage the target levels in the lower aquifer had been achieved, but were to be maintained at steady state without lowering the water levels below what had previously been achieved. Additional drawdown was required in the intermediate aquifer which would potentially generate further ground movements.
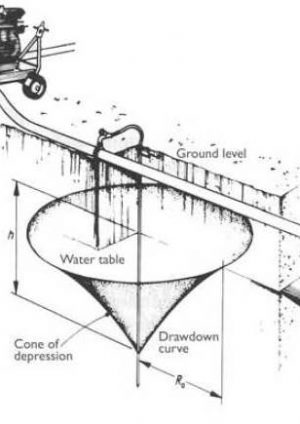
The further analysis was undertaken by developing a simple numerical model to predict movements on the viaduct. The numerical model was based on the methodology presented in CIRIA Reports R113 and C515, to estimate the radius of influence of a cone of depression resulting from drawdown of an ideal aquifer (Figure 10).
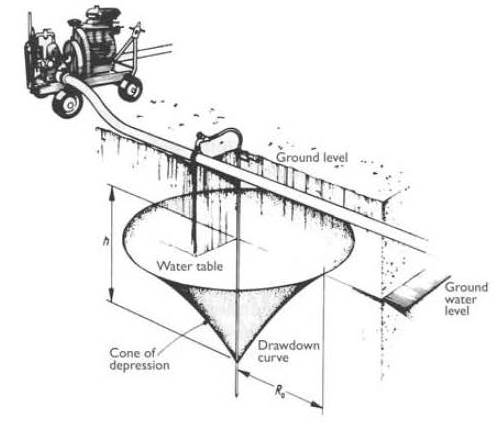
Figure 10. Cone of depression resulting from drawdown (CIRIA R113, 1986)
The model included the following hydrogeological assumptions:
- The aquifer extends horizontally with uniform thickness in all directions without encountering recharge or barrier boundaries;
- The permeability of the strata is the same in all directions and remains constant;
- The aquifer releases water from the storage instantly when the head is reduced.
The model was based on the relationship outlined in CIRIA R113 to calculate the radius of influence, defined as the distance from the centre of cone of depression:
R0 = C × h × √k (1)
Where R0 is the radius of influence
C is a factor related to the type of dewatering
h is the drawdown
k is the permeability of the soil
The settlement due to the drawdown is defined as:
Settlement = (490 × h0 ) / qa (2)
Where h0 is the drawdown
qa is the allowable bearing capacity of the soil
The model was calibrated using monitoring data from the initial dewatering of the intermediate aquifer from December 2013 to January 2014. To enable the model to differentiate the response from the ground to the response of the viaduct, the model was divided into two parts. The first part calculated the ground movements, from levelling studs at ground surface, and the second part calculated the viaduct movements, using the prism based monitoring.
It was found that the observed ground movements over this period formed an asymmetrical elliptical cone of depression around CP14 centre (Figure 11). The cause of the elliptical cone was unknown, but could be the result of local ground conditions or the configuration of the surface ejectors at that time.
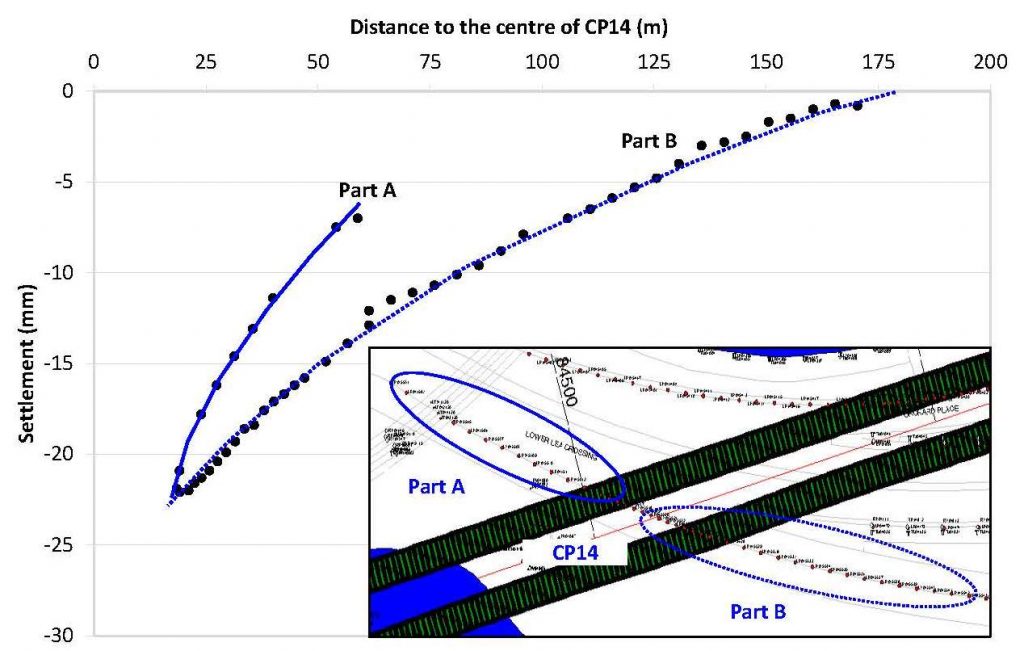
Figure 11. Observed settlement caused by drawdown
Part A of the elliptical cone, which was closest to the viaduct, showed a steeper gradient. The model was therefore calibrated using Part A ground movements which, due to increased differential movements, would have a greater impact on the viaduct.
The calibration of the parameters of the model was performed by iterative calculations which aimed to minimise the differences between the observed ground movements (Part A) and the results calculated by the model. Figure 12 illustrates the calculated ground movement from the numerical model and varying drawdown values.
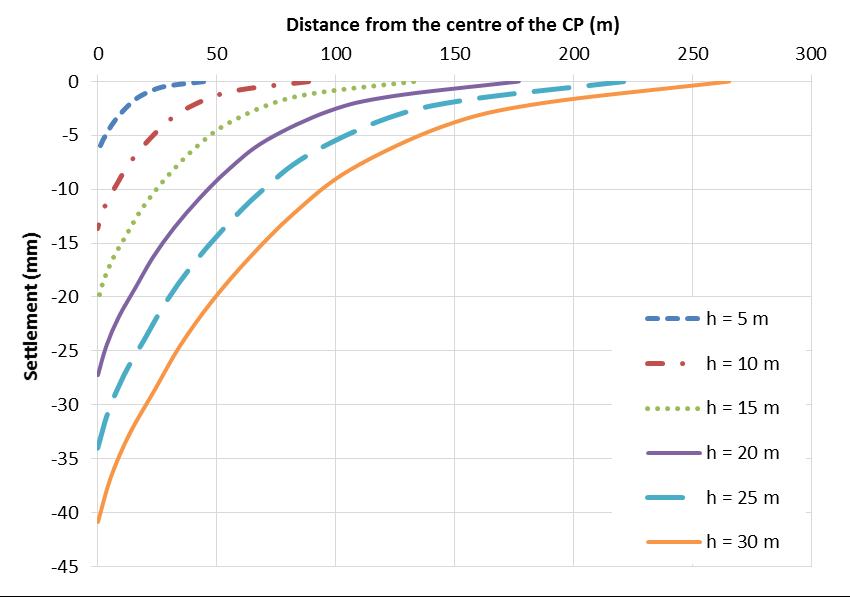
Figure 12. Ground movement calculated by the numerical model using different drawdown values
Once a satisfactory level of calibration was achieved, the model was used to provide a value for the ground movement caused by a drawdown, h, at any distance from the centre of CP14.
At this stage the calibrated model was validated, by increasing the drawdown parameter, for observed ground movements from the initial dewatering period plus the first phase of reconnection from July 2014 to September 2014. Thought the aquifer was treated to be linear-elastic, the effects of recovery during the period from January 2014 to July 2014 were not accounted for. This validation showed good correlation to the observed ground movements (Figure 13).
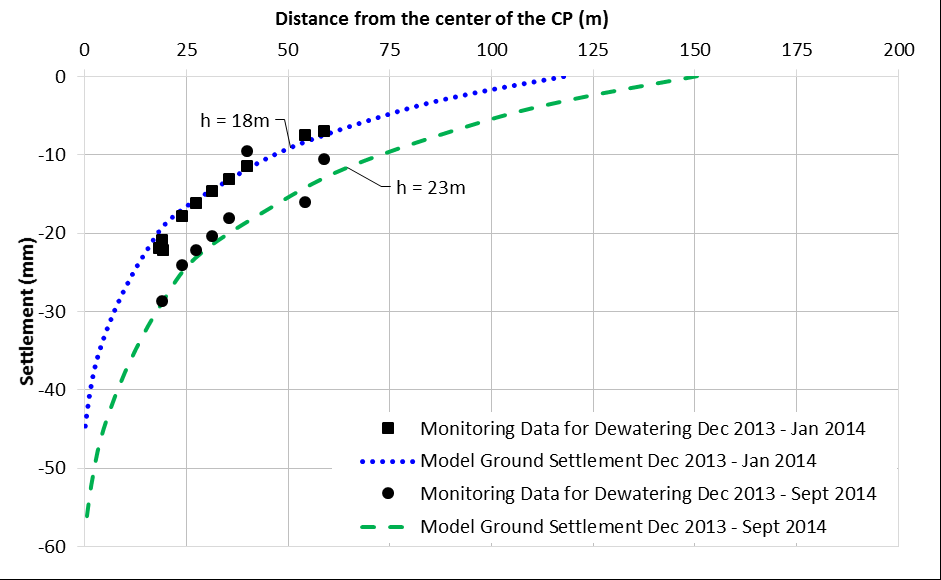
Figure 13. Observed ground movement with drawdown from numerical model
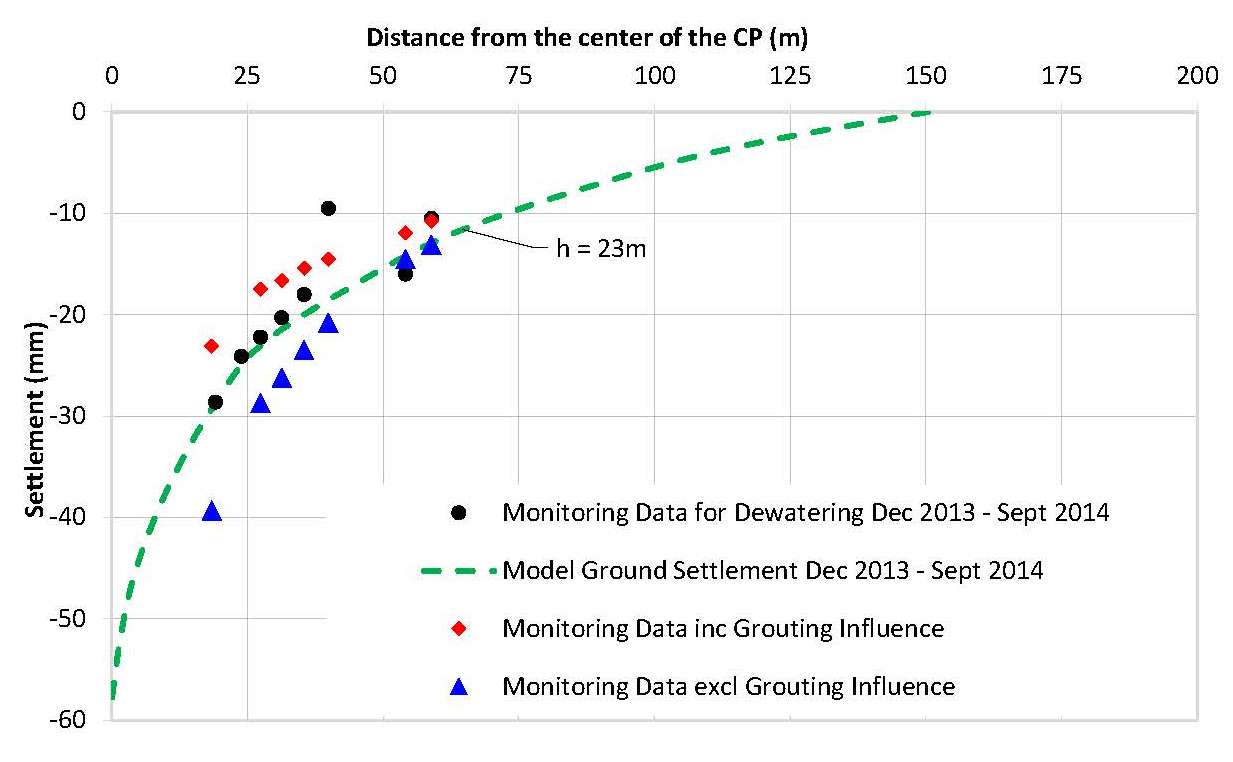
The effects of local grouting were taken into consideration using a simplistic approach. The levelling studs showed signs of heave during the grouting period. The heave, some of which may have also been due to recovery following disconnection of dewatering in November 2014, was removed from the observed ground movements used to calibrate the model. The resulting profile (i.e. excluding grout induced heave) indicated signs of a steeper gradient than what had previously been observed closer to CP14 (Figure 14).

Figure 14. Influence of local grouting on observed ground movements
The calculation of the movements on the viaduct considered that the movement of each pier would be determined by the resulting vertical movements at ground level from further dewatering. Horizontal ground movements were not considered for this analysis.
In order to consider the different foundation types at each pier and how they would respond to further ground movements, coefficients were calculated using prior settlements observed on the structure.
The differential movement of the ground across each pier location allowed the vertical and horizontal movement components of the deck to be calculated. Figure 15 illustrates the longitudinal profile of the deck for the calculated vertical movements.
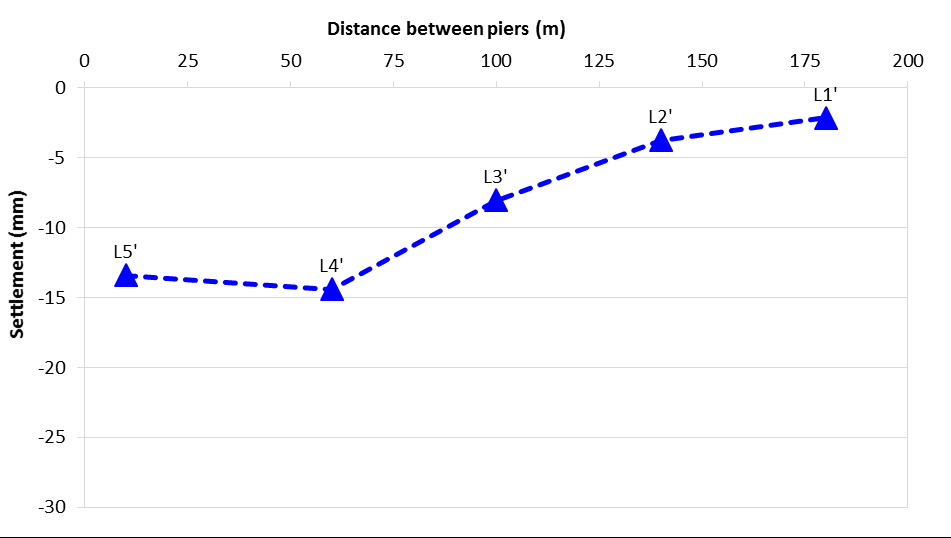
Figure 15. Calculated longitudinal profile of the deck for a drawdown of 25 metres
The deck was assumed to move laterally together with the top of the pier columns. Figure 16 shows the calculated deck lateral movements.
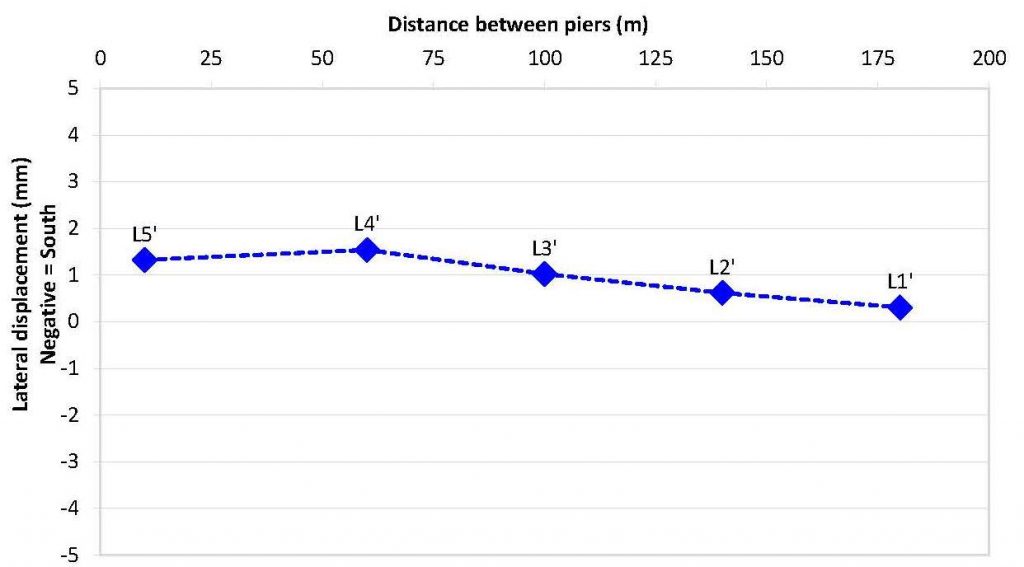
Figure 16. Calculated lateral movements of the deck for a drawdown of 25 metres
The model was used to determine the impact of further dewatering by increasing the drawdown parameter. The model found the viaduct would exceed a trigger with a drawdown greater than was required to be achieved based on the monitored groundwater levels in the intermediate aquifer.
CP14 Construction and Impact on DLR Viaduct
Local dewatering recommenced in May 2015, with CP14 excavation commencing on 25 May 2015 and completing on 13 June 2015. Dewatering was decommissioned on 27 July 2015.
The levelling studs at ground surface indicated a further 1.5mm settlement in the vicinity of CP14 over this period.
The monitoring data on the viaduct showed negligible impact (less than 1mm) in both the vertical and lateral directions between the period of the further analysis and decommissioning of dewatering, with no further trigger breaches occurring.
The observed movements, at ground level and on the viaduct, over this period were less than predicted from the further analysis model for the remaining drawdown. This is likely to be due to the influence of the local grouting which will have altered the local ground conditions and therefore impacted how further ground movements due to dewatering would develop.
Conclusion
This paper presents an insight into the challenges encountered during the asset protection of the DLR River Lea Viaduct during dewatering for cross-passage 14 construction.
After the actual ground movements exceeded the predicted ground movements over the initial dewatering period, a revised assessment was undertaken for the asset protection against further dewatering impact. Greater clarity on the movements experienced by the viaduct over the initial dewatering period could have allowed a more detailed analysis to be undertaken.
The live monitoring data provided an effective tool to control the dewatering activities from July 2014. Through interpretations and analysis the live monitoring data was used to show the dewatering was having a negligible impact on the deck twist. Furthermore the lateral triggers were redefined to allow beneficial additional movement. This proved effective as no further lateral trigger breaches occurred as CP14 was constructed.
The model from the further analysis established a good relationship between dewatering activities and recorded ground movements. This therefore provided an efficient tool to assess the impact of further dewatering by increasing the drawdown parameter. However the model did not consider effects of recovery during disconnection of dewatering. Additional work would be required to examine potential non-linear behaviour associated with phased dewatering.
The further analysis also considered the effects of local grouting through a simplistic approach. Additional work should examine the influence of local grouting where dewatering is to be undertaken through altering the permeability and shear strength of the local ground conditions. This can then be used to determine more accurate ground movement profiles and thus potential impact to nearby third party assets.
References
[1] Somerville, S.H, (1986) Control of Groundwater for Temporary Works, CIRIA Report R113
[2] Preene, M, Roberts, T.O.L, Powrie, W, Dyer, M.R, (2000) Groundwater Control – Design and Practice, CIRIA Report No. C515.
-
Authors