A review of the geology for compensation grouting performance at Bond Street Crossrail Station.
Document
type: Technical Paper
Author:
Christian Dodge BSc (Hons) FGS, ICE Publishing
Publication
Date: 31/08/2016
-
Read the full document
Notation
EPB Earth Pressure Balance
TBM Tunnel Boring Machine
SCL Sprayed Concrete Lining
PTE Platform Tunnel East
PTW Platform Tunnel West
l/m2 Litres per metre square
GI Ground Investigation
TaM Tube a ManchetteIntroduction
Bond Street Crossrail Station is one of 9 brand new stations, 8 of which lie subsurface within the Crossrail central section. These new stations lie along 21km of twin bore tunnels.
Location
Bond Street is situated in Mayfair, the heart of London’s West End. The station consists of two ticket halls constructed from diaphragm and contiguous walling techniques. The western ticket hall is situated on the site of 65 Davies Street and the eastern ticket hall is located on the site of 18-19 Hanover Square. The ticket halls are connected to two platform tunnels which run parallel to the south of Oxford Street and north of Brook Street by a series of ventilation ducts and access passages. The two running tunnels are connected to each other via five cross passages. Four of the cross passages are linked to the ticket halls via escalator tunnels. Figure 1 shows the location of the tunnels.
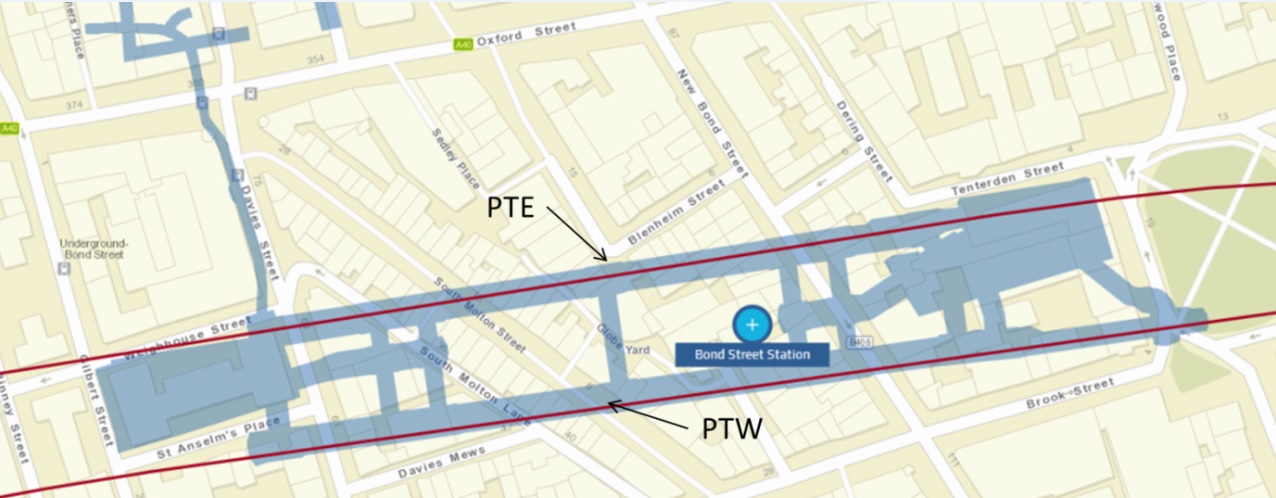
Figure 1 – Location Plan (extract from Crossrail Website) Construction and Sequencing
Station construction consists of secant, diaphragm and contiguous walled ticket hall boxes and reinforced SCL tunnels. Tunnelling works for the platform tunnels (PTE and PTW) are initially formed from reinforced precast concrete segments of the running tunnels constructed by the passing TBMs. These two TBMs use an EPB system which helps to mitigate the consequential settlement from tunnelling. The running tunnels are subsequently enlarged to the designed diameter and lined with SCL.
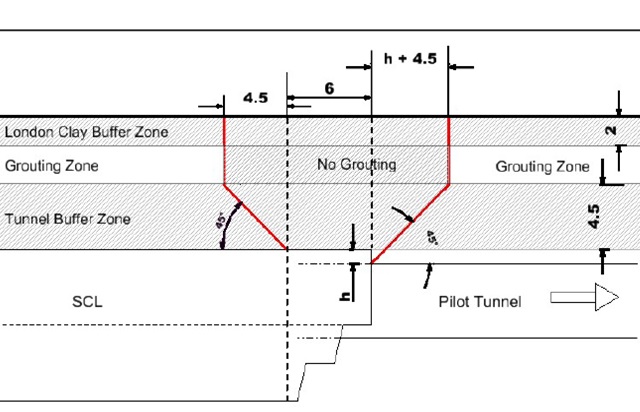
Figure 2 – Exclusion Zone section In order to mitigate the impact of settlement induced from tunnelling, compensation grouting is employed. Figure 2 is a schematic section of the tunnel enlargement and compensation grouting exclusion zone. Figure 3 shows the location of the compensation grouting shafts and TaM arrays.
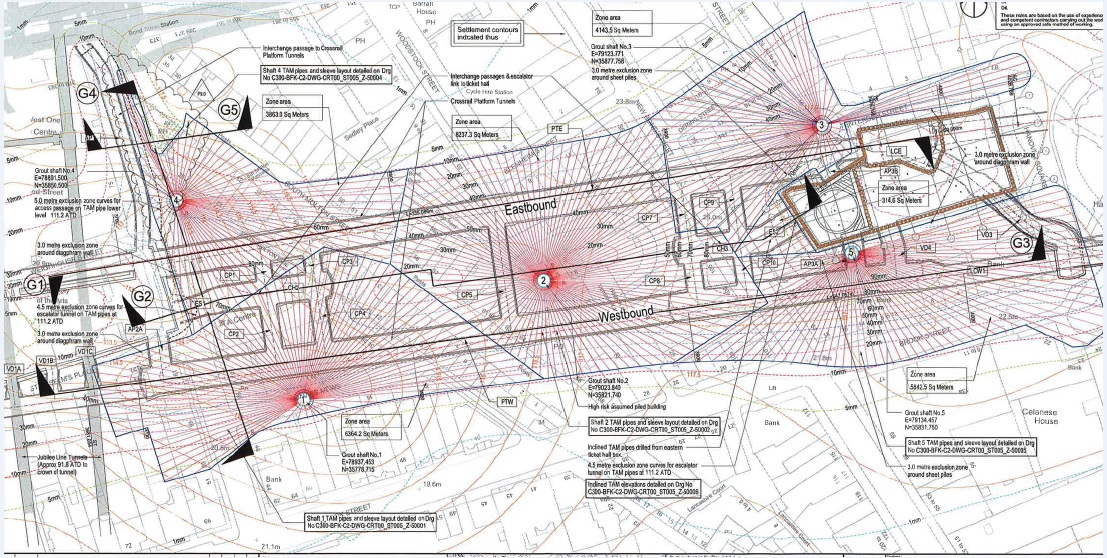
Figure 3 – Compensation Grouting Location Plan Ground Model
The BGS online GeoIndex[3] gives on overall outline of the geology of the wider London area.
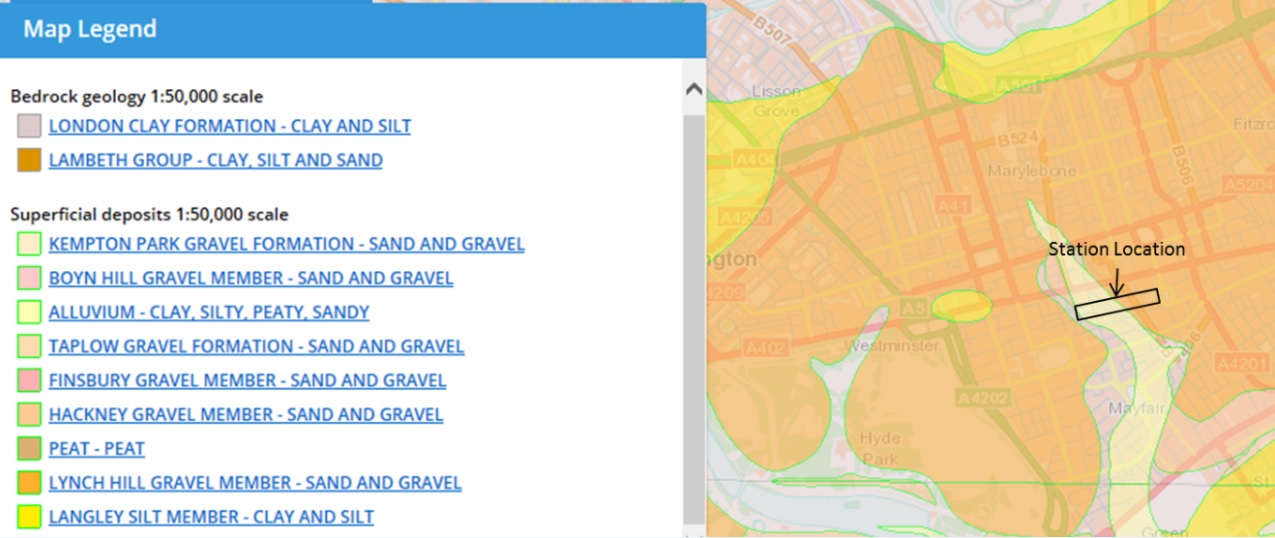
Figure 4 – Geology Map (Contains British Geological Survey materials © NERC. Contains OS data © Crown copyright (2016)) Figure 4 shows the geology of the area around Bond Street Crossrail Station. The map summarises the geology as being Alluvium partially overlying Lynch Hill River Terrace Deposits. This is underlain by London Clay Formation.
Geology
Factual Ground Investigation commissioned by Crossrail covers the Bond Street Crossrail Station area. Figure 5 shows the location of the boreholes undertaken as part of the GI package in relation to the station layout.
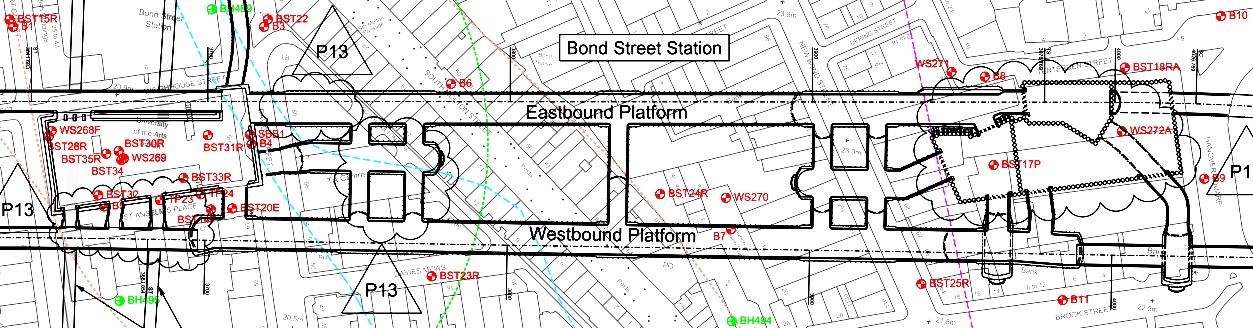
Figure 5 – Borehole Location Plan The boreholes revealed the following geology encountered:
Geology Thickness Description Made Ground 1.2-6.5m Typically associated with current and previous development.Made Ground is usually described as brown sandy clayey angular to rounded gravel of flint, charcoal, brick and mortar, Alluvium 0.6-1.6m Soft light grey mottled reddish brown slightly sandy slightly gravelly clay. Gravel is subrounded and rounded fine to coarse flint. River Terrace Deposits 0.4-3.7m Very loose to very dense light or orangey brown clayey silty sand or sandy gravel angular to rounded with occasional cobbles, flint, brick and concrete.Soft to stiff brown slightly sandy silty clay with occasional medium sub angular flint gravel. London Clay – B 1.7-6.1m Firm to stiff dark brown grey fissured silty clay with rare silt partings and pyrite or flint gravel. London Clay – A3 7.7-13m Firm to very stiff dark grey brown fissured silty, slightly sandy clay with rare mica, pyrite, silt lenses, shell fragments, claystone bands and occasional sand and silt partings. London Clay – A2 8.7-12.7m Stiff to very stiff dark bluey grey laminated fissured mid to dark grey brown silty sandy clay with rare light brown silt dustings on surfaces of fractures. Rare to frequent pockets and partings of light grey and dark grey green silty fine sand, occasional shell fragments, and carbonised wood fragments, pyritised wood and pockets, occasional pyrite nodules. Harwich Formation –Swanscombe Member 0.1-0.2m Very stiff greyish brown slightly sandy to sandy clay with rare lenses of green glauconite, rare burrows infilled with light brown fine sand, occasional rounded fine black flint gravel at the base. Lambeth Group – Upper Mottled Beds 0.4-11m Very stiff to hard fissured brown mottled light grey silty clay with rare pockets fine sand and silt. Lambeth Group – Sand Channel 0.7-12.2m Very dense light yellowy brown slightly silty sand with occasional pockets of clay and rare flint gravel and wood fragments. Excavation for the construction of the tunnelling works at Bond Street was designed to be undertaken in the London Clay.
London Clay was deposited during the Eocene around 50 to 55 million years ago, in a marine environment similar to that of the North Sea today, although much warmer due to much larger quantities of greenhouse gases in the atmosphere.
Although appearing homogenous, King [4] (1981) identified a method of distinguishing four distinct groups A to D and further sub-groups within the London Clay formation. Each division represents a coarsening up sequence with markers of claystone bands, sand partings and variable pyrite content. The pyrite and claystones are a symptom of the diagenesis process following deposition and due to subsequently eroded, large thicknesses of overlying deposits, the clay is over-consolidated.
As well as the burial pressures over time, the London Clay formation has undergone tectonic forces which have resulted in faulting and other discontinuities. Desiccation from later weathering is also responsible for other near surface jointing.
Despite the effects of the post depositional processes on the London Clay, few faults have been mapped. The importance of understanding the magnitude of its fractured and blocky nature is significant, as the stability of the open face during tunnelling is a significant risk to the health and safety of the underground workforce.
An interpolation of borehole data by the sprayed concrete lining designer also reveals a potentially significant post depositional feature in the top surface of the London Clay in the Bond Street Station area. This type of feature shown in Figure 6 is given an encompassing term, a drift filled hollow, although the borehole data is biased in an east-west direction, the elongated nature of the depression shows good alignment with the River Tyburn.
A drift filled hollow is a paleo-surficial depression sometimes formed by periglacial processes and infilled with disturbed superficial deposits and disturbed solid geology.![Figure 6 - An interpolation of borehole data (by others)[5] revealing a depression feature in the top of the London Clay surface.](https://learninglegacy.crossrail.co.uk/wp-content/uploads/2016/11/7E-012-Figure-6.jpg)
Figure 6 – An interpolation of borehole data (by others)[5] revealing a depression feature in the top of the London Clay surface. In addition to this feature, the tunnel designer made reference to potential faulting striking north-west south-east slightly to the west of the eastern ticket hall box. As the geological map indicates by the presence of alluvium, the River Tyburn and its former channels are buried close to the western side of the station area running north-west south-east parallel between South Molton Street and South Molton Lane. It is understood that many of the Thames tributaries in the London area follow the path of a large subsurface displacements.
However, the alluvium close to the surface is not the only evidence of previous and existing fluvial members in this area. The borehole records show the presence of a sand channel within the Lambeth Group Upper Mottled Beds. This granular body has been the focus of further investigation in the Bond Street area which is discussed in the next section.
Previous Literature
Besides that observed during the construction process, Bond Street Crossrail Station is not the only documented tunnelling project to experience larger than expected volume losses in the local area. Standing and Burland, [6] (2007) discuss in detail potential influences for unexpected increases in volume losses during tunnelling for the Jubilee line extension in Westminster. However, the tunnelling method for that instance involved a TBM and was generally slightly higher up the London Clay sequence, very much in sub units A3 and B, whereas at this location tunnelling took place along the A2 A3 boundary. Nevertheless, the St James’ Park case study did use the relationship of shear strength and its influence on volume losses.
The influence of the sand channel in the Upper Mottled Beds had been investigated by Skipper [7] (2012) for the reports of sand ingress into the Jubilee Line tunnels below what was then the proposed western ticket hall box for the Crossrail Station. The concern was both the potential hydraulic impact the sand channel could have on the base of the box structure if there was insufficient cohesive soil cover but also the ongoing maintenance to the Jubilee Line assets. Aside from the sand channel itself, Skipper [7] (2012) noted evidence of displaced levels of the sand channel and other sub-units of the Lambeth Group locally. Other evidence of displacements and potential faulting was also noted not just in the Lambeth Group but also in the London Clay.
Hight et al [8] (2003) describes various features and detailed soil mechanics characteristics of the London Clay from various sites in London and the greater area. More specifically tectonic shears; long linear horizontal bedding plane displacements of up to 40mm thick.
Ground Model specific for Grouting
Prior to construction of the station it was the responsibility of the SCL designer to set out the envelope of compensation grouting above the tunnels for the station based on an interpretation of the borehole information.
Figure 7 shows the proposed envelope available for grouting overlapping the interpreted borehole information for the westbound platform tunnels (PTW).
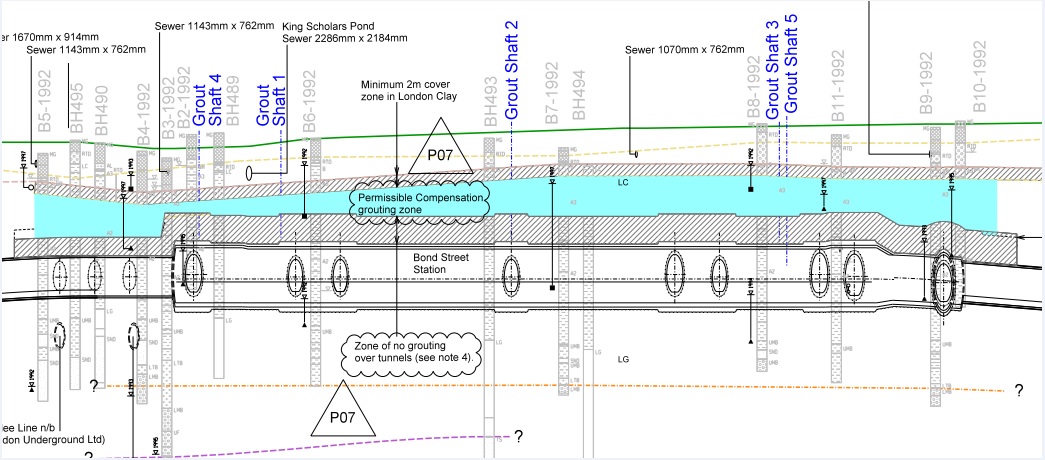
Figure 7 – SCL designers grouting envelope As can be seen towards the western end of the tunnels the thickness of available grouting area decreases which could be linked to the depression seen in Figure 6 but is emphasised further by the exclusion zones above the tunnel and below the top of London Clay.
Observed Geological Characteristics during Construction
As part of the contractor’s remit for keeping the tunnel face stable during construction the shear strength of the soil was tested. The results of the tests for the westbound platform tunnels are shown in Figure 8.
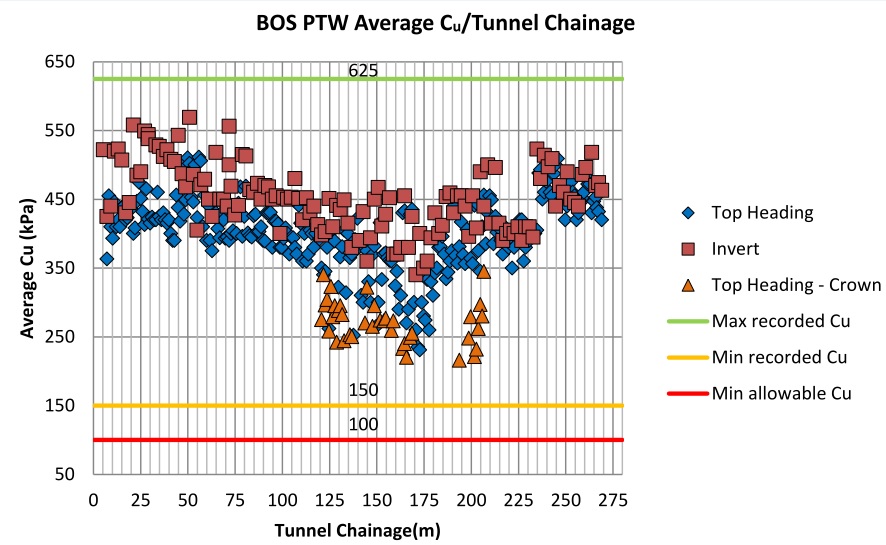
Figure 8 – Observed Shear Strength values of London Clay in tunnel Note the decrease in the crown of the top heading values between approximate chainages 125 and 200 which correlates to an area of increased grouting slightly west of the central cross passage (CP5) along PTW described in the next section.
Sismondi et al [1] (2014) documented various ‘soil wedges’ and ‘greasyback’ features during excavation of the tunnel face, some notably in the area around where the decreased shear strengths and higher grout inputs.
Observed Ground Movements
The ground movements from the construction of the platform tunnels at Bond Street Crossrail Station have been widely documented. Harris et al [2] (2015) note disproportionally higher ground movements in the South Molton Street and South Molton Lane areas close to the westbound platform (PTW). They also make comparisons with the in tunnel deformation, phases of grouting and volume losses specifically in this area.
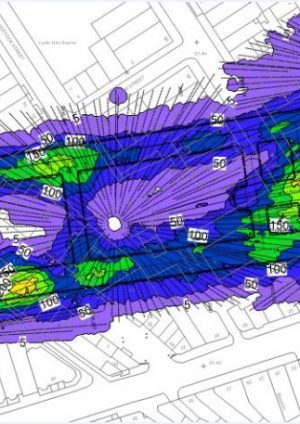
Surface settlement is a direct result of in tunnel deformation at the construction stage and so compensation grouting is applied as mitigation. Figure 4 shows the distribution of grout injected above the Crossrail Bond Street Station Tunnels during SCL construction.
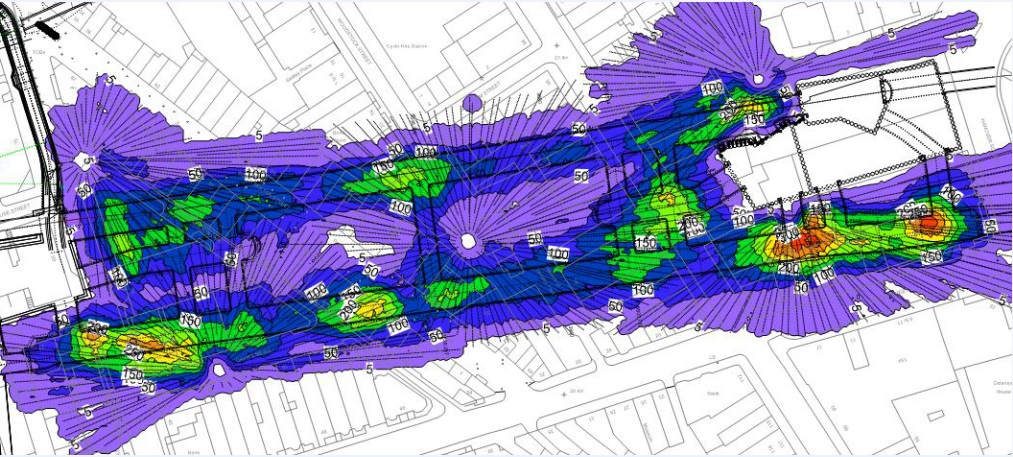
Figure 9 – Grout injected in l/m2 It is clear from the Figure 9, that there are large isolated areas where large quantities of grout were required for settlement alleviation.
The focus here is on the western end of the station where there are two large areas that have required larger amounts of grout than anticipated, one under South Molton Street, which correlates to the previous documented observations, and another slightly further to the west under Davies Street.
Re-intepretation of Geology
In light of the unanticipated variations discussed already, possible explanations were sought by revisiting the site investigation data. Figure 10 shows the positions of two sections with the locations of the boreholes from the ground investigations.
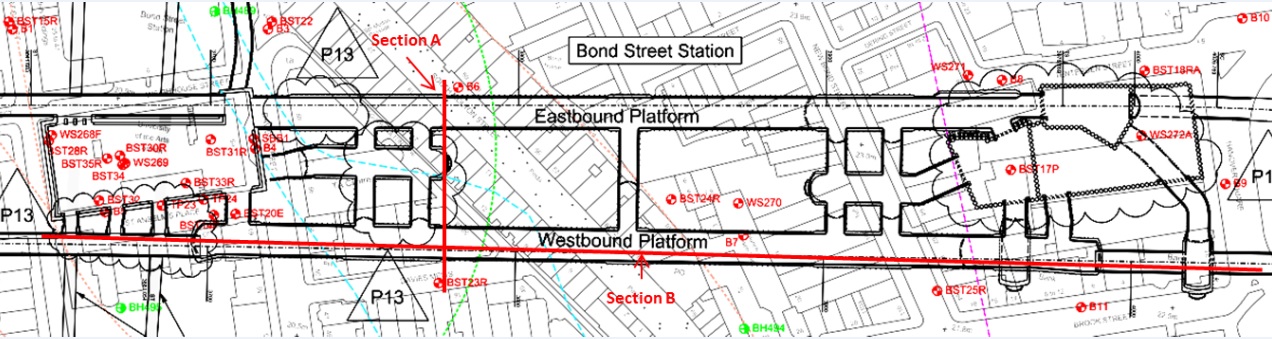
Figure 10 – Plan of geological sections The reasoning for section A is to look at the geology across South Molton Street and South Molton Lane to try and interpret the geology in relation to the tunnels, the grouting array levels and the exclusion zones. Section B was to re-interpret the geology of PTW by reviewing the nearest boreholes where the alignment of the tunnel lies in relation to this, the level of grouting arrays and top of London Clay for the grouting exclusion zones.
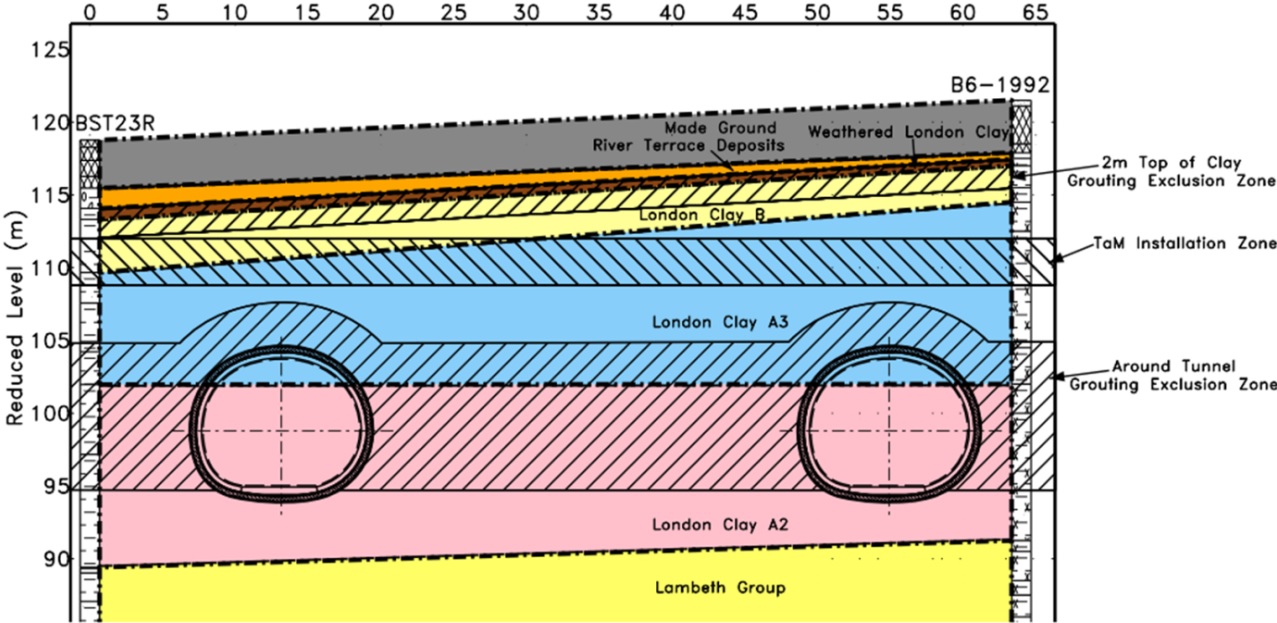
Figure 11 – Geological Section A under South Molton Street and South Molton Lane The interpretation in Figure 11 shows the interpreted geology from the borehole data with the tunnel, compensation grouting and exclusion zone levels superimposed. The top of London Clay decreases southwards towards the PTW tunnels and with it the exclusion zone very close to the level of the Tube a Manchette (TaM) array, again correlating to the diagram in Figure 6. The interpretation also reveals the London Clay Unit B dips and thickens slightly into the grouting array from North to South above PTW.
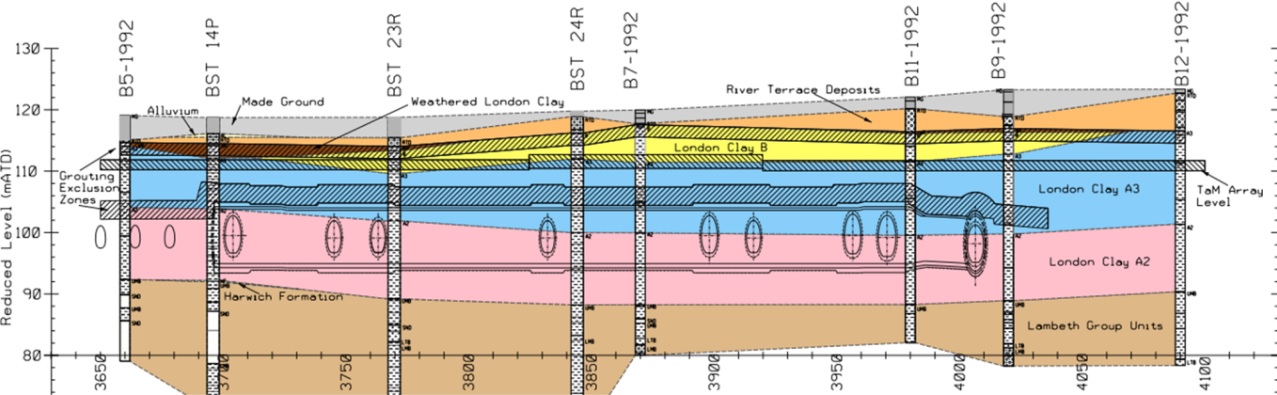
Figure 12 – Geological Section B through PTW The re-interpreted geological section through PTW reveals a larger gap between the upper and lower exclusion zones even though the level of the top of London Clay decreases towards the western end. Nevertheless, the TaM array level sits just a few millimetres below the top of London Clay exclusion zone near where the increased grout quantities were reported. The interpretation also show the London Clay Unit B dips slightly into the grouting array from East to West above PTW, again close to where increased grouting took place. There is also a layer of weathered London Clay below Davies Street above the PTW tunnel and although very close this layer does not reach deep enough into the TaM array.
By contrast, the top of the Lambeth Group rises towards the western end of PTW. So too does the London Clay A2 unit which was proven to be the case from the geological reporting during construction. Interestingly in this area the borehole logs detail the sand channel within the Upper Mottled Beds which was reported to be causing maintenance issues for the Jubilee Line.
Closer to the surface it’s noted that the thickness of geology above the tunnels and TaM array increases eastwards, as does the gap between the top of London Clay exclusion zone and the compensation grouting levels, again this is to be expected given the contours in Figure 7. Alluvium is observed in the boreholes below Made Ground at the western end of PTW. This ties in reasonably well with the River Tyburn which is known to run close by.
Borehole and testing data
The descriptions in borehole BST23R reveal possible reworking in the River Terrace Deposits above the London Clay. This may indicate the process involved in the formation of the depression in the London Clay or could be a by-product of the former River Tyburn.
Descriptions of the weathered zone of London Clay, close to the surface noted in the interpreted sections, detail a series of randomly orientated, extremely closely spaced, curviplanar, tight fissures. Weathered London Clay isn’t restricted to the area in the geological sections. In other places it is noticeable soft, and the descriptions regularly mention it being disturbed, while some notice an orange mottling. Given orange is a colour reflective of ferric oxidation and seen in the fluvial superficial deposits, this could be signs of some fluvial reworking in this layer.
BST23R, which is interpreted on the both geological sections, notes similar fissuring in London Clay Unit B to that seen in the weathered areas of the same formation. In addition, Unit B is also described as having dustings of silt along its fissures, and further down the sequence into A3 these fissures form an orientation and regular dip angle of 40-80° but appear polished. Also noted in this unit are partings of sand inclined to similar angles. However, further down this same unit the angles of the partings decrease to almost horizontal. BST14P reports zones of core loss, clasts and blocks of clay less than 5mm in size all in the A3 unit above the tunnel exclusion zone for grouting.
Compared to the other borehole information along PTW fissuring isn’t uncommon. However, much of the other boreholes don’t recognise any form of common inclination in the fissuring or partings.
There is a noticeable discrepancy from the number of boreholes in the location plan and those used in the contour plot of the top of London Clay, with some missing from the latter. The majority of these are located in the area of the western ticket hall box and were undertaken as part of the work done by Skipper [7] (2012). Nevertheless Figures 13 and 14 are from another contour plot of the same surface which incorporates these holes.
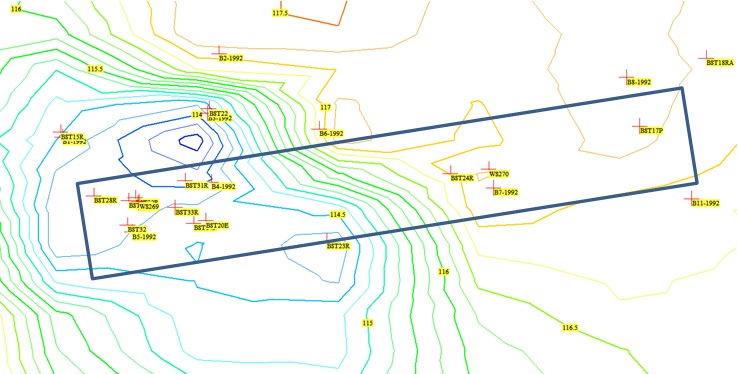
Figure 13 – 2D contour plot of the top of London Clay Formation with the additional boreholes 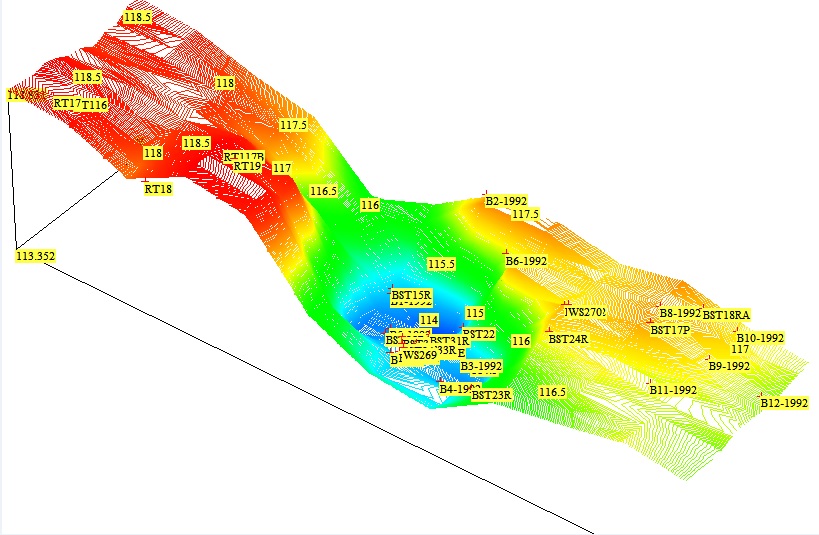
Figure 14 – 3D contour plot of the top of London Clay Formation with the additional boreholes The borehole data indicates a distinct lack of River Terrace Deposits in the depression feature. This raises doubt as to whether this is a drift filled hollow such as a pingo or possibly a scour hollow.
Shear strength testing was undertaken during the site investigation stages and compared with the same data from Tottenham Court Road station. The strength data from the TaM array levels from both sites are compared in Figure 15.
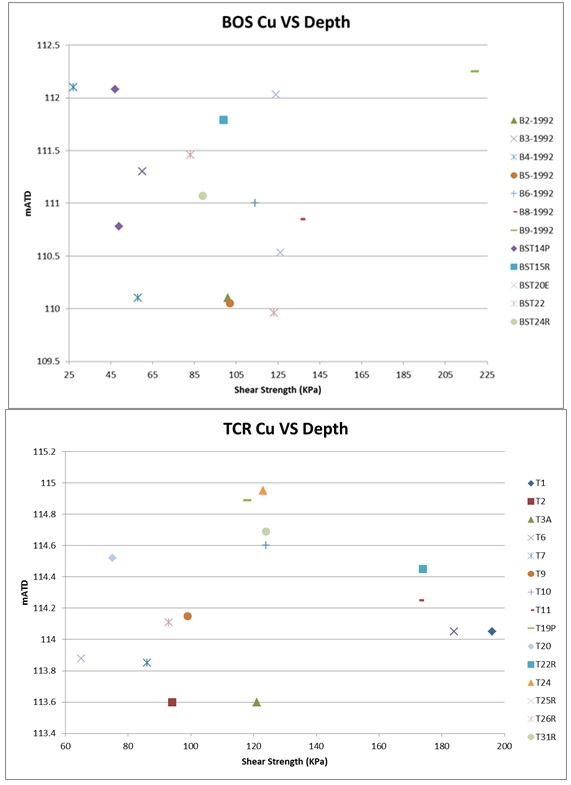
Figure 15 – Shear strength from in grouting array levels at Bond Street and Tottenham Court Road Stations Although the upper ranges at Bond Street are similar to the lower ranges at Tottenham Court Road, it is clear from the data that generally the London Clay in which grout was injected had higher shear strengths at Tottenham Court Road than at Bond Street Station.
Another noticeable trend was the shear strengths closest to the notional position of the Tyburn and depression feature are lower than those from boreholes furthest away.
Discussion
Previous studies have revealed a number of interesting features in the London Clay and it is clear that some mechanical characteristics have an influence on the ground movement response to tunnelling and compensation grouting.
It is clear that at Bond Street there are sporadic areas where large amounts of grout have been injected to compensate for the settlements induced from SCL tunnelling. In order to try to grasp the potential reasoning for these large quantities, it is important to understand firstly the construction process and the implications of this on ground movements and where the largest settlements are likely to take place, but also the nature of the geology of the wider area and also the ground conditions in which construction is taking place.
The geological data for the overall area displays a series of interesting features. A sand channel in the Lambeth Group, which from the borehole information has been faulted at some point. Initially the impression is that this faulting may have occurred during deposition. However, it may be that the fault has been captured in the boreholes and hence shows a sequence repetition. B5-1992 shows a good example of this and can be seen in Figure 12.
It would appear that faulting isn’t only seen in the Lambeth Group but also the London Clay and possible indications of this are well detailed in borehole BST14P and BST 23R, and the depths for this evidence coincide closely with the levels where grout has been injected. The designer for the SCL picked up on faulting from third party information in their design reports but this is thought to be further towards the eastern end. Faulting isn’t uncommon in the London Clay as the abundance of fissuring is likely due to a combination of its brittle nature and previous tectonic forces.
The designer also noted a depression in the surface of the London Clay and detailed it as a scour hollow rather than a drift filled hollow due to the lack of superficial or River Terrace Deposits (drift) within it. The interpreted geological sections reveal that as a consequence this leaves little London Clay between the grouting array and the upper exclusion zone. With the additional boreholes the shape and the extent of the base of the depression can be seen.
The geology above the London Clay highlights the possible previous courses of the now culverted River Tyburn.
Therefore to understand the possible cause of the increased requirements of grout during construction it must be discussed how these geological features could be linked.
During the quaternary period there would have been times when this area would have experienced periglacial conditions. This is evident from similar depressions in London geology which have been linked to the relics of periglacial features such as pingos and massive ice seen today in higher latitudes of Greenland and Canada.
It could be conceived that the initial cause for the hollow could in fact be the sand channel in the Lambeth Group. In a periglacial environment the ground water held in the buried sand channel may have become frozen, expanding forcing the ground upwards towards the surface causing the overlying London Clay to be lifted also, perhaps even causing it to fracture and fault. If the frozen ground water within the sand channel were to be within the active layer then there may have been seasonal expansion and contraction causing further deformation of the above London Clay.
Alternatively the sand channel could have been a source of the hydrostatic water required for a closed system Pingo using existing fissures or faults in the London Clay. The inclined sand partings found in BST14P and BST23R could be evidence of this.
Of course thawing from the subsequent warm period could mean the dome would collapse or if the water had penetrated through to the surface during freezing then this could have the same affect leaving a depression in the surface. This could also leave localised faulting and fissuring. The following warm period would produce large amounts of meltwater removing any infilled material into the depression even eroding it further. Therefore there are small amounts of evidence to suggest it could be both a scour and a relic Pingo.
Aside from the possible processes for the creation of this depression feature there is a key observation that brings into doubt that this feature is a direct cause of the sporadically large amounts of grout injected above PTW. PTE at the western end is below the lowest point of the depression feature yet the amount of grout injected is relatively low by comparison.
The low shear strength noted in the GI data could also be the result of fissuring and faulting as the U100 samples could already contain the pre-existing shear planes. As the shear strengths measured during construction are much larger than those tested during the GI, this was due to samples in tunnel being measured with a dial penetrometer on lumps excavated from the tunnel face, hence no existing shear plane on the samples.
Conclusions
The following points can be made:
- The formation of the depression feature in the top of the London Clay could be a relic of a Pingo of either system and potentially subsequently scoured.
- Low shear strengths are not a direct cause of poor ground movement responses to compensation grouting. Other processes associated with the potential causes of this could be a contributing factor to this by-product.
- There isn’t enough evidence to suggest that the depression feature and therefore low clay cover above the grouting array is also not a direct reason for poor ground movement response to compensations grouting. A primary reason for this is a relatively low amount of grout injected at the western end of PTE where the depression is at its lowest.
- The fault described by the designer at the eastern end could have contributed to the migration of grout and therefore excessive quantities injected above PTW in the eastern area.
- The most probable reason for the large amounts of sporadic grout injected are due to the migration of grout along pre-existing faults and fissures produced by or as a result of the mechanism for the creation of the depression feature.
References
[1] Sismondi, S. Potts, V. Weinmar, W (2015). Observed differences in the behaviour of the London Clay sub-units during SCL works for Bond Street Station and Tottenham Court Road Station (C300/410). Crossrail Project: Infrastructure Design and Construction – ICE Publishing Ltd
[2] Harris, D I. Sismondi, S. Weinmar, W (2015) Review of Ground Movements during SCL Tunnelling in an Urban Environment – ITA WTC 2015 Congress and 41st General Assembly, Dubrovnik, Croatia.
[3] British Geological Survey. GEOINDEX ONSHORE http://mapapps2.bgs.ac.uk/geoindex/home.html
[4] King, C. (1981). The Stratigraphy of the London Basin and associated deposits. Tertiary Research Special Paper 6, Rotterdam: Backhuys.
[5] C121 SCL Tunnels – Bond Street Station Geotechnical Design Report – Part 2 Geotechnical Design Summary C121-MMD-C2-RGN-C125-00002, Rev 2.0
[6] Standing J. R. Burland J. B. (2007). Unexpected tunnelling volume losses in the Westminster area. London. – Geotechnique 57, No. 1, 11-26.
[7] Skipper J, (2012). Report on the ingress of water and sand into the Jubilee Line tunnels in the Bond Street area – Unpublished technical report prepared for London Underground
[8] Hight D W, F McMillian, J J M Powell, R J Jardine, C P Allenou. (2003). Some characteristics of London Clay – Characterisation and Engineering Properties of Natural Soils. Tan et al. (eds.), Swets & Zeitlinger, Lisse, Vol.2, 851908.
-
Authors

