Review of Monitoring Methods at Three Crossrail Stations
Document
type: Technical Paper
Author:
Peter Hewitt, Celina Peeters, Robert Roles, Ben Brewster
Publication
Date: 10/11/2015
-
Read the full document
Improvements in Installation Methods
Inclinometers are widely used in tunnelling projects as one of the most accurate ways of monitoring relative movements in piled shaft walls. However, the standard method of installation, grouting a grooved plastic pipe into a reservation tube can be prone to difficulties. The use of plastic piping was originally developed as it is cheap to produce, easy to produce to tight specifications and would not be stronger than the surrounding ground when trying to monitor a deflection in soft or unstable ground. When installing an inclinometer into a pile the strength of the materials is not of significant concern and normally involves the installation of a 150mm steel reservation tube which is installed at the time of concreting the pile, which is then followed on by grouting in the standard inclinometer tube at a later date.
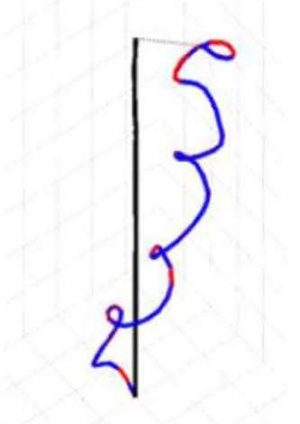
Two problems occur with this installation method; the first is that levels of reinforcing in piles is on the increase as the desire for stiffer piles occurs. This means that in many piling situations there is insufficient space to fit a 150mm reservation tube whilst still correctly pouring the concrete into the pile. The second issue is ensuring the inclinometer tube is correctly grouted into the reservation tube. As the inclinometer and pile get longer so the risk of gapping in the grout or snaking in the inclinometer tube increases. Snaking is where buoyancy within the inclinometer tube causes the pipe to spiral up the reservation tube and can cause inaccuracy with the inclinometer readings.
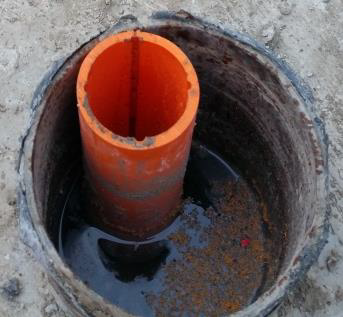

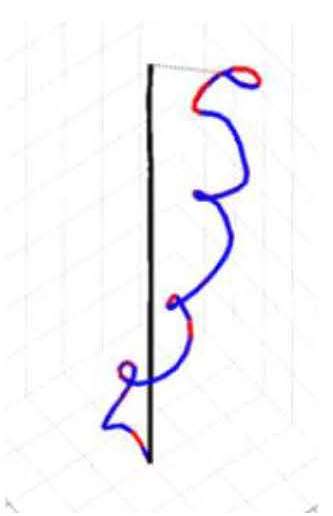
Typical Installation Detail Impact of spiralling 3D Plot of Spiral Install The picture above shows a typical inclinometer installation, with black reservation steel reservation tube, orange inclinometer tube and the gap between grout filled. The extract of a an inclinometer graph above shows the impact of spiralling with a 15mm deviation over a 4 to 5m depth. To overcome these issues and based on experience in Spanish rock quarrying, it was proposed to replace the three part standard installation with a single square section steel tube. The corner angle of the square section providing the groove channels for the inclinometer probe or IPI installation.
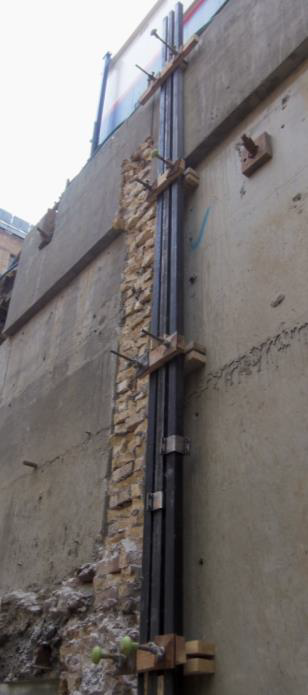

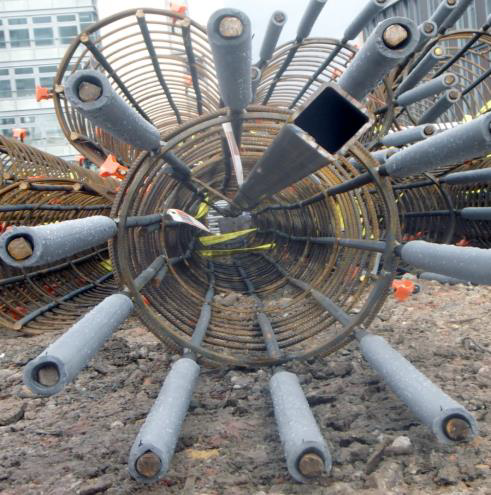
Trial Arrangement Trial Plot Typical Pile Cage Installation Crossrail agreed to allow a trial to be undertaken by installing 3nr square section tubes against an existing wall to allow checks to be made to demonstrate that the use of the square section tubing would provide the necessary specified accuracy.
The trial of the square section steel tubing was successfully completed. The maximum recorded variation from the baseline was 0.63mm and the maximum variation between readings was 0.73mm. These values all fall within the machine specified accuracy and the CRL KX10 specification. The accuracy and repeatability of the readings was further demonstrated by the ability to identify the thermal expansion of the tubing which occurred between readings taken in the morning and the afternoon. The trial has satisfactorily demonstrated that the Square Section Steel Tubing provides a suitable material for use as Inclinometer tubing. Interestingly the greatest variation which was recorded can be seen on the plot above and was caused by thermal expansion generated when the wall on which the tubing was clamped went from shadow to sunlight. The bowing in the profile is where the tubing was clamped on the wall. Clearly this level of thermal expansion will not occur when the tubing is embedded in concrete.
Following the successful trial Crossrail gave approval for the use of the square section tubing. Since the trial in 2014 this system has been installed in over 15 other projects. Because the installation can occur off site during the reinforcing cage construction it provides a safer and cheaper installation which in many cases is less prone to installation difficulties, so providing more accurate readings. When utilising instrumentation which has been developed for the geotechnical environment, care needs to be taken to ensure installation is modified to suit the construction environment.
Manual and Automated Inclinometer Readings
The Blomfield Box at Liverpool Street was excavated to a depth of 43m and was constructed using top down construction techniques, with an excavation depth on average of 5m between levels. Both automated and manual inclinometers were installed in the shaft.
Shape Arrays were used to provide the automatic inclinometer data. Providing data on an hourly basis (reduced from an originally specified 15min cycle). Manual monitoring was undertaken in inclinometer tubes in adjacent piles using a standard manual inclinometer probe. Manual readings were taken at the beginning and end of each level dig.
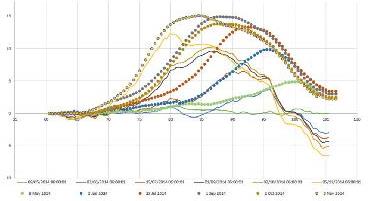
The maximum recorded deflection from the inclinometers during the shaft excavation was 22mm. The maximum rate of deflection during the excavation was 0.5mm/day. A comparison of manual and automated results is given below.
A number of observations can be made on these results. All of which come with the benefit of hindsight.
The automated inclinometers were found to have a recorded instrument error of +/- 2mm over a days recording. This was within the accepted instrument error as specified and based on an up to 51m length is not unacceptable. However, when the movement between 5m dig levels was generally less than 5mm over the 2 week dig period, this meant that early in the excavation a significant amount of effort was expended in looking at instrument error.
Typical Inclinometer Fluctuation
These movements were at or below predicted movements so the rate and extent of movement was not unexpected. During excavation work data was initially submitted showing hourly results, this quickly was reduced to data every 6hrs and then towards the end of the dig this was reduced to data from once a day. These changes were made to allow a clear view and understanding of the data.
Had the automated monitoring system been replaced with daily manual inclinometer reading the cost would have been about equivalent. However, if the manual monitoring was reduced weekly during the no dig periods and daily during dig periods the cost would have been reduced by three quarters saving several hundred thousand pounds on this one installation alone. Just because automated monitoring can be done, doesn’t mean it should and the frequency of monitoring should be matched to the expected rate of movement with the accuracy of the automated systems should be taken into account.
Comparison of Automated and Manual Geodetic Data Collection
With the increased demand for geodetic monitoring on construction sites, particularly those which interface or pose an integral threat to nearby buildings, services or infrastructure, the use of automated solutions is growing in relation to its traditional, manual counterpart. One such solution that has experienced a distinct increase in popularity with the progression of the Crossrail project is the automated total station – or ATS – system.
ATS systems facilitate the remote control of either a single, or multiple networked total stations, from a central control. The instruments are fixed in position and observe distance and angle measurements to survey prisms installed at pre defined locations, with a view to determining trends of movement over time.
The appeals of such a solution become evident when the limitations of a similar, manually operated monitoring scheme are considered. In theory, when establishing an automated monitoring regime, the only time a technician should have to enter the work area is when setting up the instrument and undertaking essential maintenance. From this point, every connected total station can be remotely – and automatically – operated by a control computer off site. Essentially, a surveyor who may have in the past spent a long time on site measuring points can now observe and operate an entire network of total stations without leaving the office. In turn this has health and safety benefits, and the potential to reduce costs for a large scale monitoring programme.
Furthermore, an automated system allows for 24/7 monitoring irrespective of staffing constraints, site limitations and even – in most cases – the weather.
These are a few of the many reasons that design consultants have chosen to embrace ATS systems for their projects on Crossrail, which incidentally includes the largest network of automatic total stations in operation in Europe, at Paddington Station, however it is not necessarily the case that automation is always the best option. One case that highlights this fact well is the monitoring of the Docklands Light Railway track at Custom House. The information gleaned from this system, which is actually a small part of a much larger network of ATS’s, has been used to determine the effect of nearby construction works at Custom House station on the track and structural station elements. Due to the safety critical nature of the scheme, trigger values were established for alarms relating to horizontal and vertical movement of all elements and relative movement of adjacent track points (cant and twist). As a rule, any breached
trigger value had to be treated with the utmost attention by all parties involved.During the course of the construction programme, triggers were breached quite regularly, and each time had to be investigated. In most cases it was found that the recorded displacement values were not indicative of true movement, and were instead reflective of the numerous sources of error evident in such a system. Mostly these errors were introduced away from the site location, and transferred in via the network. These errors included damage or poor quality of reference prisms – leading to inaccurate resection, debris and dirt on the face of monitoring prisms, trains blocking sight lines to reference prisms and excessive vibration caused by railway traffic. For these reasons, during works that presented a particular risk to the integrity of the railway, the ATS system could not be relied upon for purposeful readings, and a more traditional approach was adopted. Given that these works could only be undertaken during times in which trains were not running, it was possible to have a surveyor perform manual readings to fixed points on the track and platform using a digital level. The frequency of these readings was determined prior to the commencement of the works, and included both an initial reading prior to work beginning and a closeout reading following completion of the works ready to hand the site back to DLR. In practice, this methodology allowed for
the specific monitoring of a key location, at a frequency sufficient to detect excessive movement before posing any risk to site personnel or the public. No points were missed out, and a number of check points were established to confirm the expected accuracy of the survey, with +/-0.2mm repeatability at each instance of the survey.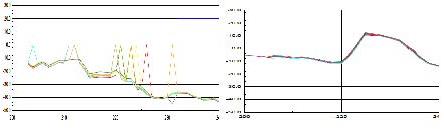
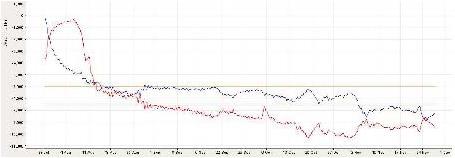
Automated Monitoring Graph Manual Monitoring over the same Chainage The example above is of a comparison between Automated and Manual monitoring of the same section of track is given below. Ignoring the difference in baseline starting deflections, what is highlighted is the number of “spike” readings which can be seen on the automated graph, which is absent from the manually derived data.
Overall at Custom House no movement of the track could be determined from the Crossrail Station construction. Any movement which was observed was down to maintenance work undertaken by DLR, including Kango packing the rails.
Clearly, ATS systems have many advantages over manual methods of monitoring, however as with this example, there are occasions in which automation may not be the best solution. Or perhaps when a system is referred to as automated the extent to which manual maintenance is required to continue the automated operation is often underestimated. With the added benefit of specificity, immediate (on site) error checking and the ability to mobilise quickly, manual monitoring should always be a consideration.
Strain Gauge Monitoring and Thresholds
At C502 during the construction of the Blomfield Box concrete beams were installed at each level. This consisted of nine permanent beam locations, site installed concrete embedded strain gauges in clusters of four per position. The gauges were arranged with one in each corner of the concrete member allowing bending strain to be eliminated by averaging the individual measurements. This gives a good accuracy for measuring axial load.
Monitoring data for the reinforced concrete props was collected from the moment the concrete was poured. Raw data included the gauge temperature and the vibrating wire frequency. The post installation strain was calculated according the characteristic performance for the type of strain gauge: = k(f-f0) where k is the gauge factor. The assumed load can then be calculated by applying the stiffness of the concrete and area of the prop.
Observations of the data showed interesting behaviour related to the R.C. props, which needs to be taken into account to obtain accurate information about the load. The following four effects are identified as requiring specific attention, in order to correctly interpret loads from strain gauges readings.
1. Temperature response of the system.
Vibrating wire strain gauges are temperature sensitive in a predictable way. When the vibrating wire heats up, the length increase, tension drops and the frequency falls. This will appear as a compressive strain to the gauge. In addition, as the prop temperature increases, there is a tendency to push against the pile wall, inducing some real axial compression within the prop as the expansion is restrained. This would be invisible to the strain gauges, as there is no accompanying strain. In the real system, the walls are flexible and therefore the props can expand to some extent, which will appear as tension to the strain gauge.
2. Temperature differences within the prop.
The prop itself has a considerable cross-sectional area, and therefore sizable temperature differences across the section. The strain gauges are located at the surface, and with no information about the average temperature of the member, it is difficult to accurately measure thermal strain and loads. When the concrete is curing, the temperature difference will be the largest but also particularly sunny days can affect the accuracy of the readings.
3. Changing stiffness of the prop.
When the baseline readings from the strain gauges are taken, the wet concrete has a negligible stiffness. As the concrete gains strength, its stiffness also increases. This early strain which occurs in the early days is incorrectly converted to a higher load, by the assumption of a constant modulus elasticity applied within the calculation.
4. Concrete shrinkage.
Concrete undergoes fairly rapid autogenous shrinkage (±40με in the first 10days; increasing to 75με by 3 months). This shrinkage will appear to the gauge as an additional compressive strain, however due to the restraint by the pile wall, we know that the shrinkage will actually induce a tension force to some extent or reducing the compressive force. The prop size can easily enhance the magnitude of shrinkage and show easy a 1500kN “phantom” compressive force in the first 10 days. Drying shrinkage also occurs at a slower rate of ±25με over 3 months, which adds a further 3500kN compressive load.
The four effects described will have a substantial influence on the accuracy of the measurement and in combination, the overall effect is complex and difficult to correct or compensate for without an independent way of measuring the load (e.g. using a jack).
The trigger levels at Liverpool Street were set on the expected loads from the WALLAP (analysis) model, which considered all construction and used soil properties derived from the most likely ground conditions encountered. It should be noted that the strength safe working load of the props far exceeded the trigger values set.
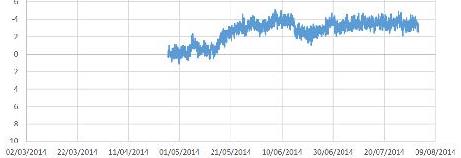
The above example shows the Axial Load in Red and the Temperature in Blue. It provides a clear indication of the change in Load as the Concrete cools and hardens and then at later stages the correlation between temperature and load.
Most of stain gauge locations measured a load value out of the specified threshold levels. The main purpose of trigger values on loads in props should be to ensure safety of the structural member and should be set as a percentage of the safe working load of the member.
Several alternative approaches are recommended to avoid false alarms on load trigger values:
- Re-base the strain gauges after the early effects have occurred, but before excavation progress. Two weeks would be a reasonable timeframe for early thermal, shrinkage and stiffness gain effects to be mostly complete, but this will more than likely have a detrimental impact on the excavation program if the props have adequate strength. Re-basing the gauge would not impact safety as the early effects are internal locked-in effects, rather than those due to external loads.
- Set higher trigger values, based proportionally on a safe working load of the member, rather than a low expected value from a simple analysis. Consideration should be given to the proportion of SLS load to set red and amber triggers.
- Instead of setting trigger values on load, use strains directly as an estimate of wall movements. Strains could reasonably assumed to be constant and summed up over the length of the member. The overall wall movement calculated via this approach can be cross-checked with the direct wall measurements taken from the in-place inclinometer readings.
There is an important question as to the value of obtaining and monitoring load data, at some considerable expense to the project. When a real problem with excessive retaining wall deformation does arise, it is very useful to have as much data as possible about the performance of the support system. Therefore having instrumented props is of considerable value in understanding where the deficiency in the system lies and in informing the best course of remedial action to address any such deficiency. If at the outset of the project, the deformation monitoring regime recognises this fact, it should be possible to design and specify a suitable level of instrumentation, without incurring the significant additional and ongoing cost of intensive data monitoring, while keeping much of the benefit of the data should it be needed.
Conclusion
Advancements in monitoring generated by the Crossrail Project has significantly advanced our understanding of how to monitor construction projects of this type. By looking at the monitoring across three Crossrail Station developments Laing O’Rourke and their in-house monitoring team at Select have gained exposure to most current forms of instrumentation, visualisation and interpretation. By reviewing this data a number of observations can be made:
- Installation techniques should be modified to take account of the construction operations being undertaken and the type of information which is to be collected.
- Methods of monitoring and frequencies of data collection should match the rate and value of predicted movement. Manual monitoring methods may be more accurate and less expensive than automated options once this has been taken into account.
- The environment into which an automated monitoring system is to be installed must be carefully considered to take account of the impact of obstructions, changes in environment and public/mechanical interaction. Maintenance of automated systems must be carefully reviewed to ensure that the automated systems continue to give accurate and reliable data.
- Setting of thresholds should be carefully reviewed to ensure they are meaningful, take into account of environmental influences and the actual accuracy of the monitoring equipment.
Thanks
Our thanks go to the Laing O’Rourke construction team and members of Crossrail together with C122 Asset Protection Engineers and C138 Liverpool Street Design Team.
-
Authors