Stepney Green Cavern – Design Concepts and Performance of SCL Lining
Document
type: Technical Paper
Author:
Michal Uhrin MSc CEng, Thomas Schultheis MSc CEng, Nicholas Tucker Eur Ing BSc CEng MICE, ICE Publishing
Publication
Date: 03/11/2014
-
Read the full document
Introduction
Stepney Green Junction, Box and Caverns are located in the London Borough of Tower Hamlets, east of Whitechapel station and at the point of bifurcation of the tracks to Pudding Mill Lane Portal and the Isle of Dogs (see Figure 1.1).
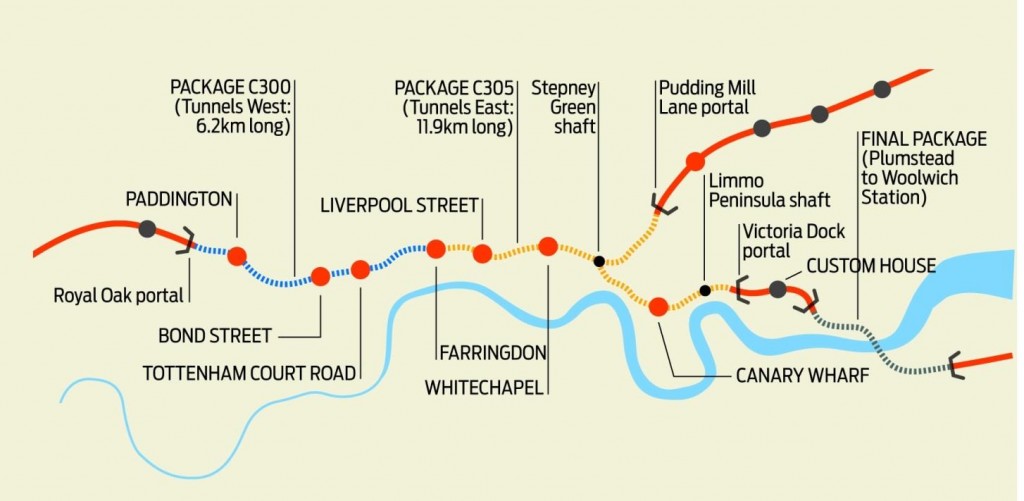
Figure 1.1 – Crossrail alignment
Stepney Green is one of the largest work packages on Crossrail and is one of the most complex sections of the new rail link. The caverns will house the crossover tunnels that will allow trains to connect to both eastern terminals. The interchange will allow passengers from the Essex end of Crossrail in Shenfield to connect with the Abbey Wood station in north Kent as well as destinations on the central and west sections of the new rail line.
The two Stepney Green SCL turnout caverns at over 50m long with a quasi-elliptical cross section varying from 8m diameter to 17m wide x 13.m high are the largest caverns ever built using Sprayed Concrete Lining techniques in Central London. At the eastern ends of the caverns structures there are two TBM launch adits, approximately 25m long.
Excavation of the caverns progressed from a rectangular access shaft built across the twin TBM running tunnels to the west of the junctions that will house M&E utility rooms, a ventilation facility and provide an emergency ingress and egress for Crossrail during operation.
The SCL cavern design was carried out by Mott MacDonald supported by Gall Zeidler Consultants. Temporary works were designed by OTB on the Contractor’s behalf. The caverns form part of the Eastern Running Tunnels Contract C305 that was awarded to the Dragados/Sisk JV in December 2010 for approximately £500 million.
The SCL excavation commenced on the EB launch tunnel in November 2012 and the EB cavern in January 2013. The EB cavern primary lining was completed in May 2013, followed by the westbound in August 2013. To construct the caverns and launch tunnels, the project team had to excavate approximately 38,000m3 (bulked) of material and apply over 6,000m3 sprayed concrete to the temporary and permanent linings.
SCL structures at Stepney Green
Stepney Green SCL construction consists of various structures including:
- two Launch and two reception adit tunnels
- two single side drift caverns
- two double side drift caverns
The total length of the mined tunnels is approximately 120m, containing 50m of adit tunnels, 40m of single side drift tunnels and 25m of the large double side drift caverns. A detailed description of the individual structures is given in the following chapters.
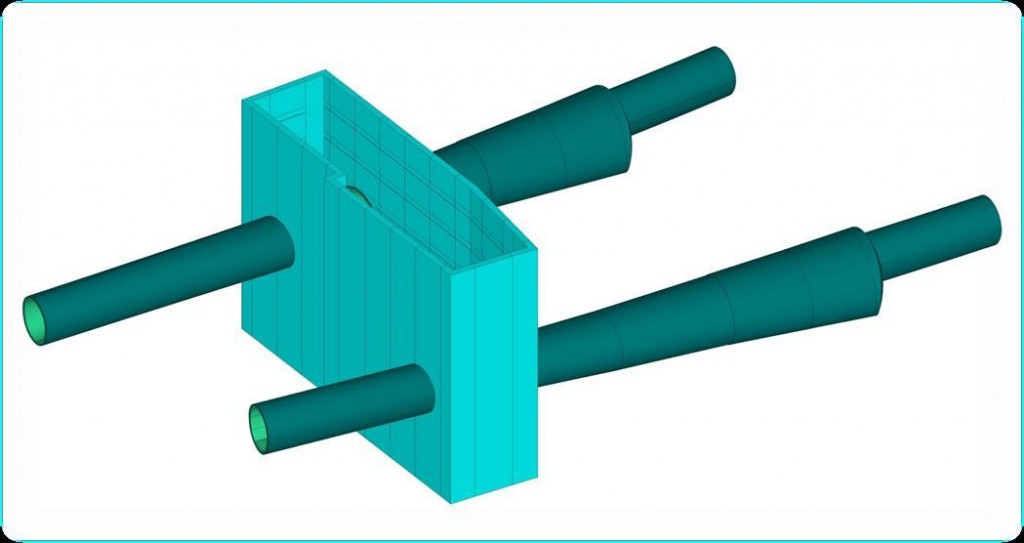
Figure 2.1 – SCL structures at Stepney Green
Adit tunnel
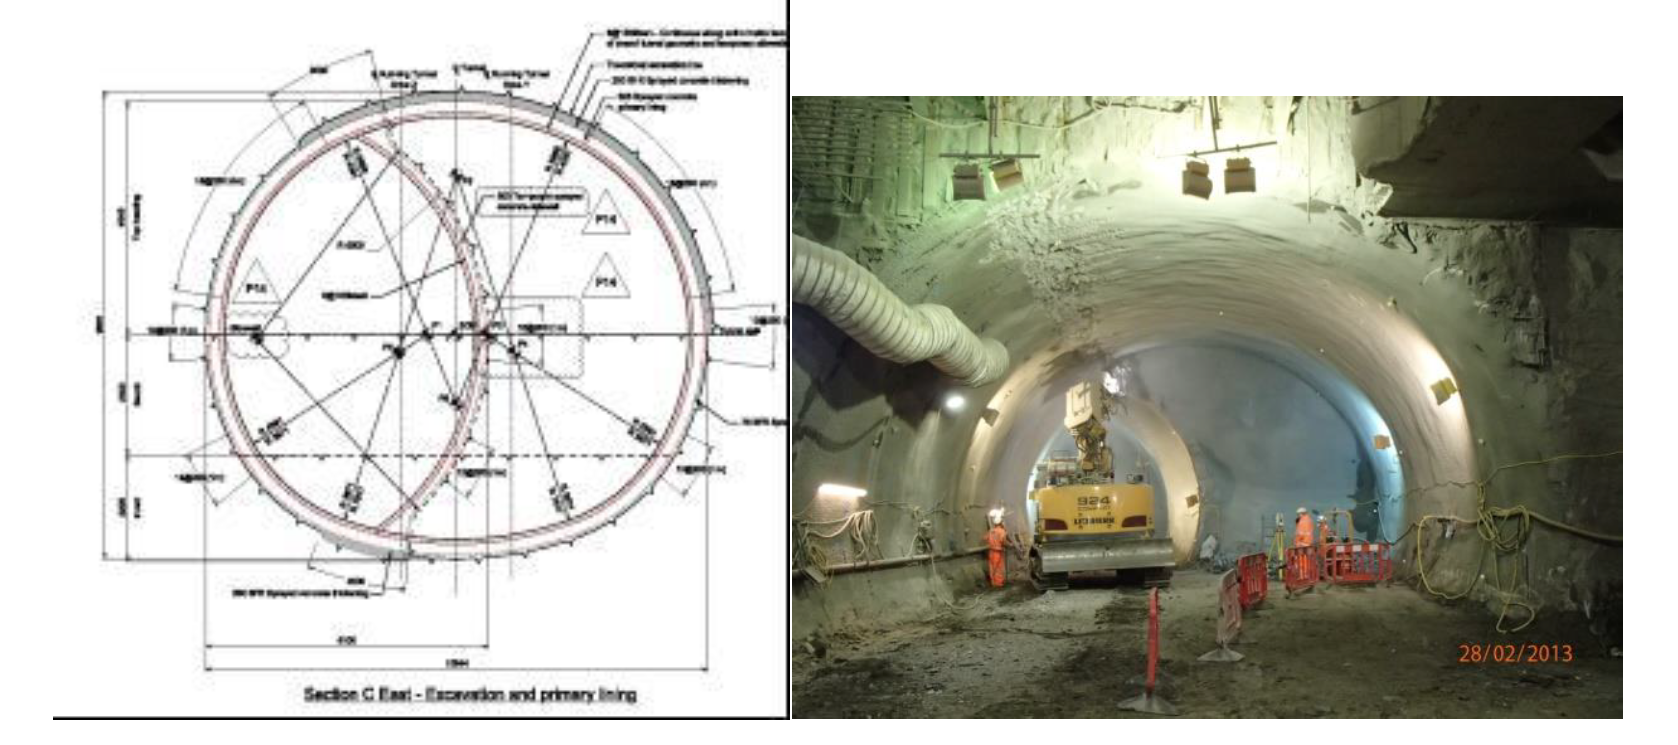
The cross section for the adit tunnels is in the range of 8 – 9.4m in width and 8.8m in height. The primary lining consists of steel fibre reinforced shotcrete with a thickness of 350mm including a 75mm sealing layer. The cross section is subdivided in three faces (top heading, bench and invert) with a maximum face area of 32m2. The resultant excavation cross section is about 55m2. The secondary lining consists of 250mm sprayed concrete reinforced with steel bars and mesh. A combination of spray applied waterproofing and sheet membrane was designed for SCL structures for Stepney Green.
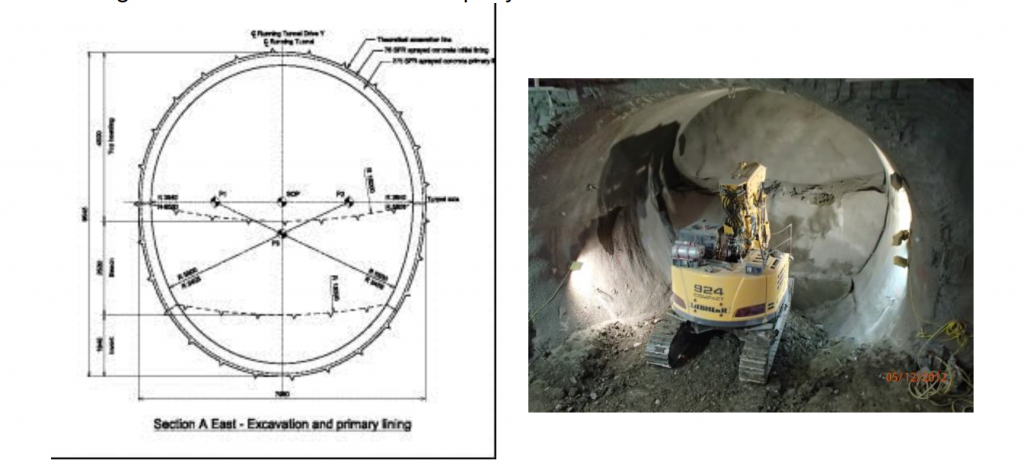
Figure 2.2 – Adit tunnel cross section
Single Side Drift
The cross section for the single side drift cavern varies in width from 9.9 to 12.9m and in height from 8.6 to 11.2m.
The primary lining consists of sprayed concrete with a thickness of 400mm including a 75mm sealing layer and 300mm for the temporary sidewalls. The primary lining is divided in two layers consisting of a 300mm primary I layer including steel fibre reinforced shotcrete, 16mm bar reinforcement in the knee areas and a 100mm primary II layer including plain shotcrete and a B503 mesh over the entire circumference and bar reinforcement in the shoulder and invert area. In addition L-bars where installed at the top and bottom connections.
The cross section is subdivided vertically and horizontally in 6 faces with each face area less than 30m2. The resultant excavation cross section is about 80 to 120m2.
Whilst analysis does not rely upon the presence of lattice girders for structural capacity in the design cases, it was concluded that lattice girders provide an important contribution to shape control as well as the improving the bending and shear resistance of the linings and therefore the robustness of the lining system.
The secondary lining consists of 350mm sprayed concrete reinforced with steel bars and mesh.
A combination of spray applied waterproofing and sheet membrane was designed for SCL structures for Stepney Green.

Figure 2.3 – Single Side drift cross section
Double Side Drift
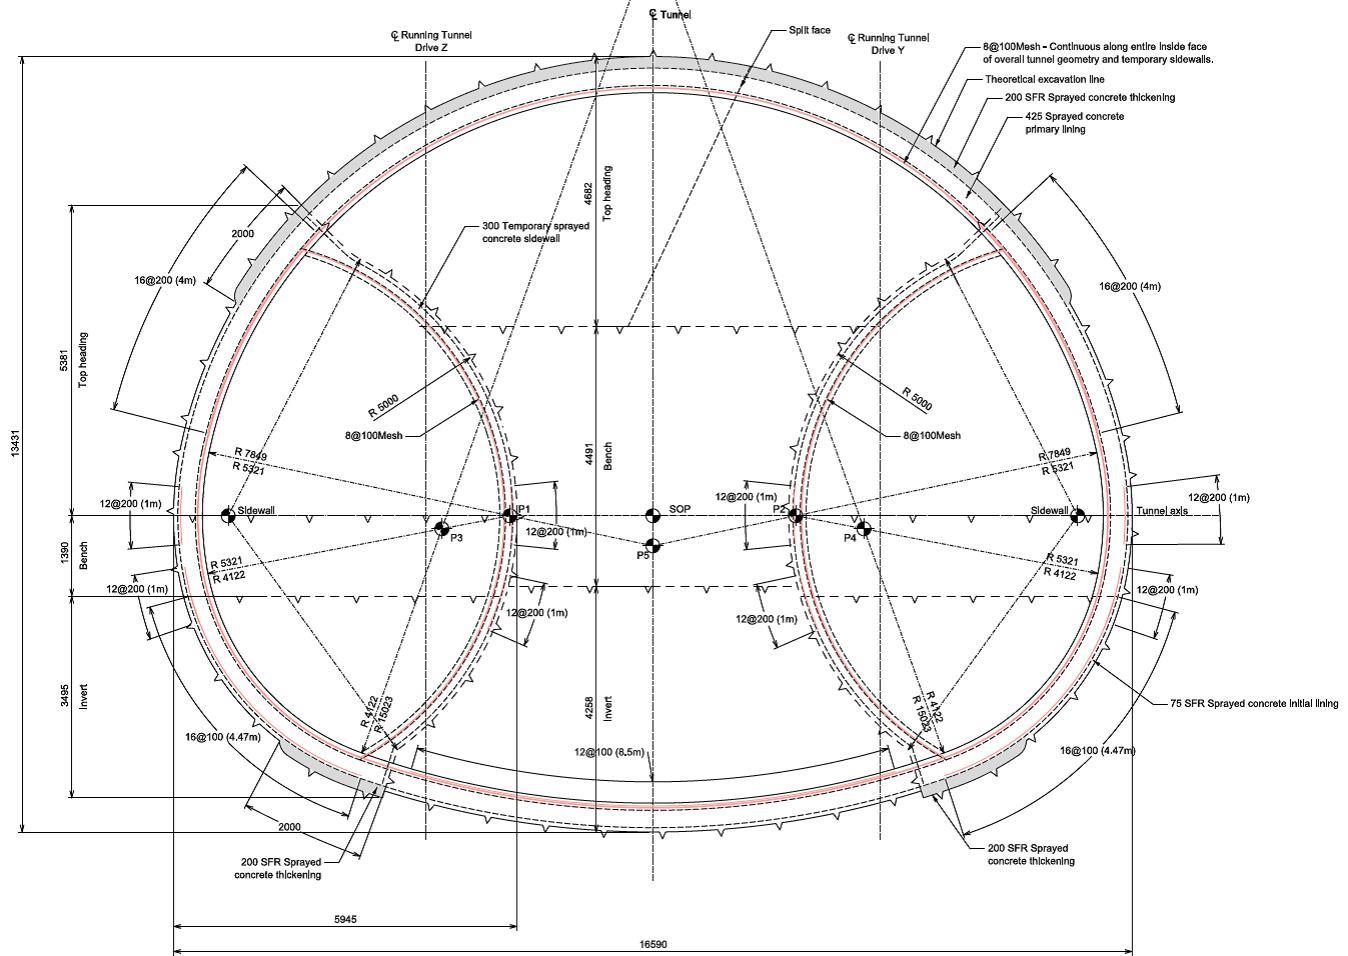
The cross section for the double side drift cavern varies in width from 13m to 16.5mm and in height from 11.4 to 13.4m.
The primary lining consists of sprayed concrete with a thickness of 500mm including a 75mm sealing layer and 300mm for the temporary sidewalls. The primary lining is divided in two layers consisting of a 375mm primary I layer including steel fibre reinforced shotcrete, 16mm bar reinforcement in the knee areas and a 125mm primary II layer including plain shotcrete and a B503 mesh and bar reinforcement in the shoulder and invert area. In addition L-bars where installed at the top and bottom connections.
The cross section is subdivided vertically and horizontally in up to 10 faces with each face area less than 30m2. The resultant excavation cross section is about 120 to 180m2.
Lattice girders were installed for the same reason as mentioned in 2.2.
The secondary lining consists of a 400mm sprayed concrete reinforced with steel bars and mesh.
A combination of spray applied waterproofing and sheet membrane was designed for SCL structures for Stepney Green.
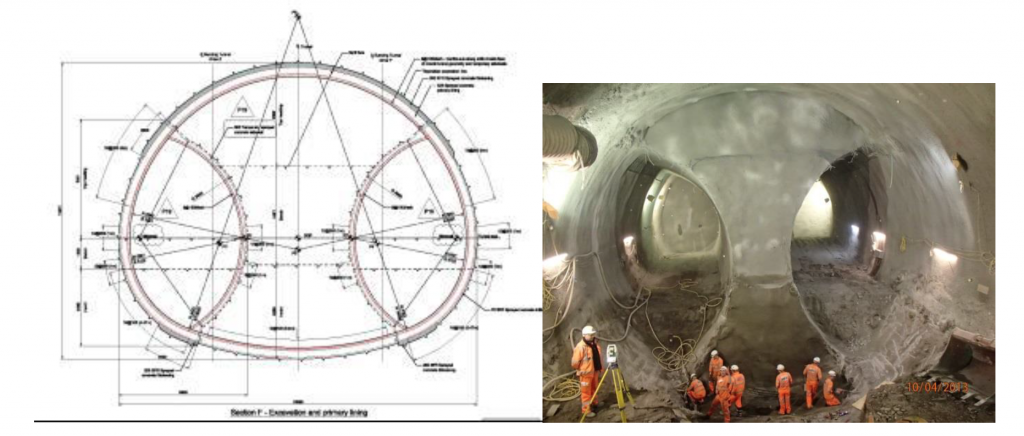
Figure 2.4 – Double Side drift cross section
Excavation and Support Method
For the excavation of the tunnels the Method of SCL lining with sequential excavation and support was applied.
The single side drift cavern was constructed by the application of a temporary sidewall and a subdivision of the drifts into top heading, bench and invert. In longitudinal direction a short ring closure with a distance of 6 to 7m was implemented to ensure a rapid stabilisation of the ground.
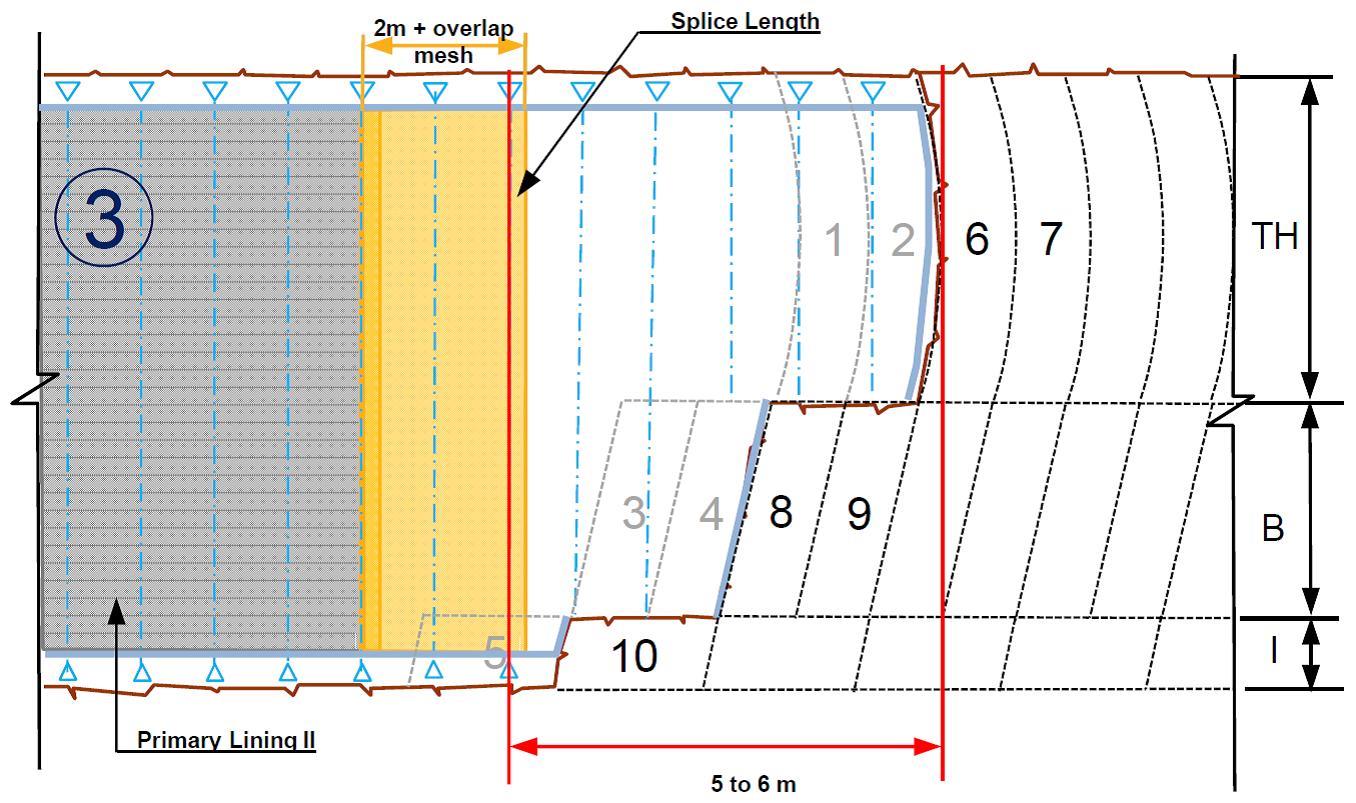
The double side drift cavern was constructed by the application of sidewall galleries with a subsequent centre drift which was also subdivided into top heading, bench and invert. In longitudinal direction a short ring closure with a distance of 5 to 6m was implemented to ensure an early ring closure.

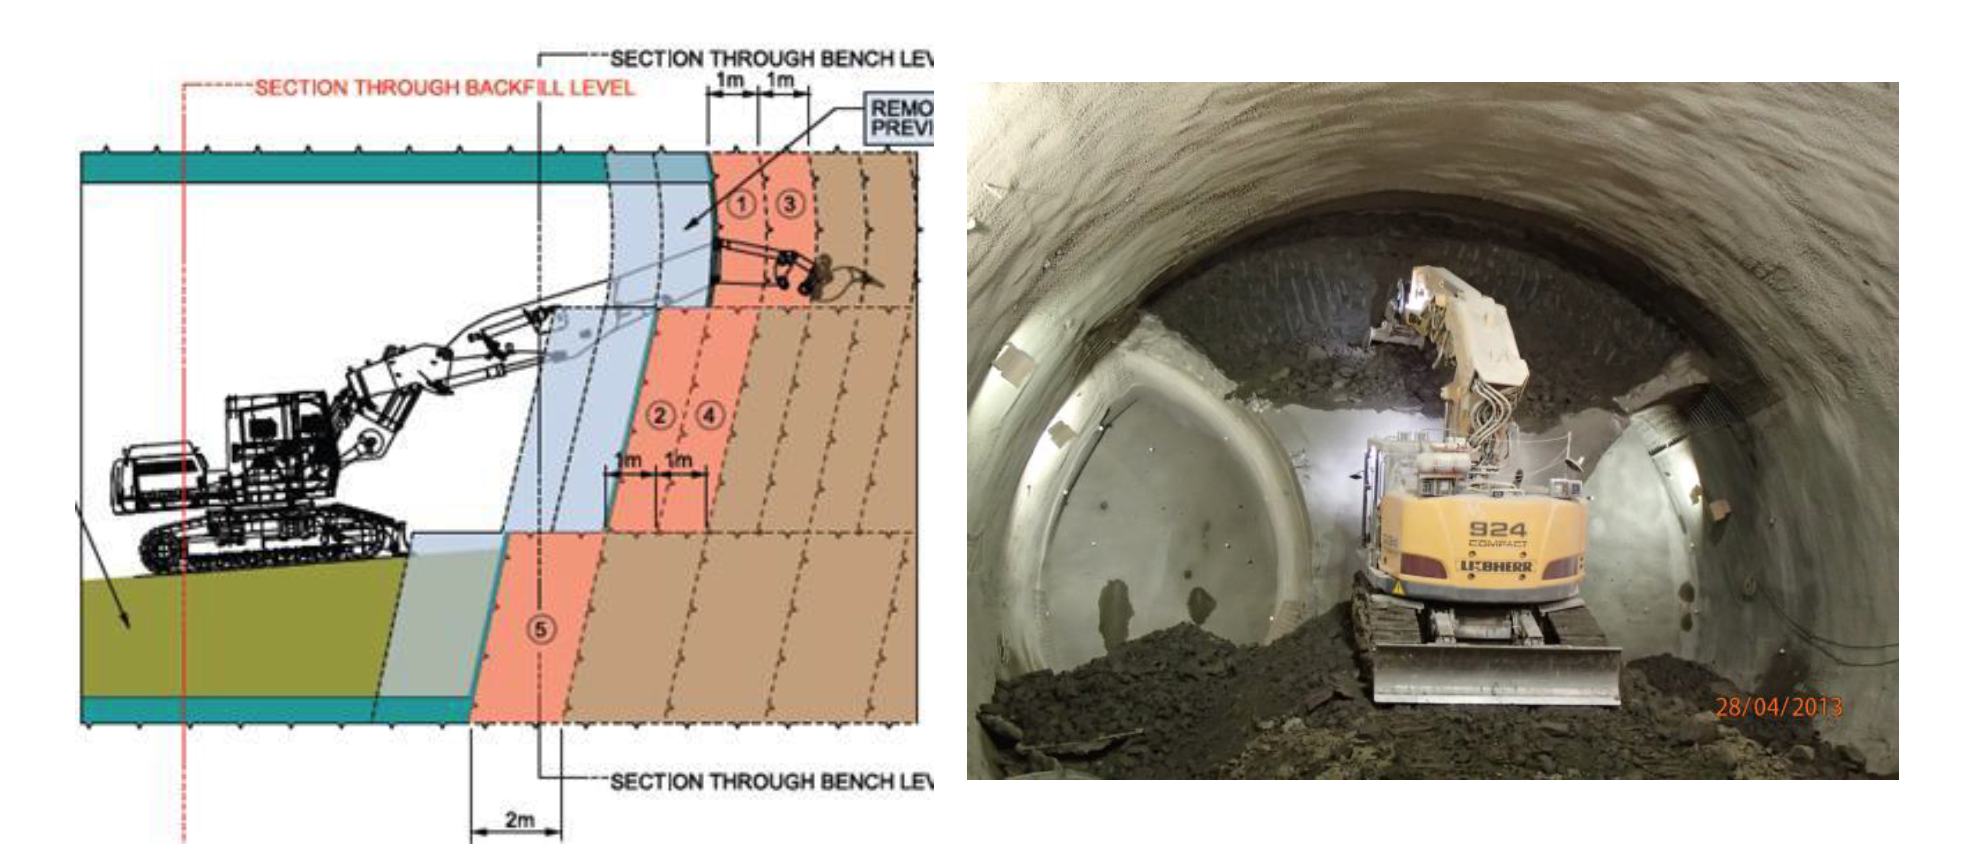
Figure 2.5 – Typical Excavation and Support sequence of centre drift
Ground and groundwater conditions
The ground and groundwater conditions are presented in this paper for the extent and level of detail relevant to the analytical part of the primary lining design for the Stepney Green caverns.
Ground stratigraphy
The ground strata present at the Stepney Green site are as follows (from the ground surface level): Made Ground, River Terrance Deposits, London Clay Formation – Unit B/A3, London Clay Formation – Unit A2, discontinuous Harwich Formation, Lambeth Group Formation, Upnor Formation, Thanet Sand and Chalk bedrock. Made Ground and River Terrace Deposits are relatively thin and have generally low influence on the SCL works. Only a local presence of the Harwich Formation was observed, occurring in a discontinuous band beneath the Stepney Green Shaft footprint. The Lambeth Group Formation includes significant presence of channel sand with high porewater pressures which had to be reacted upon by design of a suitable depressurization scheme.
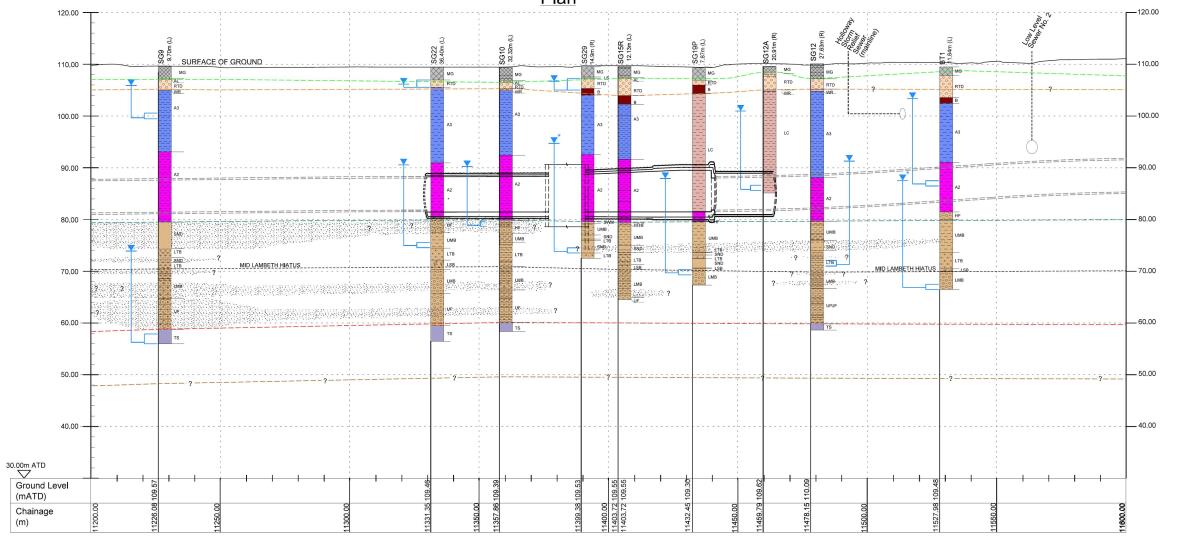
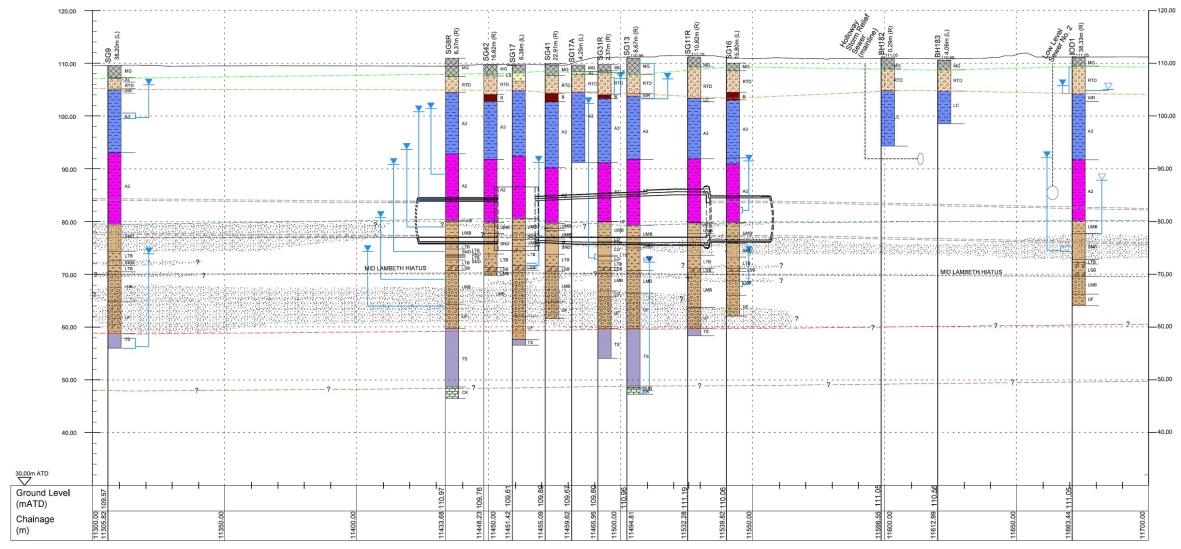
The depth from the ground surface level to the eastbound cavern axis level is approximately 25m. The westbound cavern is located about 5m deeper. The stratigraphy applicable to the caverns is illustrated by schematic geological longitudinal sections in Figure 3.1 (eastbound cavern) and Figure 3.2 (westbound cavern).
Figure 3.1 indicates that the eastbound cavern was excavated predominantly within London Clay Unit A2. Figure 3.2 shows that the top part (approximately two thirds) of the westbound cavern was also constructed in London Clay. Its bottom part however had to be excavated in the Lambeth Group Formation with significant presence of channel sand. The depressurization scheme was therefore most critical for the westbound excavation. Due to its importance, extent and impact the depressurisation process was simulated in all westbound numerical analyses.
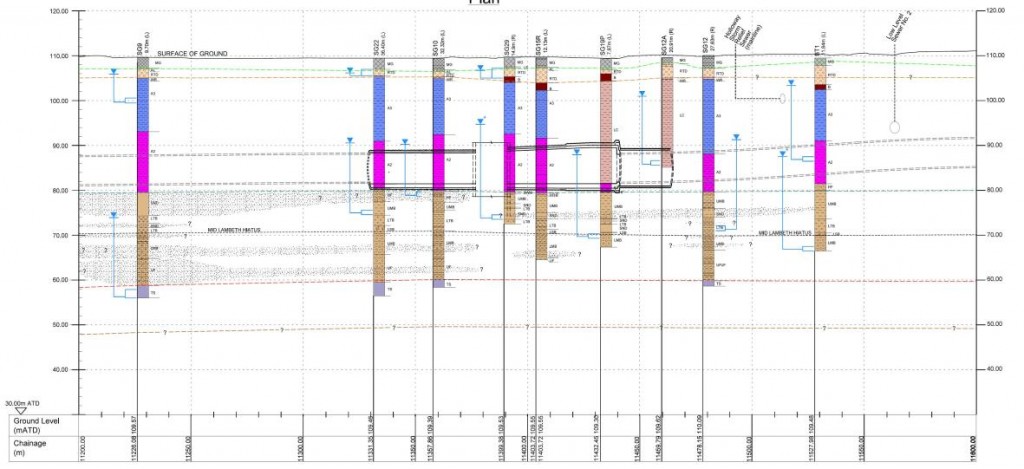
Figure 3.1 – Schematic geological longitudinal section eastbound
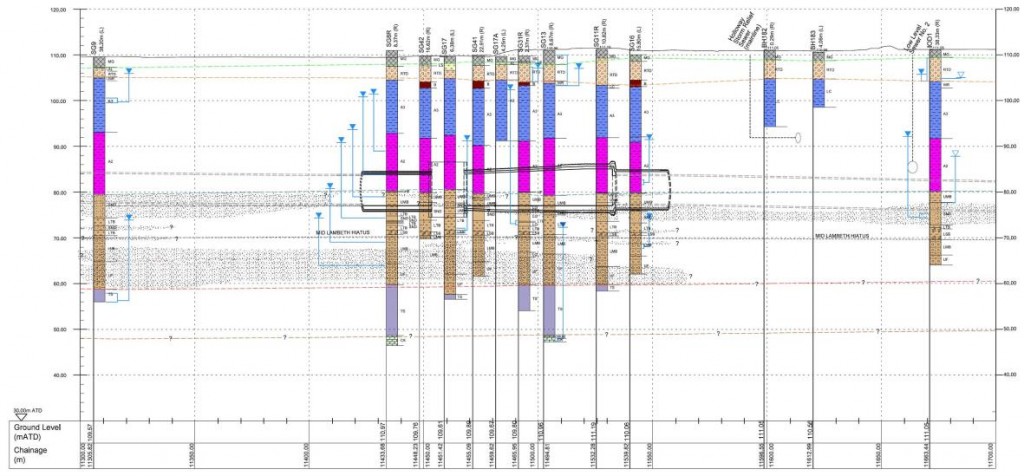
Figure 3.2 – Schematic geological longitudinal section westbound
Groundwater conditions
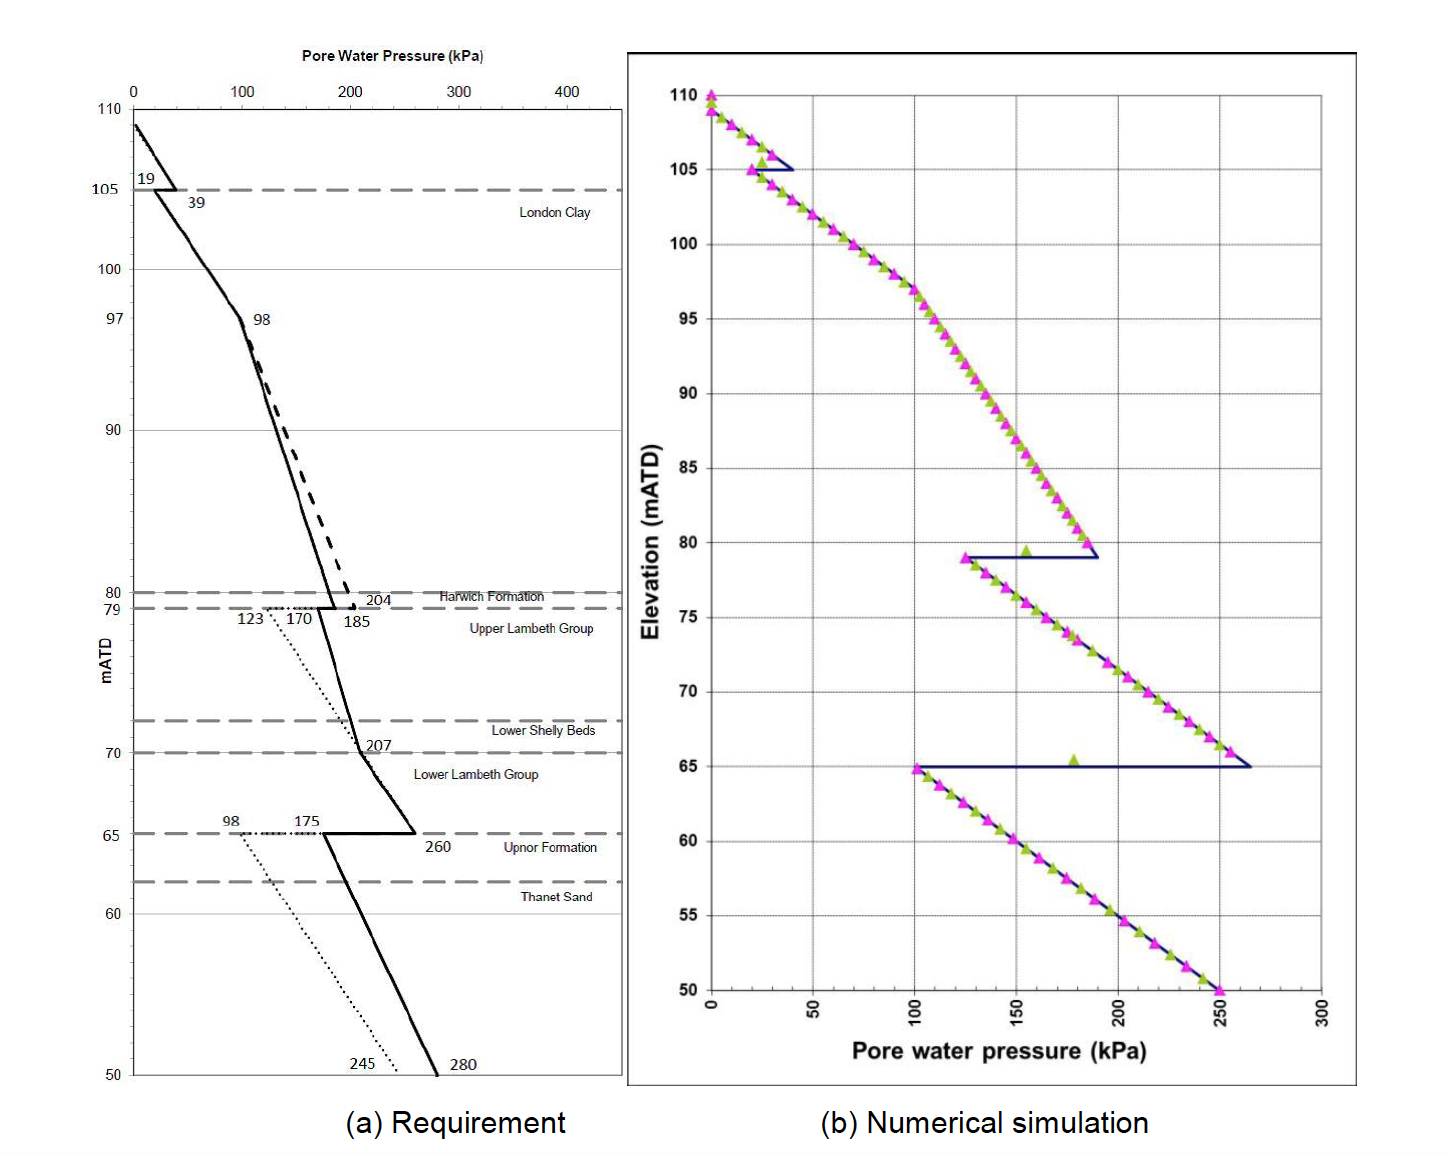
The groundwater conditions were evaluated based on information gathered from multilevel piezometer measurements. The Mott MacDonald geotechnical team reviewed the measurements and rationalised them into series of pore water pressure design lines applicable to various design scenarios. Illustration of the water pressure design lines is provided in Figure 3.3 (a).
The complex in situ piezometric profile includes sub-hydrostatic pressure, changes in pore pressure gradient and pressure drops due to underdrained conditions below London and due to complicated sequence of the clayey and sandy strata. A simulation of the pore water pressure conditions from a numerical model plotted against a theoretical design line is presented in Figure 3.3 (b).
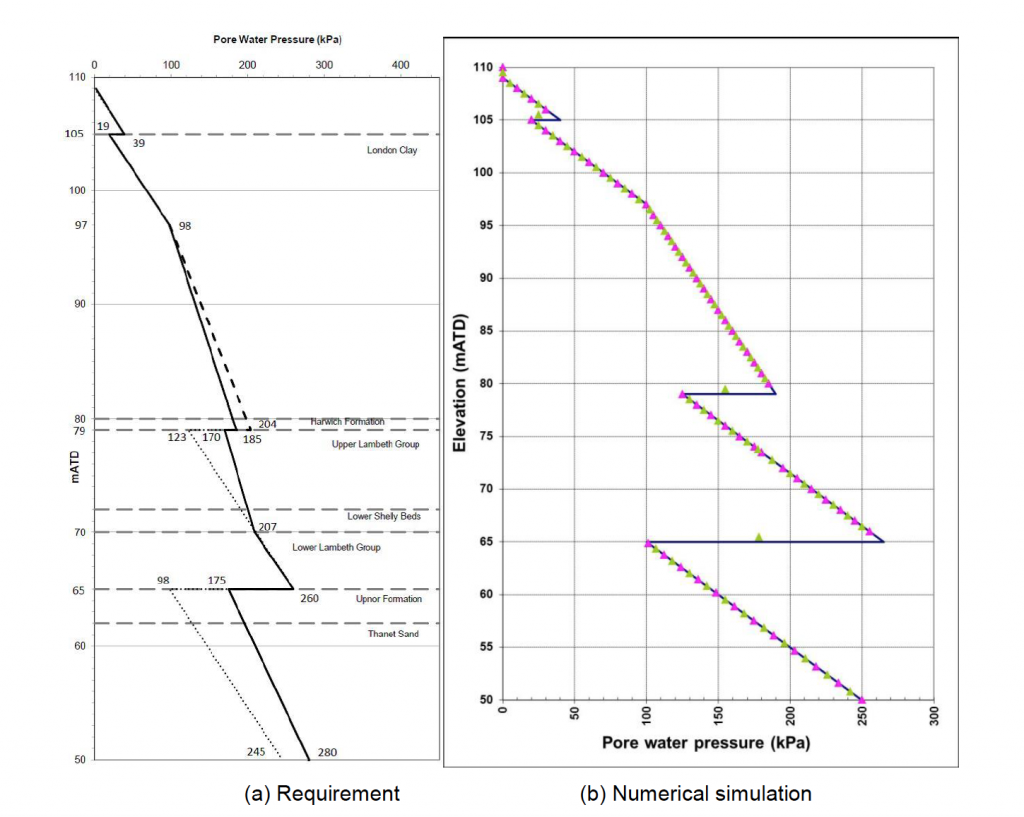
(a) Requirement (b) Numerical simulation
Figure 3.3 – Pore water pressure design linesNumerical analyses of the SCL caverns
Numerical models were carried out to substantiate the design for the SCL caverns. This paper concentrates only on the primary lining analyses. The purpose of the numerical analyses was to simulate the ground-lining interaction and provide model predictions to be checked against required standards. For successful outcome, the numerical models had to deal with the ground behaviour, lining structural behaviour, potential surface surcharge and the excavation and support sequence.
During the course of the design numerical models were undertaken both for the eastbound and the westbound cavern and both with and without the 75kPa surface surcharge required by the project’s standards. The site is generally situated under a park area which indicates minimum surface surcharge in the short-term and no need for compensation grouting works. However, the activities of the construction site including heavy storage and plant movement can cause some degree of surcharge. In the long-term the 75kPa surcharge was meant to account for potential future development on the surface.
The numerical analyses were carried out in finite difference program FLAC. Initially, the caverns were modelled in 2D plane strain sections. Later in the design process, 3D numerical models were developed by extruding the 2D sections into the longitudinal direction. One 3D model was built for the largest single side wall drift cavern and one for the largest double sidewall drift cavern.
Drained and undrained ground behaviour
The clayey ground was generally modelled as undrained whereas the sandy ground was generally modelled as drained in the short-term scenarios, i.e. during excavation and SCL primary lining works. In addition, the fully closed and hardened primary lining ring was also checked for full drained load.
The depressurisation of the Lambeth Group sand channels in the eastbound cavern models was simulated in the numerical analyses according to the requirements of its performance specification. Depressurisation carried out from the ground surface was required to reduce and maintain the pore water pressure within the Lambeth Group granular strata below a certain level. Depressurisation carried out from within the tunnel was required to further reduce the water pressure within the actual area of excavation to close to zero.
There was a discussion on the potential effects of partial consolidation of the clayey ground before the ring closure. The debate was specific to the westbound track conditions due to the close proximity to the sand channels in the Lambeth Group Formation, which could act as water re-charge medium and speed up the rate of consolidation (swelling of clay). On the other hand, the depressurization scheme would act against this trend. In order to check sensitivity a fully coupled fluid-mechanical analysis was carried out to investigate the impact of the potential partial consolidation. However, the general reliability of such analysis was questioned due to its extremely complicated nature.
The major objections were as follows:
- Ground permeability had to be calibrated to match the complicated in situ pore water pressure profile. The profile tended to get unstable after a certain number of flow steps in the numerical calculation.
- There were several time-related variables in the time-dependant analysis, namely the consolidation time (dissipation of excess pore water pressure), gain in sprayed concrete strength and stiffness over time and the ground relaxation process which could generally occur over time. Simplifying assumptions had to be made.
- It was difficult to determine the effective stress strength parameters appropriate for this short-term situation.
The issue of the appropriate drained strength parameters which should allow for dilation effects had the most significant impact on the outcome of the analysis.
Ground model
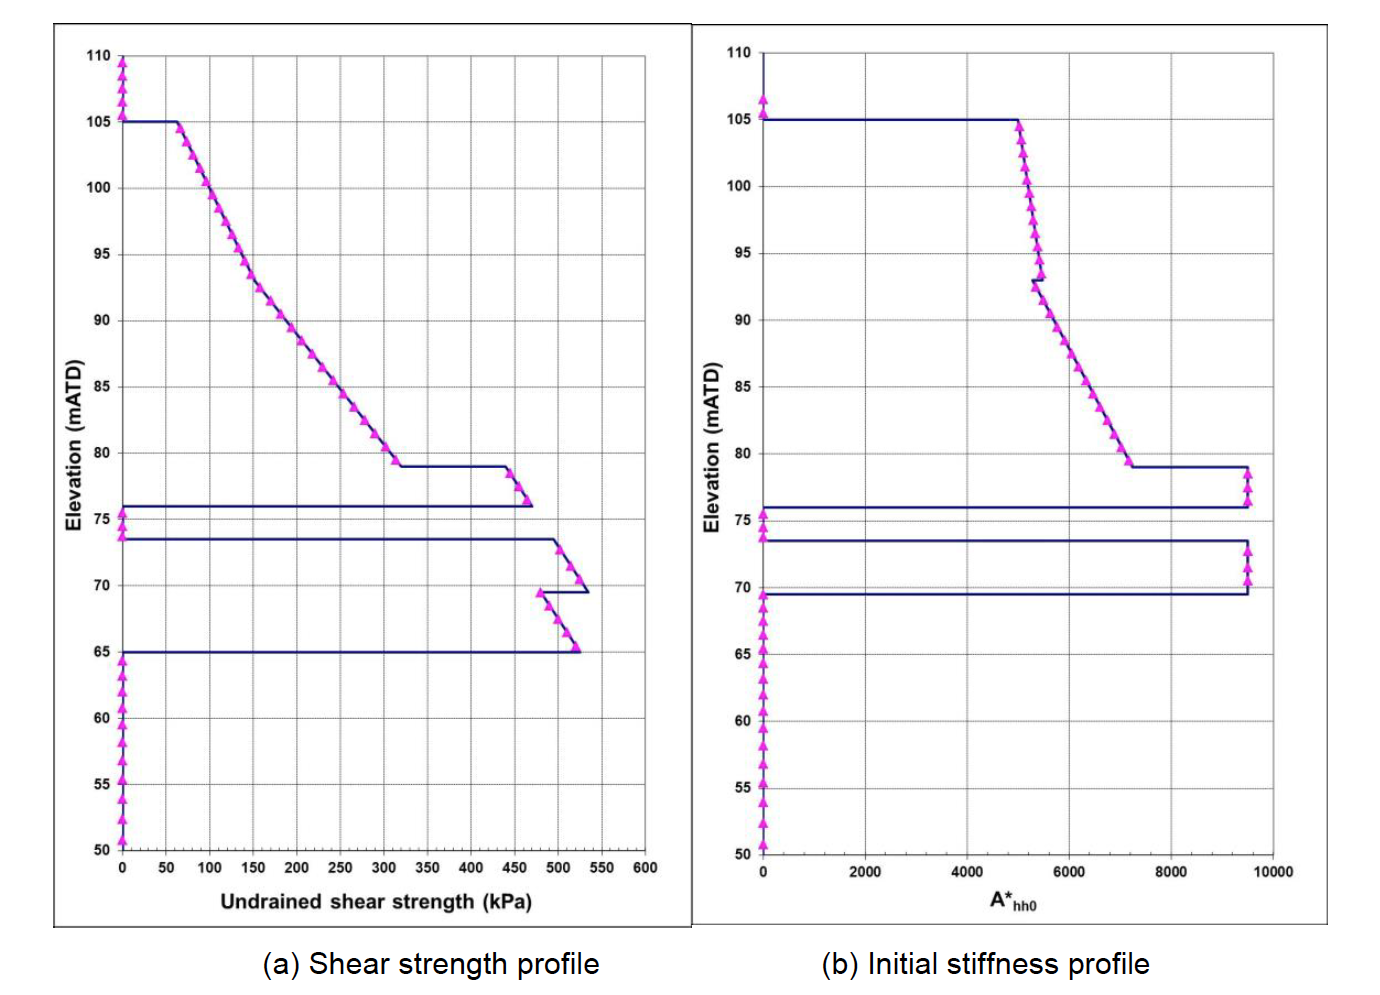
The ground was modelled as a non-linear elastic perfectly plastic medium. The strength of the granular ground was simulated using a standard Mohr-Coulomb criterion with effective stress parameters c’ and Φ’. The strength of the clayey ground was simulated by a Tresca criterion with undrained shear strength cu. The undrained strength profile with depth was determined based on data from laboratory testing, in situ testing and empirical relationships. An example plotted from the numerical model against its theoretical design line is presented in Figure 4.1 (a).
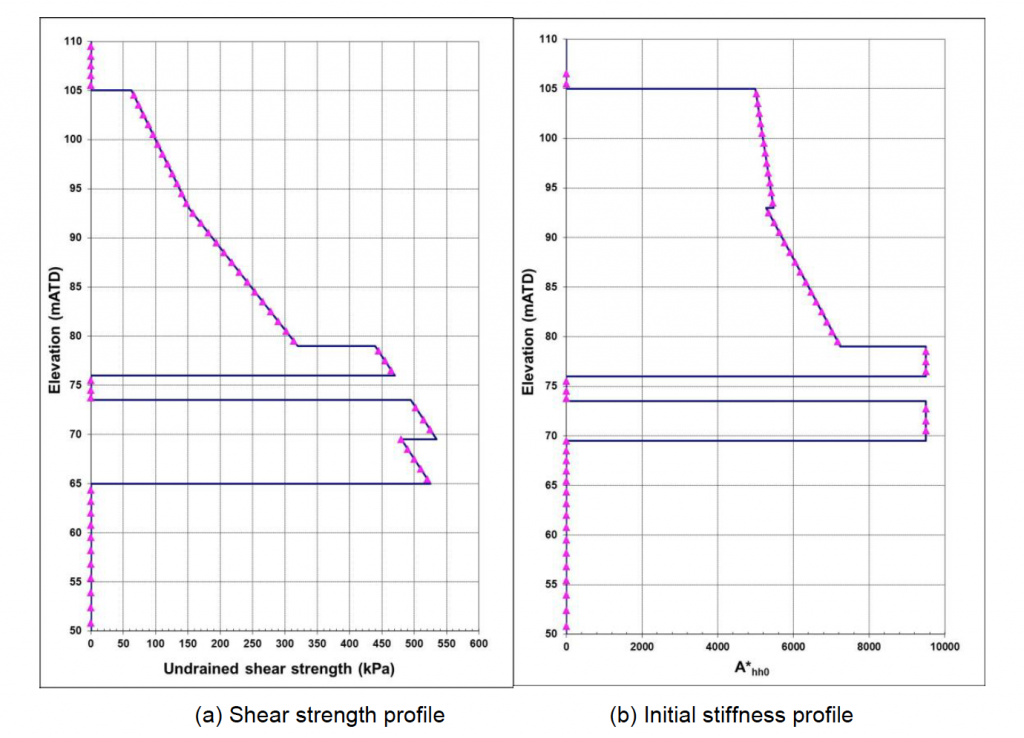
(a) Shear strength profile (b) Initial stiffness profile
Figure 4.1 – Ground parameters varying with depthThe stiffness of Made Ground was modelled as linear elastic. The stiffness of all remaining ground strata was modelled as non-linear, dependant on stress and strain including small strain stiffness approach using a Jardine type function (Jardine et al, 1986). The original work by Jardine et al defines a relationship between the undrained ground elastic modulus normalised by the undrained shear strength (Eu/cu) and the axial strain. For purposes of numerical modelling this approach was modified by Mott MacDonald into a relationship between the shear modulus of the ground normalised by the mean effective stress (G/p’) and the shear strain (Eadington and O’Brien, 2011). Also the stiffness parameters were evaluated based on laboratory test results, in situ testing and empirical relationships. Example profile of the initial stiffness parameter varying with depth plotted from the numerical model against its theoretical design line is shown in Figure 4.2 (b).
The in situ at rest lateral ground pressure coefficient was modelled as follows:
- K0 = 0.5 for Made Ground and River Terrace Deposits.
- K0= 1.2 for London Clay and Lambeth Group Clay above MLGH, i.e. in the area most affected by the tunnelling works. This approach represents a simplification to modelling the K0-profile variable with depth based on the ground investigation measurements and is more representative of the real ground behaviour with respect to simulation of SCL tunnelling works.
- K0 = 1.0 for ground below MLGH.
The in situ pore water pressure was modelled as described in section 3.2 and shown in Figure 3.3.
Sprayed concrete lining model
The sprayed concrete lining was modelled as linear elastic with perfectly plastic hinges allowing limited redistribution of bending moments. The plastic hinges were allowed only in the “sharp corners” of the perimeter lining – temporary sidewall connection (red dots in Figure 4.2). The rest of the lining was designed for linear elastic stress. The limiting bending moment in the plastic hinges was determined based on the section capacity according to the axial force acting in the lining.
The development of the sprayed concrete strength and stiffness over time was taken into account. It was calculated according to the modified J2 curve in EN 14487-1 for the first 24 hours and according to the Chang and Stille (1993) equations afterwards. The elastic modulus of the sprayed concrete was reduced in order to account for creep effects so that Ec,eff used in the analysis was equal to half of Ecm (Eurocode 2 notation).
The sprayed concrete primary lining is reinforced by steel fibres, mesh, reinforcement bars and lattice girders. The lattice girders were deemed to be required for profile control only and were not included in the lining structural capacity calculations. The mix sprayed against mesh or re-bar did not include steel fibres. The 75mm initial layer was reinforced only by steel fibres. The mesh and reinforcement bars were installed with 45mm cover by structural concrete to ensure long-term durability because the primary lining (except the 75mm initial layer) is designed as a permanent structure. All these aspects were considered in the lining design.
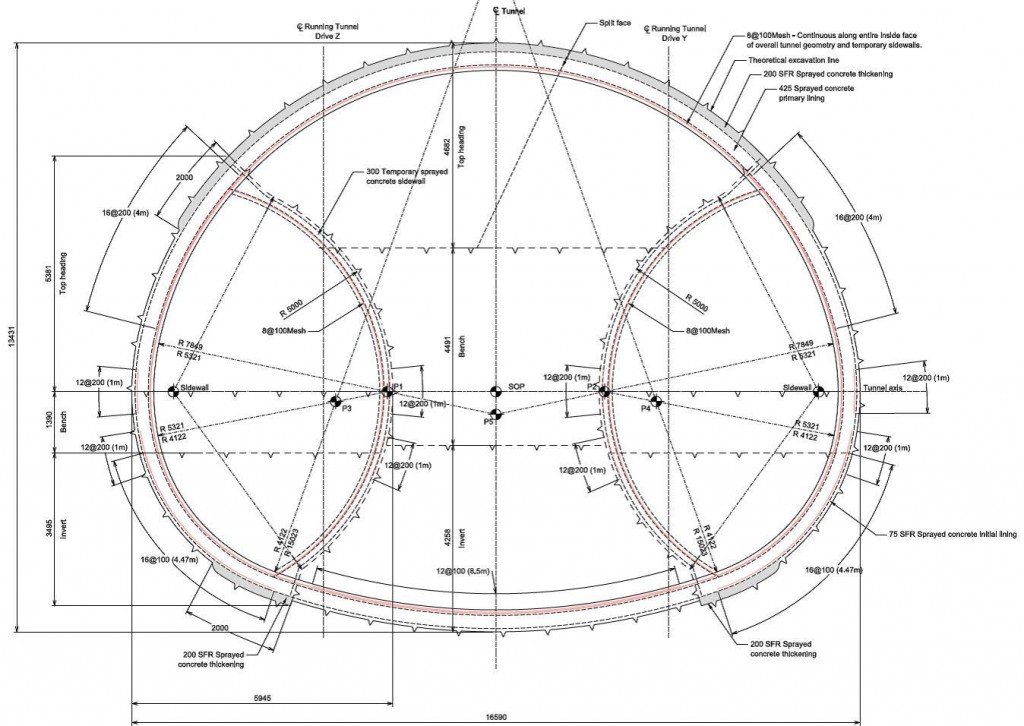
Figure 4.2 – Location of plastic hinges
The structural capacity of the sprayed concrete sections was calculated according to Eurocode 2 and RILEM, which provided framework allowing consideration of the influence of the steel fibre reinforcement. A simplification to the RILEM approach was adopted considering only a rectangular tensile stress block in the steel fibre reinforced section, the tensile stress value being equal to the residual strength. The mean residual tensile strength arising from the steel fibre reinforcement was taken at 1.8 MPa at 28 days and 2.0 MPa at 90 days based on the requirements for beam test results in the sprayed concrete specifications.
Limit state design
The ground parameter values adopted in the numerical analyses were moderately conservative, i.e. characteristic according to Eurocode 7. The analysis and design was based on Eurocode 7, Design Approach 2, Note 1. The FLAC models were therefore based on nominal geometry, characteristic ground parameters and mean structural stiffness. The load factor was applied to the resulting lining stress and material factors were applied in the structural design checks.
Plane strain 2D analyses in FLAC
The Stepney Green caverns were analysed first in plane strain 2D sections using the finite difference program FLAC. Generally, 2D models are quicker to build and much quicker to run than 3D models. Also, the results of 2D modelling are easier to process in terms of structural design checks. However, there were some shortcomings of the 2D modelling, applicable especially in the complex case of the Stepney Green cavern excavation sequences.
2D models generally follow the stages of the excavation and lining sequence. These should be related to the ground relaxation process which in turn should correspond to the age and thus strength and stiffness of the SCL lining. C121 carried out a calibration study for the ground relaxation parameters based on the case studies of Heathrow Express, London Bridge (platform tunnels and concourse tunnel) and King’s Cross tunnels. Unfortunately, none of these cases was similar enough to the Stepney Green caverns in terms of size, shape and excavation sequence.
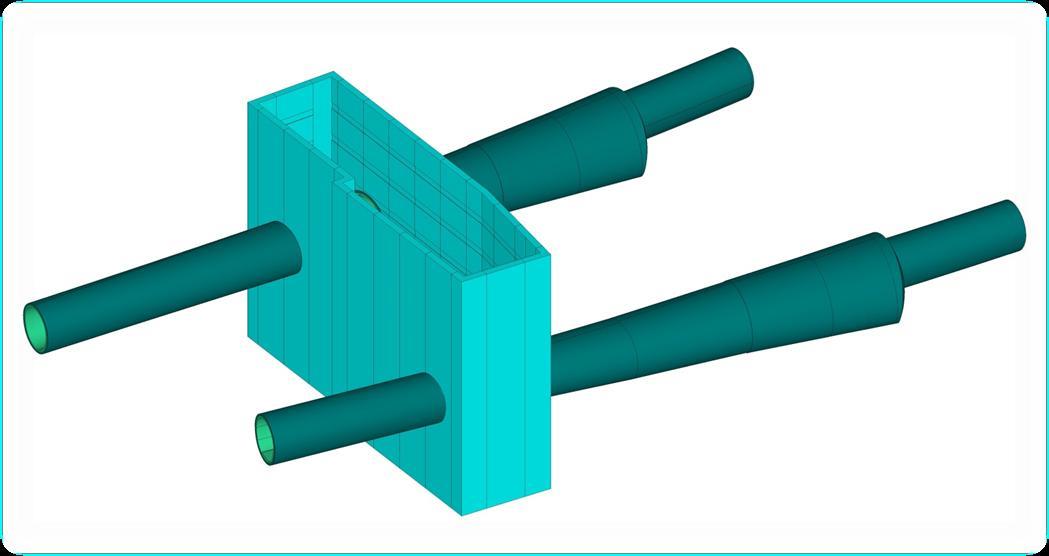
Additionally, there was the issue of the appropriate modelling of the temporary side wall removal. In principle, the problem is similar to the 3D effects simulated by ground relaxation. The temporary sidewalls are initially under stress, typically including high axial force. When removed, their supporting effect disappears which should equal to applying point forces equivalent to the former side wall axial stress to the perimeter lining (Figure 4.3). The removal however is a step by step process carried out in short advances and thus the load on the perimeter lining increases gradually with the progress of the construction works.
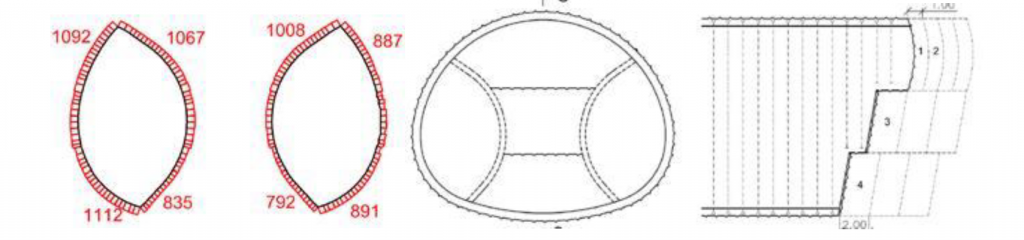
Figure 4.3 – Sidewall removal impact schemes
Depending on the details of the modelling approach to the sidewall removal and the capabilities of the analytical software, the outcome of the analysis can vary to a significant extent. In the 2D FLAC models this phenomenon was simulated as follows:
- During excavation of the central core the sidewalls are left in the model supported by relaxation forces which are reduced in the same way as the ground relaxation forces. This leads to a certain drop in the axial force in the sidewall and thus to a certain drop in the support effects.
- The sidewalls are removed with the installation of the central invert and removal of the ground relaxation forces. If the sidewalls were removed from the model earlier the structural impact of the removal would be counteracted by the applied support forces of the simulated ground relaxation process.
3D analyses in FLAC
The FLAC 3D analyses were undertaken for the largest section of the single side wall drift sequence and the largest section for the double sidewall drift sequence extruded in the longitudinal direction. The 3D analyses were carried out for the following main reasons:
- To remove doubts about the representativeness of the 2D ground relaxation parameters and their relation to the SCL strength and stiffness.
- To test the proposed approaches to the temporary sidewall removal sequence and verify the stability of the partially excavated central core during the step-by-step sidewall removal process.
- To test the proposed approach of delayed reinforcement installation on the near face (Figure 5.1)
- To test the impact of TBM transit loads on the primary lining.
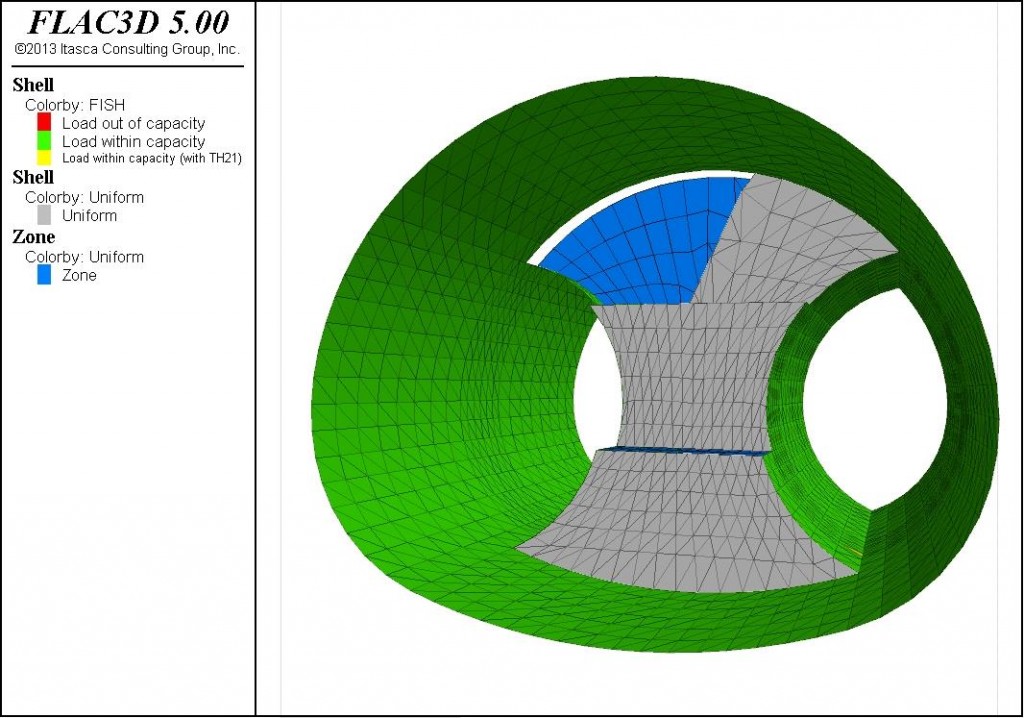
Figure 4.4 – Excavation of the central core in the double side wall cavern model in FLAC 3D
3D models do not need to emulate the ground relaxation process. In the Stepney Green analyses the excavation and support sequence was modelled in full detail as illustrated in Figure 4.4. The strength and stiffness of the advances of the SCL shell were updated according to the estimated advance rates and cycle times.
Because the SCL tunnel is sprayed in separate “patches” it could be argued that the primary lining consists of rings separated by “cold” circumferential joints. This is because the patches are sprayed at different times, the steel fibres may not be fully able to bridge across these joints and there is only a minimum splice of the mesh, whereas in the longitudinal joints there are bars provide across (Figure 4.5). The argument was explored with respect to the stability of the partially excavated central core with the proposed step-by-step sidewall removal instead of the more traditional approach to remove the sidewalls after only after the central core excavation and ring closure. Specifically, it was argued in this respect that due to these joints the central core stability should not rely on the cantilever effect in the longitudinal direction. Although the SCL in reality acts as an isotropic shell, several simulations were run in the 3D models with various degrees of separation along the circumferential joints in order to rule out the potential for the central core instability.
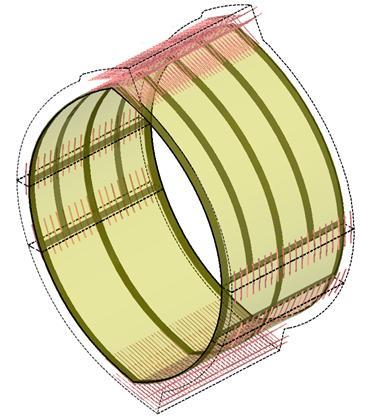
Figure 4.5 – Longitudinal and circumferential joints in the SCL shell
Results of numerical analyses compared with monitoring
Structural stability considerations
The numerical analyses have shown that the predicted stress in the primary lining was within the SCL section capacity. The 3D models verified the feasibility of the proposed step-by-step sidewall removal during the excavation of the central core and supported the argument that the partially excavated central core will remain stable during the process. Both concepts proved to be working well during the construction of the caverns. The analytical work therefore substantiated a design leading to easier, faster and safer SCL construction works. Additionally, the numerical modelling results verified the feasibility of the proposed approach of delayed reinforcement installation on the near face (Figure 5.1) which allowed installation of the reinforcement and spraying of the last pass in complete wide rings. The approach reduced the quantity of joints and improved the constructability of the permanent primary lining at high quality. Finally, the 3D modelling allowed assessment of the impact of the TBM transit load on the primary lining supporting the transit frames.

Figure 5.1 – Concept of delayed mesh installation on the near face
Ground and lining displacement considerations
From the numerical models, ground movements and volume losses were predicted. At the time of writing this paper there was not enough monitoring information available to the authors to make a valid comparison, although substantial amount of data was available from lining displacement measurements.
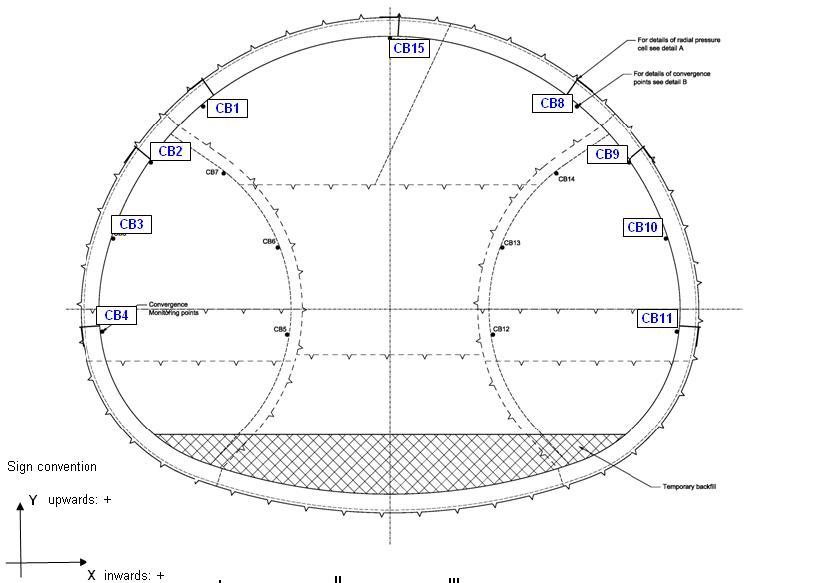
Figure 5.2 – Lining displacement monitoring points in double sidewall drift cavern
Tunnel linings are traditionally designed based on stress (to be within section capacity) but lining performance during construction is traditionally monitored based on displacements by means of convergence measurements assessed against trigger levels. Typical arrangement of convergence monitoring points in the double sidewall drift cavern is shown in Figure 5.2. The trigger level philosophy was to base the movement triggers on expected lining displacements which were estimated by means of the numerical analyses. The green trigger was set at 75% of the FLAC predicted displacement considering that approximately 25% of the total lining displacement takes place before the initial reading of the monitoring point. The amber and red triggers were scaled off the green one. During the construction phase the measured displacements mostly occurred within the green zone and converged close to the amber boundary with the amber limit being exceeded in a very limited number of occasions. Therefore, the triggers served their purpose of a conservative benchmark for checking the expected lining behaviour.
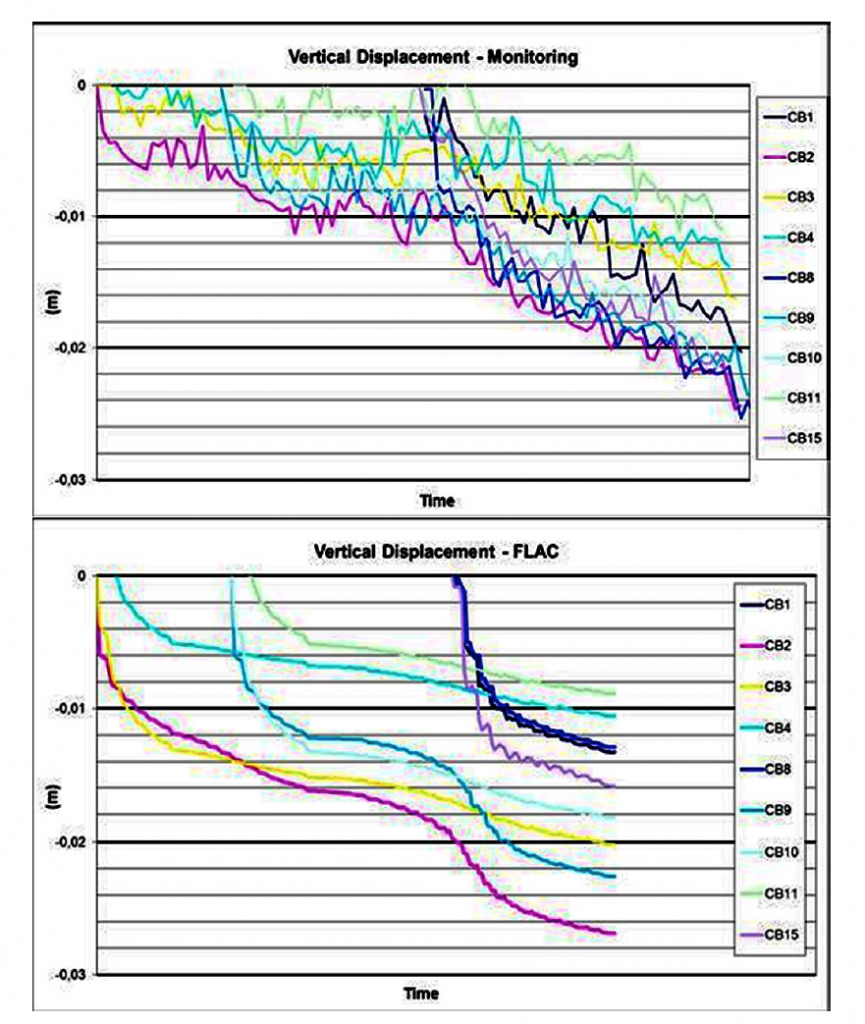
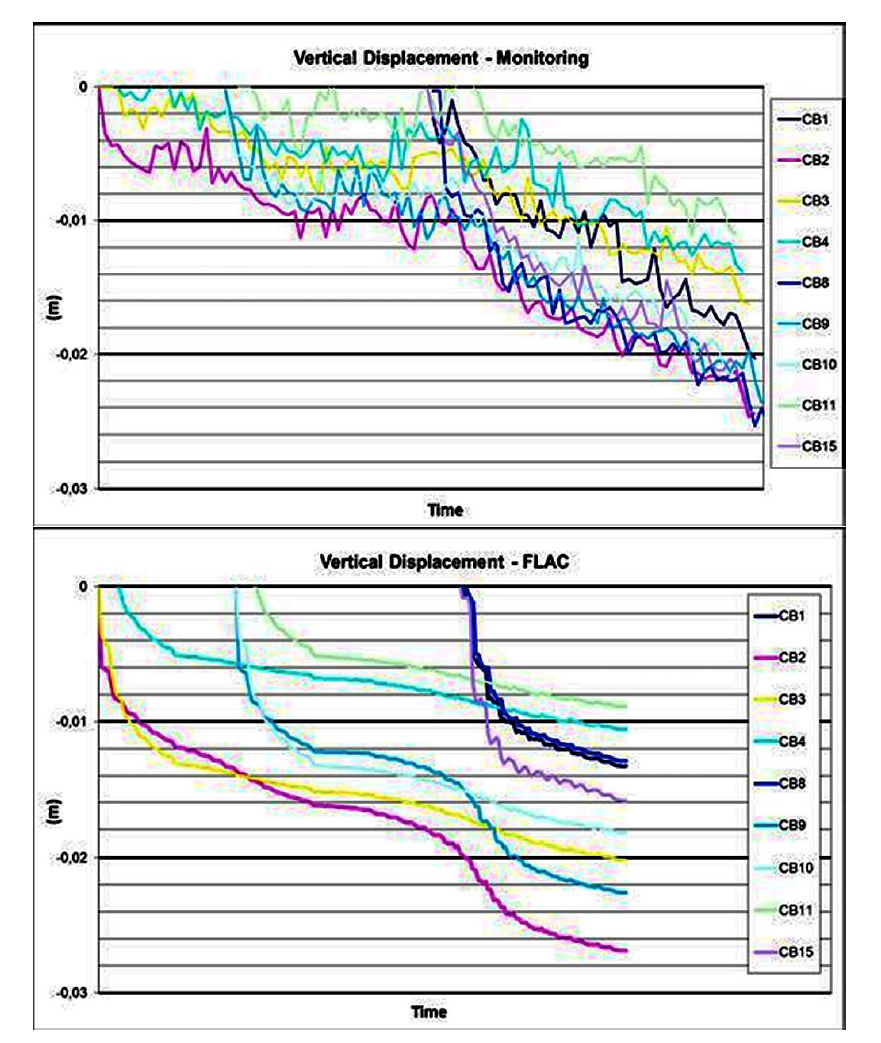
Figure 5.3 – Comparison of predicted and measured vertical lining displacement
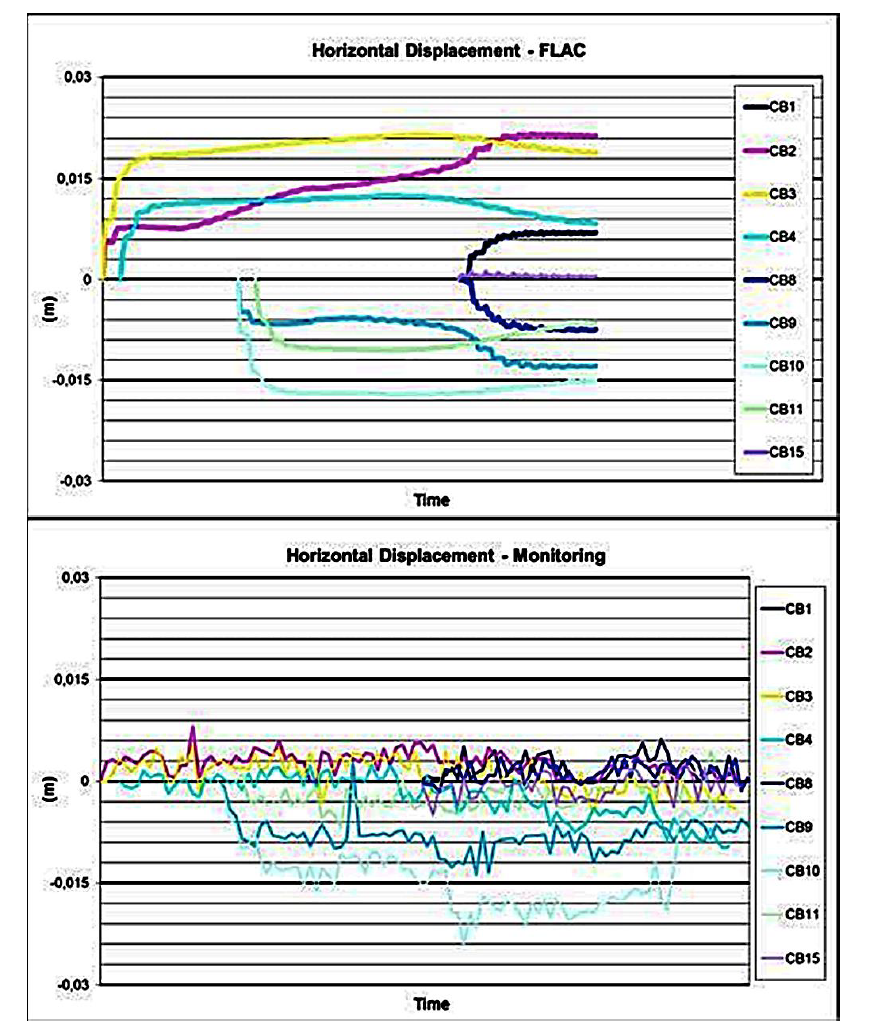
Figure 5.3 presents a comparison of the development of the vertical displacement of the convergence points (Figure 5.2) with time predicted by 3D analysis and measured by monitoring at the Stepney Green construction site. Figure 5.4 shows the same for horizontal displacements. Figure 5.5 provides the comparison for selected monitoring point CB10 movement in vertical and horizontal co-ordinates. The graphs show that there is a relatively good match in terms of the vertical displacements. There is a similar trend and order of magnitude, some points in reality move slightly more than in the numerical model. The horizontal displacements however seem to be over predicted by the numerical model with respect to measurements. It might indicate less bending load at the sides of the tunnel and perhaps could be adjusted by modified K0 value or anisotropic stiffness but that is only a speculation at this point.

Figure 5.4 – Comparison of predicted and measured horizontal lining displacement
In general, the lining movements indicate that after the removal of the temporary side walls the points at the crown move downwards whereas the points at the sides move slightly outwards horizontally, i.e. slightly into the ground. That demonstrates the activation of the lining arch under the ground load after the side walls removal and indicates that the lining is actually under significant stress.
The monitoring measurements so far do not show much difference between the lining displacement of the eastbound and the westbound cavern. That could indicate that the potential partial consolidation during the excavation and primary lining discussed with respect to the westbound cavern either did not happen or did not have a clear measurable impact or was prevented by the dewatering system.
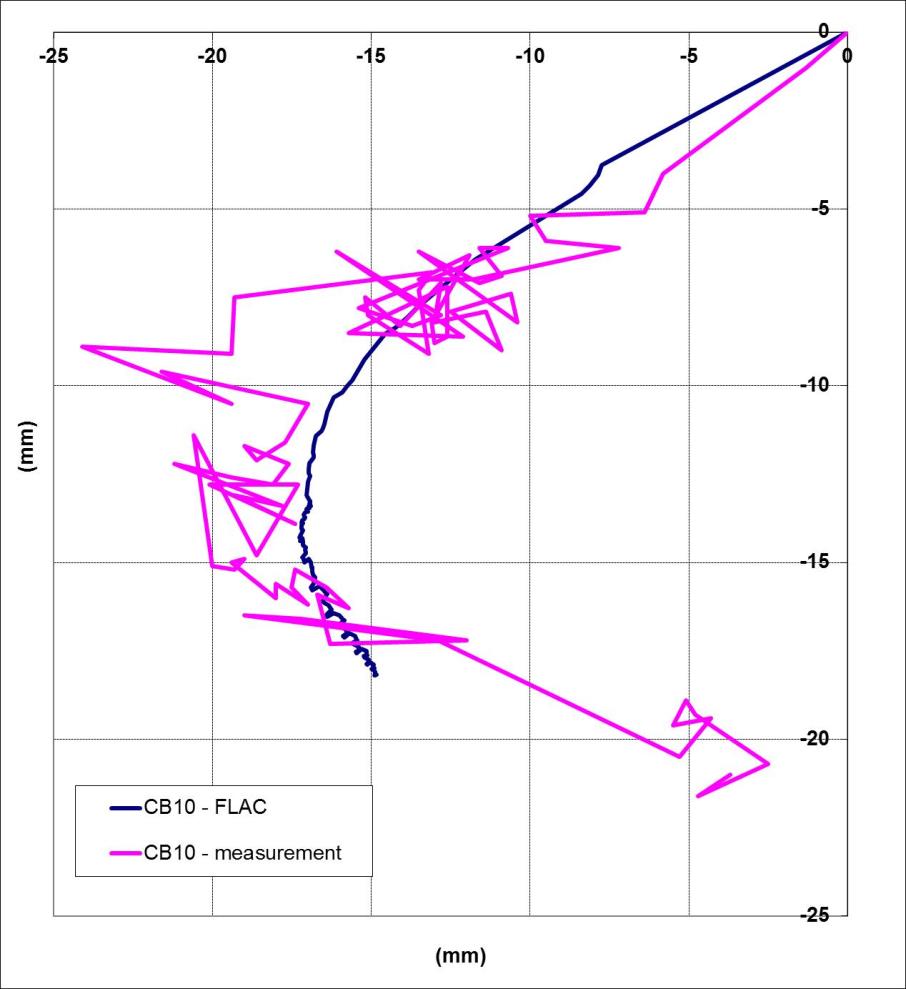
Figure 5.5 – Comparison of movement of monitoring point CB10
Conclusions
The Stepney Green caverns represent major SCL works of a large span and complex excavation and support sequence. Sophisticated numerical analyses were undertaken to support the primary lining design, check feasibility of various proposals and sensitivity to potential risks.
From the beginning of the design it was discussed whether the eastbound or the westbound cavern was the more critical in terms of design for the primary lining stress. The eastbound cavern is by 4.5m shallower and excavated predominantly within the London Clay whereas the bottom third of the westbound cavern is excavated within Lambeth Group Formation containing Channel Sands. Depressurisation scheme was designed to address the excavation in the granular strata and proved working during the construction. Potential impact of partial consolidation was discussed with respect to the westbound cavern. The monitoring measurements so far do not indicate a significant difference between the eastbound and westbound lining behaviour. The concerns about the potential partial consolidation during the short-term were acted upon during the design phase using a fully coupled fluid-mechanical numerical analysis however, it was found that such analysis was too complex and too sensitive to inputs to provide reliable predictions. The most important issue was the determination of appropriate effective stress strength parameters because of their major influence on the outcome of the short-term consolidation analysis. Such parameters should include dilation effects.
Traditionally, the temporary sidewalls are removed after full ring closure and full excavation of the central gallery. In such a case the excavation of the central gallery takes place in the confined space between the sidewalls. The numerical modelling work supported the feasibility of an alternative approach with step-by-step removal of the temporary sidewalls and ruled out concerns about instability of the partially excavated central core and closure of the tunnel before installation of invert. That allowed a more efficient and safer construction. The feasibility of the delayed installation of reinforcement on the near face was also verified by numerical analysis. The proposed approach allowed improved constructability and quality of the permanent SCL primary lining. Also the loads from the planned TBM transit on the primary lining were assessed by numerical modelling. Overall, the 3D models served as good means of testing various design concepts in terms of ground-lining interaction and structural impact on the primary lining.
2D numerical models were also carried out but considered less representative of the complex excavation and lining sequence due to lack of calibration against comparable case studies. The key issue in addition to calibration of ground relaxation parameters was found to be the modelling of the effects of removal of temporary structures such as side walls.
Trigger levels for lining convergence monitoring were defined based on displacements predicted by the numerical analyses. The triggers gave a reasonably good agreement between the analytical prediction and the monitored lining behaviour. The numerical models slightly underestimated the vertical movement of some points but generally overestimated the horizontal movement of all points. The lining movement after sidewall removal indicates the activation of the lining arch under the ground load. The crown points move downwards whereas the side points move into the ground.
List of notation
2D two-dimensional
3D three-dimensional
SCL sprayed concrete lining
MLGH Mid Lambeth Group Hiatus
p’ mean effective stress in the ground
Φ’ effective friction angle of the ground
c’ effective cohesion of the ground
cu undrained shear strength of the ground
A* initial stiffness parameter of the A* small strain stiffness ground model
G shear modulus of the ground
K0 in situ at rest lateral ground pressure coefficient
Eu undrained elastic modulus of the ground
Ecm mean elastic modulus of concrete to Eurocode 2
Ec,eff creep reduced elastic modulus of concrete to Eurocode 2References
Chang Y and Stille H (1993) Influence of early age properties of shotcrete on tunnel construction sequences. In proc. Shotcrete for Underground Support VI (eds. Wood & Morgan), Niagara-on-the-lake, Canada, 110-117. USA: ASCE.
Eadington J and O’Brien AS (2011) Stiffness parameters for a deep tunnel – Developing a robust parameter selection framework. In proc. 15th European Conference on Soil Mechanics and Geotechnical Engineering (eds. A. Anagnostopulost et al.), Athens, Greece, 531-536.
Jardine RJ, Potts DM, Fourie AB and Burland JB (1986) Studies of the influence of non-linear stress-strain characteristics in soil-structure interaction. Géotechnique 36(3): 377-396.
RILEM TC 162-TDF (2003) Test and design methods for steel fibre reinforced concrete. Materials and Structures 36: 560-567.
Standards:
BS EN 1992-1-1 – Eurocode 2: Design of concrete structures – Part 1-1: General rules and rules for buildings.
BS EN 1997-1 – Eurocode 7: Geotechnical design – Part 1: General rules.
BS EN 14487-1 – Sprayed concrete – Part 1: Definitions, specifications and conformity -
Authors

Michal Uhrin MSc CEng - Mott MacDonald
Mott MacDonald CZ
Thomas Schultheis MSc CEng - Gall Zeidler Consultants
Gall Zeidler Consultants
Nicholas Tucker Eur Ing BSc CEng MICE - Mott MacDonald
Mott McDonald Ltd