Strain monitoring using embedded distributed fibre optic sensors in a sprayed concrete tunnel lining during the excavation of cross-passages
Document
type: Technical Paper
Author:
N de Battista, Mohammed Elshafie, Kenichi Soga, G Hazelden, Y S Hsu
-
Read the full document
1. Introduction
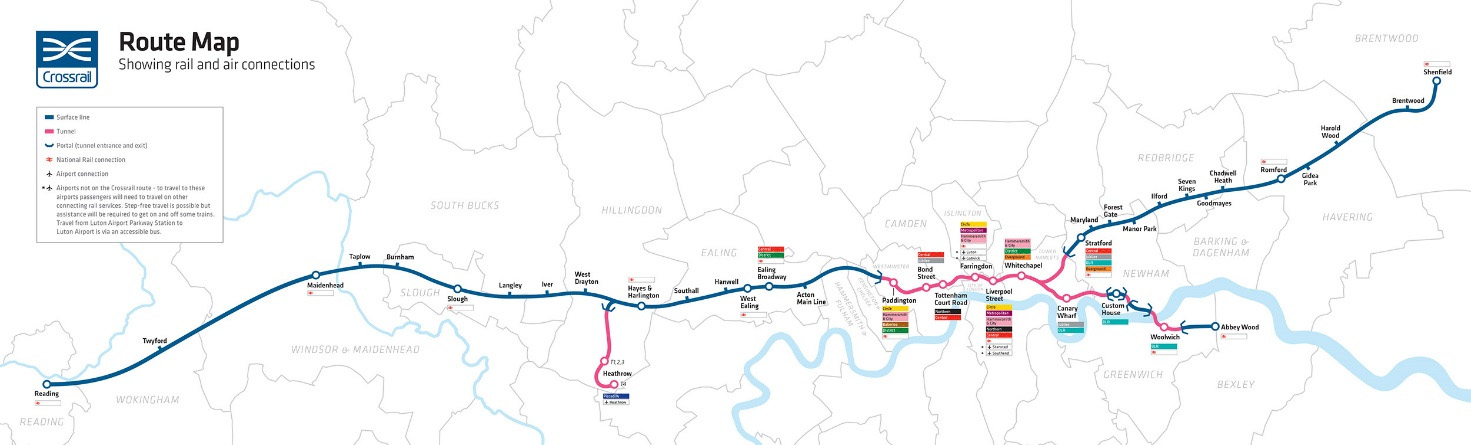
Crossrail is one of the most significant infrastructure projects in the UK, delivering a new railway linking Reading and Heathrow in the west with Shenfield and Abbey Wood in the east (Figure 1), at a construction cost of £16bn. The route is 136km (85 miles) long, including 21km (13 miles) of new twin-bore tunnels below central London. Of the 39 stations linked by the Crossrail route, ten are newly built and six of these are in central London. When the Crossrail service commences in 2018, it will increase London’s rail-based transport network capacity by 10%, supporting regeneration and cutting journey times across the city.
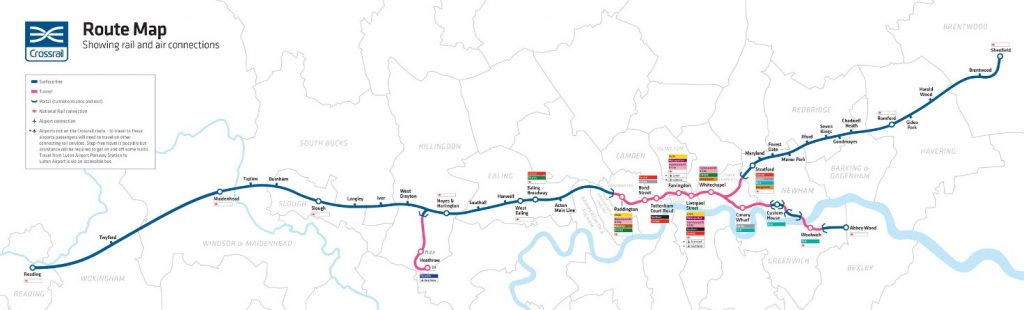
Figure 1 – Crossrail route map
Liverpool Street Station is one of the central London stations, constructed under Finsbury Circus and several of the listed buildings that surround it. It joins the existing Moorgate Station in the west with a new ticket hall in Broadgate in the east, and connects with the existing Liverpool Street Station (Figure 2). The whole complex provides an interchange between Crossrail, London Underground’s Northern, Central, Metropolitan, Circle and Hammersmith & City Lines, and connections to Stansted airport and National Rail services.
Crossrail Liverpool Street Station consists of two 240m-long platform tunnels and a central concourse tunnel, with 12 inter-connecting cross-passages, two escalator shafts and a number of access passages, ventilation and other service adit connections. The main contractor for the construction was BBMV, a joint venture between Balfour Beatty, Beton- und Monierbau (BeMo), Morgan Sindall and Vinci Construction.
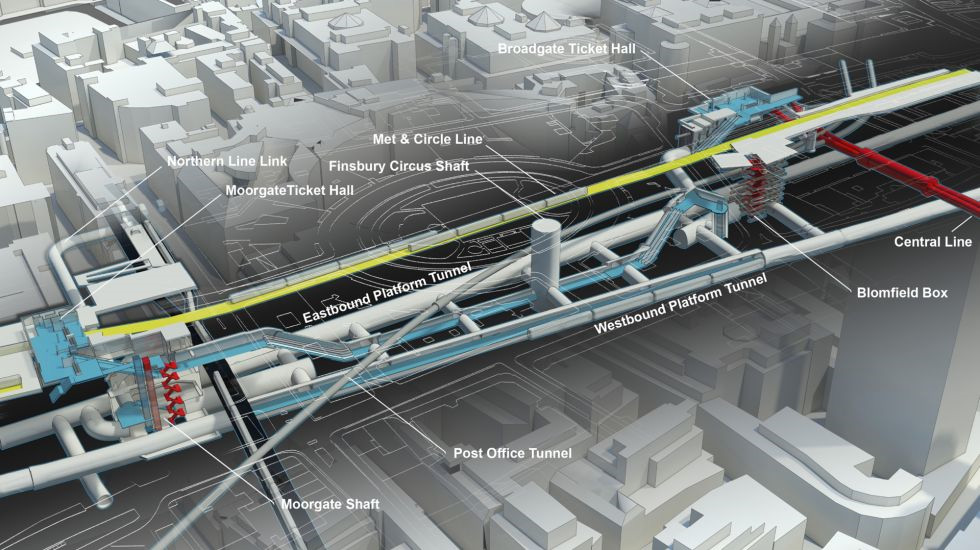
Figure 2 – The new Crossrail construction at Liverpool Street Station, connecting with existing tunnels and stations
1.1 Construction of Crossrail Liverpool Street Station
The construction at Liverpool Street Station was carried out using sprayed concrete lining (SCL) techniques based on a repeat cycle of one meter excavation by mechanical excavator followed by spraying of steel fibre reinforced concrete (SFRC) to support the ground. The LaserShell™ and TunnelBeamer™ technologies developed by Morgan Sindall were used by the Contractor (Eddie & Neumann 2004). Traditional optical monitoring was carried out to measure convergence of the tunnel’s primary lining. Following the construction of the three main tunnels, the various junctions were formed. At the location of these junctions, the tunnel lining was thickened and reinforced before the openings in the tunnel walls were made.
There are around 40 of these tunnel junctions at Liverpool Street Station alone, with multiple combinations of tunnel sizes, levels and ground conditions. A rational approach was developed for designing these junctions, based on a series of 3D finite element models of generic junctions, with varying aspect ratios between the parent and child tunnel. The models, which took into account the sequential stage construction of the junctions, helped the designers to understand the expected stress changes in the longitudinal and hoop directions within the parent tunnel, before and after the excavation of the smaller child tunnel. The models were used to derive design charts, from which the extent of thickening and / or the reinforcement required in the lining of the parent tunnel could be obtained. This was done for each type of junction, based on the dimensions of the parent and child tunnels and the factored hoop loads estimated from a plane strain analysis.
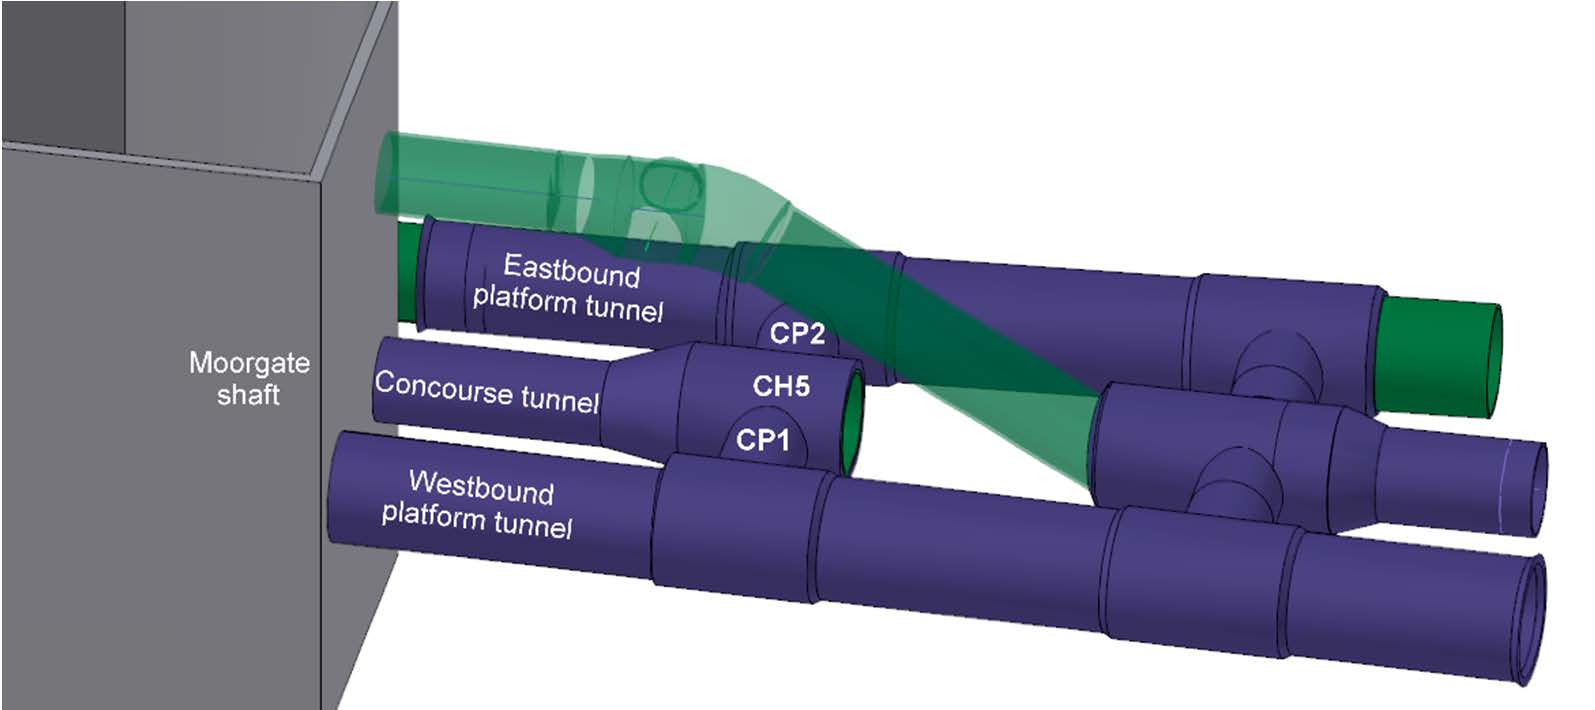
This investigation focuses on one of the main junctions connecting the concourse tunnel with the platform tunnels in Liverpool Street Station, at the enlargement chamber known as CH5 (Figure 3). This chamber is in the western end of the station, close to the Moorgate shaft, and it is connected to the westbound and eastbound platform tunnels by cross-passages CP1 and CP2 respectively. This part of the Station is excavated entirely in London clay.
The tunnel at CH5 has an excavated profile diameter of 10.8 m to 11.1 m. The primary lining is 40cm thick, on which an additional 40cm thickening layer of steel fibre and rebar reinforced concrete was sprayed, prior to the excavation of the cross-passages. Thus the total thickness of the SCL in CH5 is 80cm.
Each cross-passage was constructed in two phases, starting with a pilot tunnel of approximately 5.0m to 5.5m diameter, excavated in meter by meter advances. A few weeks after the pilot tunnel was completed, the full size enlargement followed, also excavated in meter by meter advances, to leave a final excavated profile of 7.0m to 7.2m in diameter, with a 20cm-thick primary SCL.

Figure 3. Model of the western end of Liverpool Street Station, showing the instrumented enlargement chamber CH5.
1.2 Current practice in monitoring of sprayed concrete tunnel linings
Following the collapse of three SCL tunnels at UK’s Heathrow Airport in October 1994 (HSE 2000), detailed review reports by the UK Health and Safety Executive (HSE 1996) and the Institution of Civil Engineers (ICE 1996) drew attention to some of the important weaknesses of using sprayed concrete in tunnelling projects. These include two points that are directly relevant to the work presented in this paper:
- It is difficult to design SCL tunnels because of the complex material behaviour of sprayed concrete.
- It is difficult to predict the behaviour of SCL tunnels in advance, hence the performance of the linings and the ground must be monitored during construction.
Therefore instrumentation is routinely specified and installed in practice, most often consisting of optical displacement measurements at discreet points on the tunnel lining. These displacements are generally small, of the order of a few millimetres, and are sensitive to measurement errors. In addition, deriving strain values from discreet displacement measurements involves making broad assumptions that are likely to induce significant estimation errors. Consequently, while optical displacement instrumentation can be useful for the day to day monitoring of safety in tunnel construction, it is not of much use in understanding the structural behaviour of the tunnel lining.
Occasionally, pressure cells are embedded in tunnel linings to measure either the radial boundary sresses subjected by the ground on the lining, or the tangential stresses within the lining, at discreet points. However, there is a general lack of confidence amongst tunnel engineers in the UK in the use of pressure cells in SCL tunnels, because it is difficult to install such instrumentation within sprayed concrete and to interpret the results (Golser et al. 1989; Mair 1998; Clayton et al. 2002). Without particular care during installation and interpretation, the data captured from embedded pressure cells is potentially inaccurate. Installation, temperature, shrinkage and crimping effects could all affect the pressure cell measurements, particularly the cells embedded into the lining to measure the tangential lining stresses (Clayton et al. 2000). A very strict procedure, which requires special calibration tests under site conditions, using the same mix as in the SCL, would need to be applied to stand a better chance of getting meaningful data from pressure cells (Jones 2007). These factors make it extremely difficult for the embedded pressure cells to be used successfully in practice.
Due to these shortcomings of traditional instrumentation, the structural behaviour of sprayed concrete tunnel linings is not well understood. Reliable field data upon which design models can be calibrated are very scarce, leading to uncertainty in estimating the stresses and strains sustained by the SCL, particularly in the vicinity of an opening such as a cross-passage. As a result, conservative assumptions are often made in the design of SCL around tunnel junctions.
2. Distributed fibre optic monitoring of the sprayed concrete tunnel lining
Performance-based design limits can be defined on the basis of the strain development in a structure. Although strain measurement techniques are well established, until recently current practice has been restricted to measurements at discreet locations by means of vibrating wire strain gauges, metal foil strain gauges or fibre optics utilising Fibre Bragg Grating technology. When instrumenting building components such as columns or beams, where the strain distribution is a function of the end conditions and the applied loading, point sensors are suitable to define the complete strain profile of the component. However, where structures interact with soil, such as in the case of SCL, the state of the structure cannot be not fully understood unless the complete in situ strain regime is known. Capturing the continuous strain profile is often invaluable to pinpoint localised problem areas, such as joint rotations, deformations and non-uniformly distributed soil-structure interaction loads. This is particularly important information for SCL, since the stage construction sequence results in many concrete joints.
2.1 Distributed fibre optic sensor technology
Distributed fibre optic sensing is based on the fundamental principle that a change in temperature or strain in an optic fibre affects the properties of a light signal (the intensity, phase and polarisation of the light wave) travelling along the fibre. Thus, the Brillouin optical time domain reflectometry (BOTDR) strain sensing technique can be used to measure ambient parameters such as strain and temperature, along the whole length of an ordinary fibre optic (FO) cable (Kurashima et al. 1993).
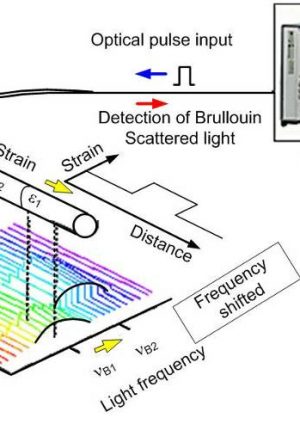
The BOTDR technique is illustrated in Figure 4. As an optical pulse input travels through the optical fibre, a small fraction of it backscatters at every location of the fibre. The frequency of this backscattered light is shifted from the original input frequency by an amount linearly proportional to the total strain (thermal and mechanical) applied at the scattering location. When the backscattered signal is resolved in frequency and time (converted to distance based on the speed of light), a complete strain profile along the full length of the fibre can be obtained.
As the Brillouin-based measurements detect shifts in frequency rather than the intensity of the backscattered signals, they allow for continuous measurements over a distance of tens of kilometres (Chiao et al. 1964; Nikles et al. 2004; Selker et al. 2006). Decoupling of the mechanical strain and temperature effects can be achieved by having the optic fibre cores separated from the protective rubber casing of the cable by a gel layer, isolating them from external strains applied to the cable. Thus, by measuring the Brillouin frequency shift simultaneously from an isolated fibre and a fully bonded fibre adjacent to each other (within the same cable or in two separate cables), a measure of both the temperature and the external mechanical strain can be obtained (Mohamad 2012).
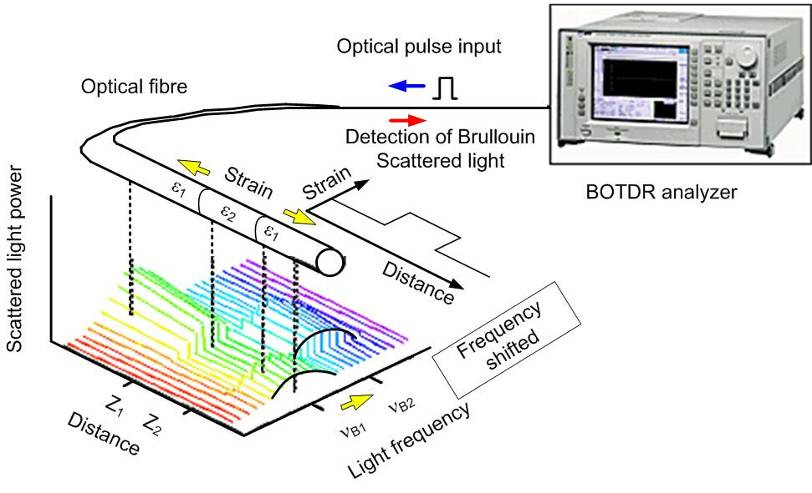
Figure 4 – The principle of Brillouin optical time domain reflectometry (BOTDR) strain sensing technique.
2.2 Distributed fibre optic sensor instrumentation at Crossrail Liverpool Street Station
In May 2014, the Centre for Smart Infrastructure and Construction (CSIC) at the University of Cambridge, in collaboration with Crossrail Ltd. and BBMV, embedded a distributed fibre optic sensor (DFOS) system within the SCL of the CH5 enlargement chamber at Liverpool Street Station. The objective was to monitor the changes in the continuous strain profile that occurred in the tunnel lining during the excavation of the cross-passages CP1 and CP2.
Four circuits of DFOS were installed, totalling approximately 105 m in length. These consisted of:
- Two rings around the circumference of the tunnel, one to the west and one to the east of the cross-passages, at a distance of 0.5 m from the widest point of the cross-passage openings.
- Two rectangles, one around each of the cross-passages, with the horizontal legs at a distance of 0.5 m above / below the highest / lowest point of the cross-passage openings, and the vertical legs at a distance of 2.0 m either side of the widest point of the openings.
Each DFOS circuit consisted of a pair of FO cables installed alongside each other: one cable with the optic fibres tightly bonded to the outer sheathing, used for total strain measurement (single mode Fujikura 4-core 9.5/125 JBT-03813) and another cable with the optic fibres contained loosely in a gel-filled tube, used for estimating temperature (single mode Excel 8-core 9/125 OS1).
The FO cables were installed on the surface of the 40 cm-thick primary SCL, before the additional 40 cm thickening SCL was sprayed onto it, such that the DFOS system was embedded approximately at the centre of the complete primary tunnel lining. The cable pairs were passed through eye-bolts fixed at approximately 1 m spacing on the surface of the primary SCL. The Fujikura strain cables were pre-tensioned by hand to approximately 1000 με and held in place using Fujikura cable clamps. These clamps were fixed to the surface of the tunnel lining at the ends and at three intermediate points for the ring circuits (total 5 per ring), and at the ends of each leg for the rectangular circuits (total 8 per rectangle).
During the erection of the rebar for the thickening SCL, the cables in the rectangular DFOS circuit around cross-passage CP2 were accidentally damaged and, due to time restrictions, they could not be repaired. Therefore only the remaining three circuits were used in this investigation. The cable ends from these circuits were routed out of the SCL, to a junction box at the edge of chamber CH5, where they were fusion spliced together end-to-end to form a single circuit. One end of this circuit was in turn fusion spliced to a 140 m-long FO extension cable, which was routed along the surface of the tunnel intrados to a nearby area within the tunnel, where the monitoring could be carried out in a safer environment and without obstructing the excavation works.
3. Strain profile measurements during cross-passage excavation
A Yokogawa AQ8603 BOTDR analyser was used to carry out the automated (unattended) strain monitoring during four periods between June and August 2014, covering from a few days before until a few days after each excavation stage of CP1 and CP2. Every reading took around 15 minutes to complete and readings were taken every 15 minutes during the first two monitoring periods and then every 30 minutes during the last two monitoring periods. When taking a reading, the BOTDR analyser scanned a frequency range from 10.4 GHz to 11.3 GHz, in 0.01 GHz steps. Each frequency sweep was repeated for 215 times and automatically averaged to reduce measurement noise. The data were discretised at 10 cm intervals along the entire length of the complete DFOS circuit.
The data from the loose-tube ‘temperature’ FO cables were used to estimate the temperature inside the tunnel lining, which was then used to separate the readings from the bonded ‘strain’ FO cables into thermally-induced strain and mechanical strain. Only the mechanical strain data is reported here, since this is the more significant (and by far the larger) of the two in understanding the structural behaviour of the tunnel lining.
Due to logistical difficulties, the first reading could not be taken until after the SCL of the CP1 pilot tunnel was broken out. This reading was used as a baseline, which was deducted from all subsequent readings. Therefore the results reported in this paper relate to the changes in tangential strain within the tunnel lining relative to the conditions immediately after the breaking out of the CP1 pilot tunnel.
3.1 Results
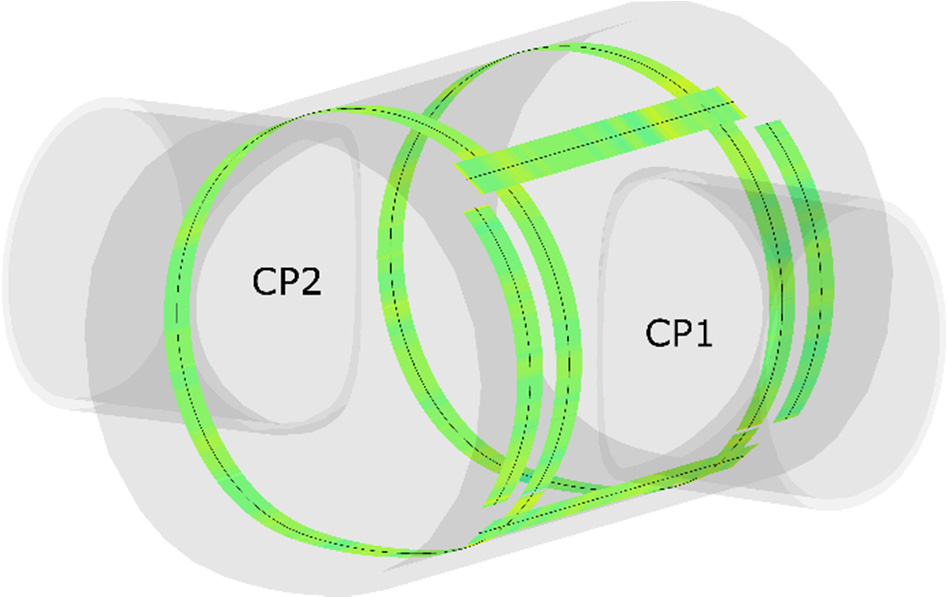
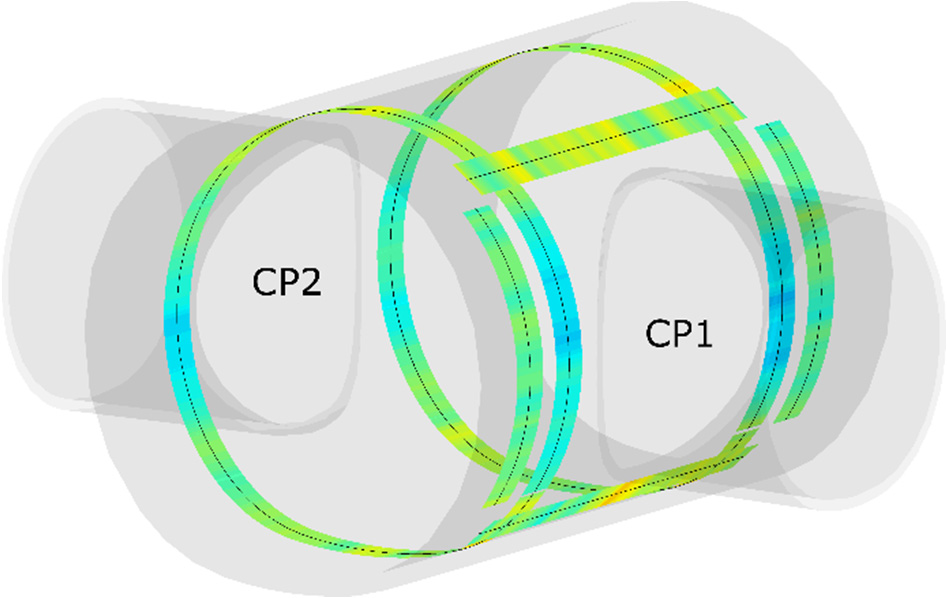
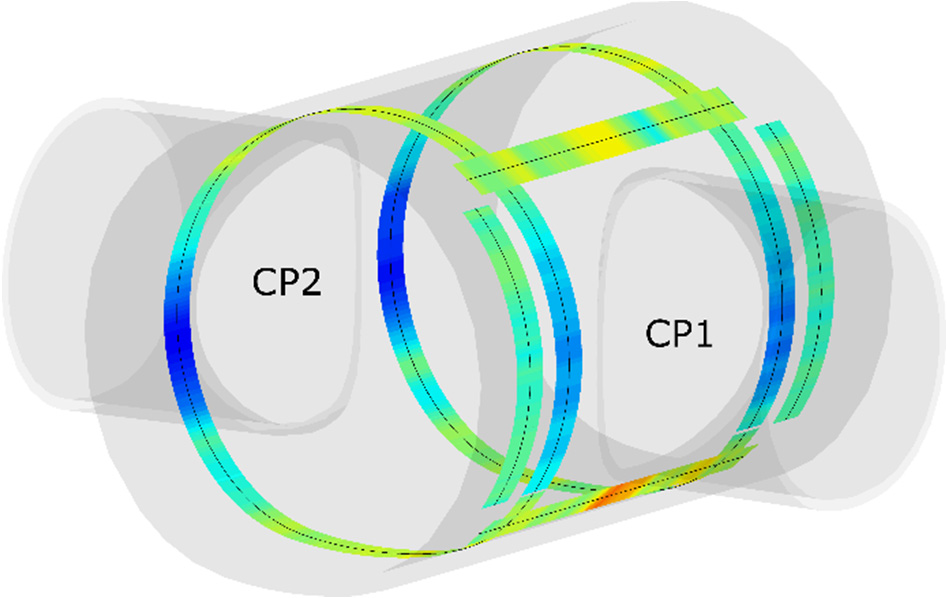
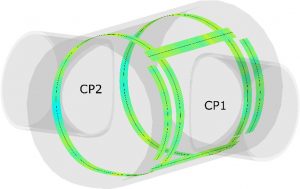
The changes in mechanical strain at various stages during the monitoring are shown in Figure 5, and the maximum strains recorded after any of the advances in the cross-passage excavation phases are listed in Table 1. The main changes in strain observed during the cross-passage excavations are:
- An increase in compressive hoop strain to the sides of the cross-passage openings, recorded on the two rings closer to the openings, up to a maximum of 820 με.
- A localised increase in tensile longitudinal strain directly below the centre of CP1, up to a maximum of 567 με.
Smaller increases in tensile strain were observed in the longitudinal direction above the centre of CP1 (maximum 324 με) and in the hoop direction close to the crown and invert of the tunnel (maximum 276 με and 505 με respectively).
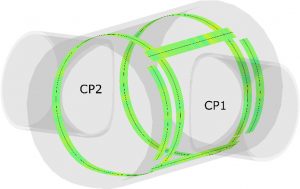
a) after completion of CP1 pilot tunnel
b) after completion of CP2 pilot tunnel
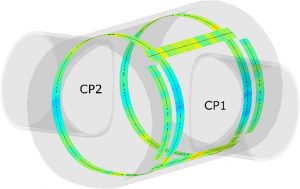
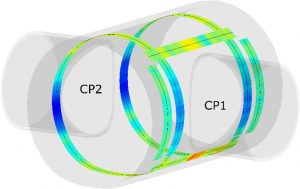
c) after completion of CP1 enlargement d) after completion of CP2 enlargement 
Figure 5 – Evolution of strain profile in the sprayed concrete tunnel lining at various stages during the excavation of cross-passages
Excavation stage Hoop strain [µε] Longitudinal strain [µε] Crown Invert CP1 sidewall CP2 sidewall
at 0.5m
Above
CP1
Below
CP1
at 0.5m at 2.0m CP1
pilot tunnel
-90 -154 -158 -96 -88 -77 -132 173 276 170 232 122 154 121 CP2
pilot tunnel
-89 -137 -143 -144 -271 -109 -124 142 293 110 114 90 171 103 CP1
enlargement
-150 -203 -418 -349 -384 -243 -214 276 505 269 233 119 266 365 CP2
enlargement
-243 -256 -605 -313 -820 -238 -143 258 364 152 182 83 324 567 Table 1 – Maximum recorded compressive (-ve) and tensile (+ve) strains during each of the crosspassage excavation stages. The main action at each location is shown in bold text.
3.2 Discussion
The strain profiles observed during the breaking out and excavation of the cross-passages and their pilot tunnels, are indicative of arching action in the tunnel lining in order to redistribute the superimposed load around the openings. As expected, the majority of the strain increase was observed at the beginning of each stage, when the tunnel SCL was being broken out.
All the levels of strain observed during the monitoring are less than half of the predicted design value. However it is important to note that the values reported from this investigation are indicative of the change in tangential strain during the cross-passage excavation. Therefore these values do not account for the existing strain in the SCL prior to the cross-passage excavation. Neither do they include the strain resulting from any bending of the lining perpendicular to the tunnel walls, which is likely to take place in the immediate vicinity of the cross-passage openings.
The hoop strain data from the tunnel sidewall region around CP1 (third and fourth columns in Table 1) yield important insight into the extent of the effect that the excavation of the cross-passages has on the tunnel lining. The maximum compressive hoop strain recorded at a distance of 2 m from the edge of CP1 (349 με) amounts to just over half of that recorded 0.5 m away from the edge of the same cross-passage (605 με). This indicates that the load redistribution within the tunnel SCL during the cross-passage excavation is localised and any significant increase in strain is limited in extent to a relatively small distance from the openings.
What these findings suggest is that the utilisation of the thickening SCL layer diminishes rapidly with increasing horizontal distance from the cross-passage openings. The data reported in this paper show that it is unlikely that the thickening layer is necessary beyond the first 3 m either side of the openings, including the anchorage length required for the reinforcement bars in the lining.
Limiting the thickening SCL in CH5 at Liverpool Street station to a distance of 3 m either side of the cross-passages, would reduce the amount of steel-fibre and rebar reinforced sprayed concrete by approximately 75 m3, which is about one third of the total volume used in the thickening layer.
Extrapolated to the whole station, which has at least 18 enlargement chambers of similar dimensions, the reduction in concrete would amount to approximately 1350 m3. Even more significant, from the perspective of the SCL construction sequence, reducing the extent of the thickening layer would also reduce the amount of steel reinforcement bars that need to be installed. Besides the obvious material savings, reducing the extent of the thickening SCL would speed up construction, reduce the amount of hazardous steel fixing at heights and concrete spraying operations, and allow smaller parent tunnels to be constructed thereby reducing the danger of ground settlement and producing less excavated material.
4. Conclusion
A distributed fibre optic sensor (DFOS) system was embedded within the sprayed concrete tunnel lining of one of the enlargement chambers of Crossrail’s Liverpool Street Station concourse tunnel. The system was used to capture the changes taking place in the strain profile of the tunnel lining, as cross-passages were being excavated on either side of the tunnel. Being quasi-continuous along the length of the fibre optic cables, the data revealed in detail the behaviour of the tunnel lining during each stage of the cross-passage excavation, and the changes in strain within the lining as the superimposed load was redistributed.
The maximum recorded compressive tangential hoop strain was 820 με (to the side of the crosspassage opening), while the maximum recorded tensile tangential longitudinal strain was 567 με (below the cross-passage opening). The strain profiles obtained at various stages during the crosspassage excavations show that the increase in strain in the tunnel lining reduces rapidly with increasing distances from the openings. This indicates that a reduction in the extent of the thickening SCL layer is possible, in this case cutting the amount of steel fibre and rebar reinforced concrete used in the thickening layer by as much as one third.
For projects involving large amounts of SCL tunnelling, such as Crossrail, there are significant savings in materials, time and labour, that can be made from reducing the amount of thickening SCL that goes into strengthening the tunnel walls prior to the formation of openings such as cross-passages.
Naturally, one investigation alone cannot justify such a change in design practice. We hope that this ground-breaking study will serve as a catalyst for infrastructure owners and researchers to carry out similar studies on different types of SCL tunnel construction techniques. Based on the experience gained from this study, we recommend that a number of parameters are monitored, in order to improve the understanding of the structural behaviour of tunnel SCL during the formation of openings. These are:
- Strains from any bending moments that may occur in the SCL in the vicinity of the openings.
- Hoop and longitudinal strain profiles at various distances from the openings, so as to investigate the extent of the effect of the openings on the tunnel SCL.
- Hoop strain profile in the crown and invert of the tunnel, in line with the openings on plan.
- Early-age strain in the SCL, in order to obtain a measure of the total strain in the lining.
While it is unlikely that current DFOS technology will replace the traditional optical displacement measurement systems for monitoring the safety of tunnels during construction, this investigation has shown that DFOS systems are an excellent candidate for recording the structural behaviour of the tunnel lining. When embedded inside the tunnel SCL, a DFOS system is unrivalled in the level of detail that it can provide for reconstructing the continuous strain profile of the lining. As with any instrumentation that is installed in a live construction site (more so a confined tunnelling site), care must be taken to not damage the fibre optic cables, as these are difficult to repair on the spot. On the other hand, from this study we have found that the right type of fibre optic cable can easily withstand the pressure of the concrete sprayed directly onto it, without being damaged in the process.
References
Chiao, R., Townes, C. & Stoicheff, B., 1964. STIMULATED BRILLOUIN SCATTERING AND AND COHERENT GENERATION OF INTENSE HYPERSONIC WAVES. Physical Review Letters, 12(21), pp.592–595.
Clayton, C.R.I. et al., 2000. INSTRUMENTATION FOR MONITORING SPRAYED CONCRETE LINED SOFT GROUND TUNNELS. Proceedings of the ICE – Geotechnical Engineering, 143(3), pp.119–130.
Clayton, C.R.I. et al., 2002. THE PERFORMANCE OF PRESSURE CELLS FOR SPRAYED CONCRETE TUNNEL LININGS. Géotechnique, 52(2), pp.107–115.
Eddie, C.M. & Neumann, C., 2004. DEVELOPMENT OF THE LASERSHELL METHOD FOR TUNNELING. in L. Ozdemir, ed. Proceedings of the North American Tunneling Conference 2004. Atlanta, GA.
Golser, J., Schubert, P. & Rabensteiner, K., 1989. A NEW CONCEPT FOR EVALUATION OF LOADING IN SHOTCRETE LININGS. in Proceedings International Congress on Progress and Innovation in Tunnelling. pp. 79–85.
HSE, 1996. SAFETY OF NEW AUSTRIAN TUNNELLING METHOD (NATM) TUNNELS, London, UK: HMSO.
HSE, 2000. THE COLLAPSE OF NATM TUNNELS AT HEATHROW AIRPORT, London, UK: HMSO.
ICE, 1996. SPRAYED CONCRETE LININGS (NATM) FOR TUNNELS IN SOFT GROUND, London, UK: Thomas Telford Publishing.
Jones, B.D., 2007. STRESSES IN SPRAYED CONCRETE TUNNEL JUNCTIONS. PH.D. Thesis. University of Southampton.
Kurashima, T. et al., 1993. BRILLOUIN OPTICAL-FIBER TIME DOMAIN REFLECTOMETRY. IEICE Transactions on Communications, E76-B(4), pp.382–390.
Mair, R.J., 1998. GEOTECHNICAL ASPECTS OF DESIGN CRITERIA FOR BORED TUNNELLING IN SOFT GROUND. in Proceedings of the World Tunnel Congress ’98 on Tunnels and Metropolises. Sao Paulo, Brazil: Balkema, pp. 183–199.
Mohamad, H., 2012. TEMPERATURE AND STRAIN SENSING TECHNIQUES USING BRILLOUIN OPTICAL TIME DOMAIN REFLECTOMETRY. in T. E. Matikas, ed. Proceedings of SPIE 8346, Smart Sensor Phenomena, Technology, Networks and Systems Integration. San Diego, CA, p. 83461M.
Nikles, M. et al., 2004. LEAKAGE DETECTION USING FIBER OPTICS DISTRIBUTED TEMPERATURE MONITORING. In E. Udd & D. Inaudi, eds. Proceedings of SPIE 5384, Smart Structures and Materials 2004: Smart Sensor Technology and Measurement Systems. San Diego, CA, pp. 18–25.
Selker, J.S. et al., 2006. DISTRIBUTED FIBER-OPTIC TEMPERATURE SENSING FOR HYDROLOGIC SYSTEMS. Water Resources Research, 42(12), p.W12202.
-
Authors