Systems Architecture Models in Crossrail Design and Delivery – Client’s perspective
Document
type: Technical Paper
Author:
Ka-Ho Li, George Georgiou, ICE Publishing
Publication
Date: 30/09/2017
-
Read the full document
Acronyms
CAD Computer Aided Design CARE Crossrail Assurance Reporting Environment COS Central Operating System CRL Crossrail Limited HV High Voltage OCCC Operational Control Command and Communications OHLE Overhead Line Equipment O&M Operation and Maintenance SBS Systems Breakdown Structure SLD Single Line Diagram T&C Testing and Commissioning UML Unified Modelling Language VAP Verification Activity Plan 1. Introduction and Context
1.1 Introduction, Systems Engineering and Systems Architecture
The sheer scale and complexity of created systems has grown over the decades, and the need to understand the ‘bigger-picture’ leads organisations to an increased use of models and system architectures as part of the systems engineering discipline. This is driven by the need to communicate and coordinate the developing system in terms of its components and interrelationships (both internal and external), to the wider stakeholder audience, such as designers and end-users [1].
Created systems are intended for specific purposes or primary functions, for example, a passenger railway system transports people to and from various locations. However, to achieve this, the systems and its architecture must also meet other requirements such as safety, maintainability, flexibility and so on. This invariably leads to trade-offs and analysis of options. In addition, complex systems have behaviours and properties that are above and beyond those of its components. Some of these are engineered deliberately as the product of the design activity while other behaviours or side effects arise as a consequence of the complexity. These are known as emergent behaviours and may represent properties that are possibly useful, or as more often feels to be the case, unwanted. Modelling the architecture of the system can be an invaluable tool to understand these aspects [2].
The purpose of this document is to describe a suite of drawings and tools used during the development of the Crossrail project which could be usefully applied to other projects.
Several pre-requisites need to be established in order to conduct the engineering of systems and the efficient use of models to depict the system architecture [3]. Amongst these are included;
Process: the individual tasks performed in a logical sequence to develop the system and arrive at the stated goal,
Method: the practice or procedures that define how each task is to be performed,
Tool: the architectural representation to be employed in forming the model,
Environment: the software tools to be used to build and complete the systems architecture model.
It should be noted that the system architectural models can be depicted in formal or informal representation [4], and the examples illustrated in this paper includes both types.
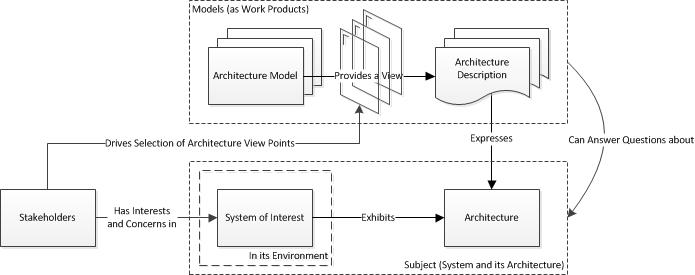
Figure 1: Context of Systems Architecture Models
1.2 Context, Crossrail Lifecycle Development
CRL are accountable for the delivery of the integrated railway from Reading and Heathrow in the west to Abbey Wood and Shenfield in the east. This includes the integration of works carried out by others, i.e. Network Rail, Canary Wharf Group and Berkley Homes, with the Central Section Works.
Integration activities start in requirements and design and continue all the way through construction and into testing and commissioning. At the programme level within Crossrail it can be defined as the task of detailing and apportioning the Sponsors’ Requirements into components or sub‐systems that can be designed and built, and then bringing together these components into a system and ensuring that they deliver a safe, operable and working railway that meets the sponsors’ requirements.
Systems Integration ensures the rail systems, rolling stock and infrastructure, combined with operations and maintenance (O&M) processes, deliver a resilient operational railway that meets requirements. A key element of systems integration is the formulation and use of models to abstract and characterise important features of the systems. CRL has developed a series of system architecture drawings which diagrammatically represent the railway, showing the various systems and their interfaces.
The system architecture drawings provide a means for visualising and controlling the configuration of the railway.
It should be noted that the architecture models and drawings explained in this paper are derived from the ‘client’ perspective. Models also exist from the designer perspective but are not discussed here.
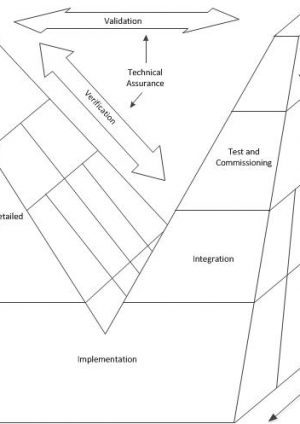
The Crossrail development programme follows the commonly used V-lifecycle [5]. This is depicted in the diagram below, Figure 2.

Figure 2: V-Lifecycle
Starting on the left-hand side of the V, partitioning of the top level requirements and definition activities determine the system architecture, creating the details of the design. This progresses from concept designs, through detailed designs, to procurement. Testing and integration flow up and to the right as successively higher levels of subsystems are integrated, culminating at the system level which are validated against the original top level requirements. Verification occurs at several stages to ensure that the outputs of one stage adequately meets the requirements of the previous stage. The diagram above illustrates that the breadth of systems engineering and design increases as definition and detail is developed, and the needs of multiple disciplines becomes more significant. Partitioning is necessary to allow devolution of tasks to various organisations and experts in a manageable way. Integration is then required to assimilate the detailed products and implementations back into a single coordinated and functioning system.
The requirements for system architectural models is different for each of the lifecycle stages and this paper is structured by lifecycle stages.
Table 1: Systems Architecture Models Developed for the Crossrail Project Lifecycle Chronology Episode of Work Stakeholders / Users Architectural Description Work Product View Point / Concerns Resolution Physical Representation Modelling Tool / Environment Architectural Description Language Remarks Concept Design Stage 2007-2008 System Integration Models Systems Designer Class Diagrams and Interface Diagrams Linewide and Per System Sub-system and Elements Non-Geographical UML Model Formal Systems Interface Structure Procurement Stage 2009-Present Contract Allocation Projectwide Scope Map Linewide Facilities, Systems and Individual Contracts Geographical Visio Informal Contract scope and relationships Scheme and Detailed Design 2012 Systemwide Architecture Technical Directorate Level 0 Architecture Diagram Linewide Sub-system and Elements Semi-Geographical CAD Informal Control systems and connectivity Level 1 Architecture Diagram Linewide Sub-system and Elements Geographical Visio Informal Systems connectivity diagram Contractor’s Design and Build 2014-Present Crossrail Assurance Reporting Environment Technical Assurance Systems Breakdown Structure Diagram Linewide Facility and Systems Semi-Geographical Visio Informal Visual structure underlying the CARE toolset Systems Integration 2014-2015 Verification Activities Technical Directorate Systems Architecture Diagrams Per Facility Sub-system and Elements Geographical Visio Informal Key links between equipment and plant rooms Testing and Commissioning 2015-Present Test and Commissioning Systems Architecture Overview Delivery, Technical Directorate Level 0/1 Systems Architecture Diagram Linewide Sub-system and Elements Geographical Visio Informal System entities mapped onto physical assets Level 2/3 Systems Architecture Diagrams Per Facility / Per System Sub-system and Elements Geographical / Semi-Geographical (for Systems) Visio Informal Systems interfaces associated with system entities 2. Project Lifecycle Application
2.1 Concept Design Stage
Systems Integration Models
This architecture model comprises a suite of models for each sub-system.
They are derived from the requirements, interface matrix, scheme designs and domain knowledge for each system.
These models show the systems, their architectures and their interfaces and are used, to provide information on the architecture of the overall Crossrail rail system and affords a vehicle for the tracking and management of the interfaces in the concept stage of the development. They also inform the consequential development of system design specifications that drive the detailed design stage.
The models adhere to a formal representation known as the Unified Modelling Language (UML), which is well suited to this kind of modelling work, helping to prevent replication and inconsistency at interface points.
Each system has a Class Diagram and Interface Diagram, the former providing the overview of the architecture and the latter, more detail on the attributes and operations of each interface. Interfaces are ‘owned’ by a particular package and this is detailed by the package designation titled on each interface and it’s respective colouration.
In each class diagram, all models have an element designated as ‘System’ which represents the system as a whole. This is then broken down into its parts, for more detail and clarity on the interfaces between sub-systems. Interfaces are shown in the class diagrams using pre-defined symbols.
Each interface is designated as one of four types:-
- System Interface
- Physical Interface
- Information Interface
- Construction Interface
Interfaces are assigned to an ‘owning’ system. The designer of that system takes on the responsibility of ensuring that the interface is correctly specified and agreed with the interfacing party. This is indicated where interfaces carry the colour of the owning system.
For each interface owned by a system, an entry in the interface diagram appears. This shows the interface represented by a rectangle with the interface attributes shown. This includes items such as issues at the interface, references to requirements, Systems Design Specifications (SDS) and entries in the interface management database (IFM). These attributes are tracked to provide a picture of interfacing across the project and to highlight areas where the interface definition and integration may be weak.
Two examples are illustrated below in figures 3 and 4.
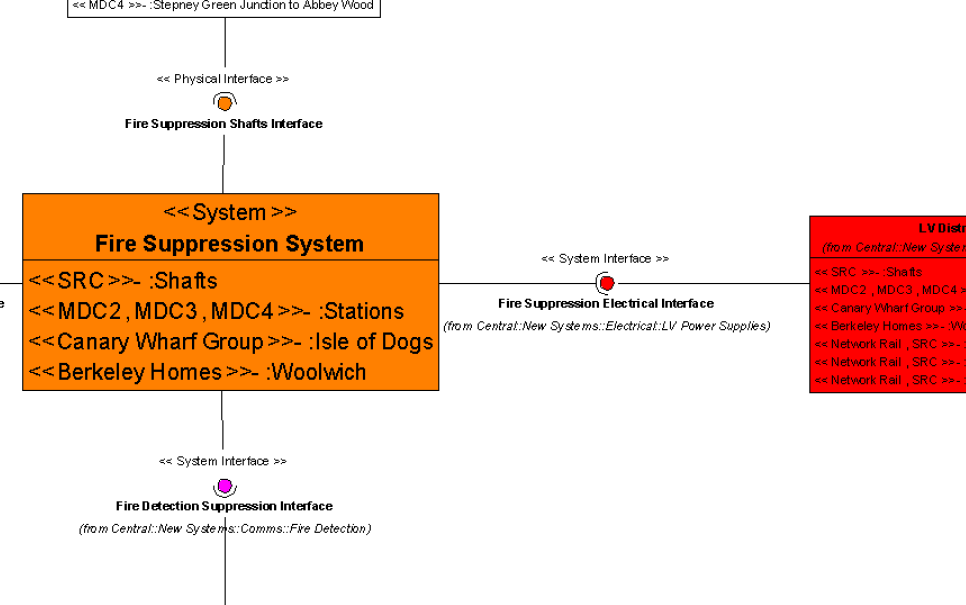
Figure 3: Fire Suppression example from the Systems Interface Structure
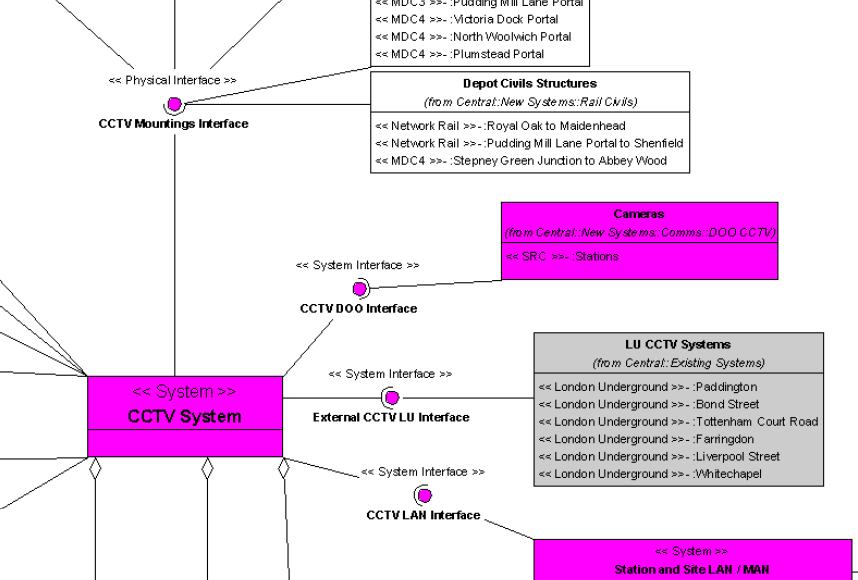
Figure 4: CCTV Example from the Systems Interface Structure
2.2 Procurement
Contract Scope Map
Procurement in a project such as Crossrail often occurs throughout the lifecycle. Contracts for design work at concept stage, detailed design stage, as well as for construction, testing and commissioning then results in a complex collection of work packages each with their own scope of responsibility and boundaries. It is important that the sum of scope of the work packages cover the entire project without overlaps or gaps.
The Contract Scope Map is a schematic of the central section works and represents the contracts by block shapes (eg stations by ellipses, station contracts by rectangles, portals by hexagons, etc) that mirror the railway linear trace. Each shape is annotated by the contract title and number. Colour coding is used to show organisational groupings, while border colours indicate contract status (to be awarded, in progress, finished). It is contained within a single page and is illustrated in figure 5 below. An enlarged section is shown in figure 6.
Contracts that apply across the trace are indicated by cylinders. This diagram is developed in Visio, and the facility added to hyperlink each contract block to a sheet within the electronic Crossrail document depository providing high level metadata of that contract (eg description, interface works, work sites, etc) when viewed on-screen. Collectively, this data is known as the Scope Book.
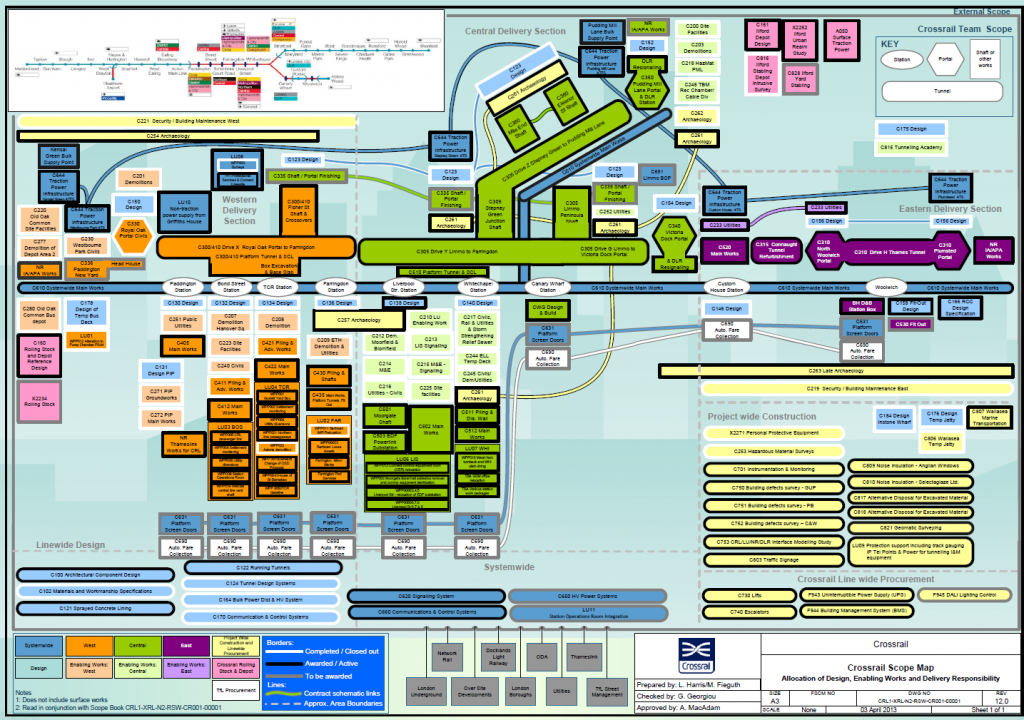
Figure 5: Contract Scope Map
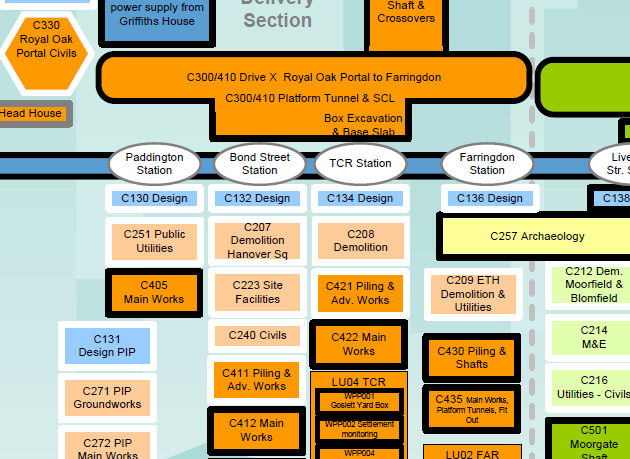
Figure 6: Enlarged section of the Contract Scope Map
It provides a simple means to identify potential interfacing contracts, and as a reference to understand the scope, complexity, and volume of contract entities and their interrelationships.
2.3 Scheme and Detailed Design
For the Scheme and Detail Design Stage, two models are described, Level 0 and Level 1 Systems Architecture Diagrams.
Level 0 Systems Architecture Diagram
This schematic diagram serves as a one-page view of the main systems comprising the Crossrail railway. An extract from the diagram is shown in figure 8. It includes generic representations of systems in the surface section, the Route Control Centre, Back-up Control Facility, depots, sidings, stations, power supplies, portals, shafts, cross-passages, and the rolling stock. The schematic consists of simple block diagrams to represent major functional items and lines to represent high-level connectivity.
Major linear sub-systems such as data networks, over headline equipment, and high-voltage power distribution are shown as ‘system-pipes’. It does not adhere to a formal architectural description language.
The railway systems on a page is a very useful tool that is used to describe the intended systems and connectivity, and provide a ‘parent’ architecture from which more detailed lower level system architectures can be promulgated. It exists as a CAD drawing and exported as an Adobe file for wider distribution.
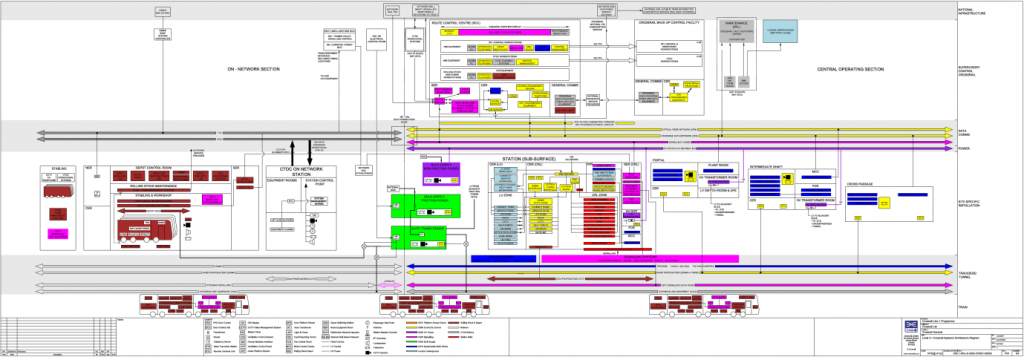
Figure 7: Level 0 Systems Architecture Diagram During Scheme Design Phase
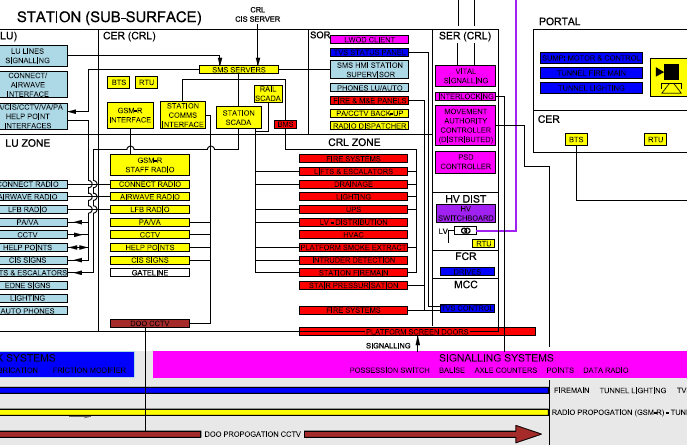
Figure 8: Extract of the Level 0 Block Diagram
Level 1 Systems Architecture Diagram
The systems connectivity diagram takes the previously described Level 0 Block Diagram, informed by the Systems Interface Structure and subsequent development, a step closer to the real thing by creating instants of all locations and systems.
The result is a significantly larger diagram with a great deal more nodes and connections. This creates its own problem and the user is at risk of being overwhelmed by an excess of criss-crossed lines and blocks. To make this manageable, the diagram is generated with layers giving the user the ability scrutinize the architecture by switching on and off strata. The selection is provided on the left-hand side of the diagram and contains some 30 or so layers categorised by systems and designer organisations.
This diagram is far more focused on expressing the complexity of connectivity rather than the higher level functional view of the level 0 system architecture.
The tool is developed on Visio and exported to pdf format for wider use. Figure 9 below shows a small section of the model and the selection tools to switch layers on and off.
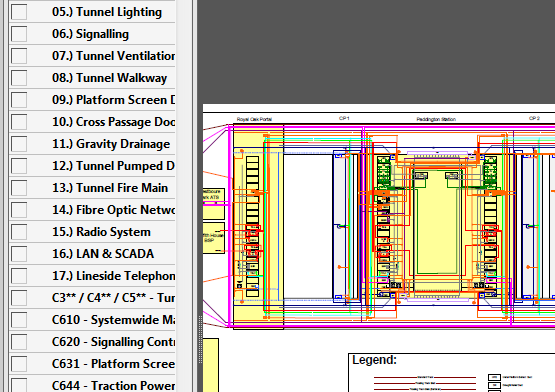
Figure 9: Extract from the Level 1 Systems Architecture Diagram indicating layer selection tools
The ability to control which layers are made visible is illustrated by comparing Figure 10 which only has the railway systems elements shown and Figure 11 which adds the HV sub-systems as well as the Communications and Control sub-systems.
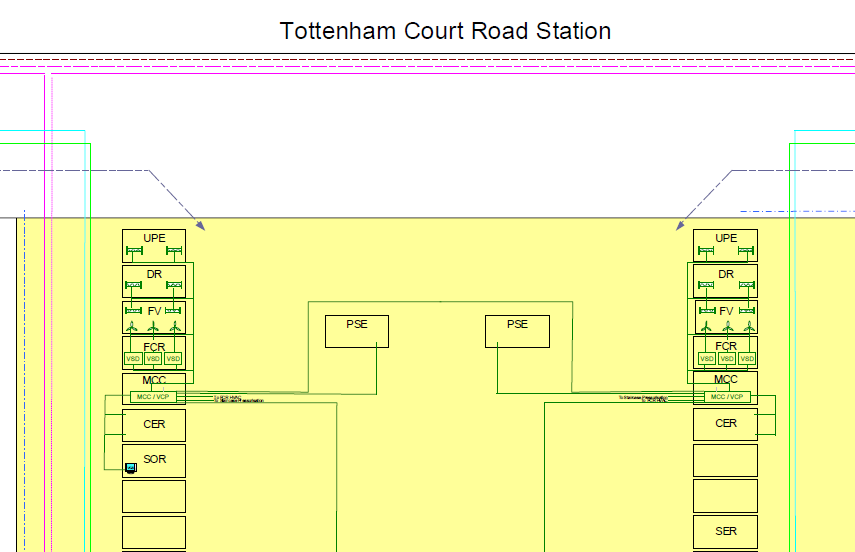
Figure 10: Extract of the railway systems elements within the station
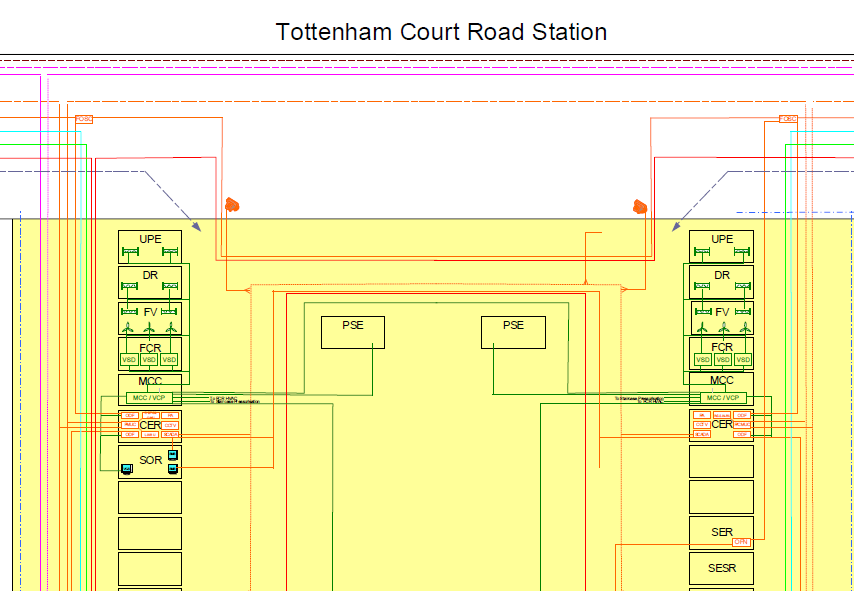
Figure 11: Extract of the HV sub-systems and Communications and Control sub-systems in addition to the railway systems elements within the station
2.4 Technical Assurance
Systems Breakdown Structure
The SBS constitutes a hierarchical structured diagram to depict the assets and systems that make up the Crossrail railway. Breakdown structures are often used to show how various elements can be broken down into elements and can be used to present workpackages, products, equipment, and systems amongst other. This structure forms the pictorial front end for the Crossrail Assurance Reporting Environment (CARE), a tool employed to capture essential items needed to evidence assurance. The SBS provides a breakdown view to allow the user to navigate to a particular section and level of the assurance reports and deliverables.
A total of 4 levels are utilised, level zero represented the Crossrail railway, level 1 the major divisions;
- Central Operating Section Stations
- On-Network Works (surface works)
- Routeway
- Rolling Stock & Depot
- Maintenance Systems
Level 2 partitions these divisions further into individual stations, portals and shafts groupings, depots, railway systems etc. Level 3 provides the lowest level of the SBS such as individual systems and structures. The CARE tool facilitates navigation from these lowest levels items to assurance summary forms which are stored and maintained in the CARE environment. Figure 12 is a portion of the SBS indicating the use of levels, in this case level 0 through 2. Figure 13 is an expanded extract to illustrate what details are represented
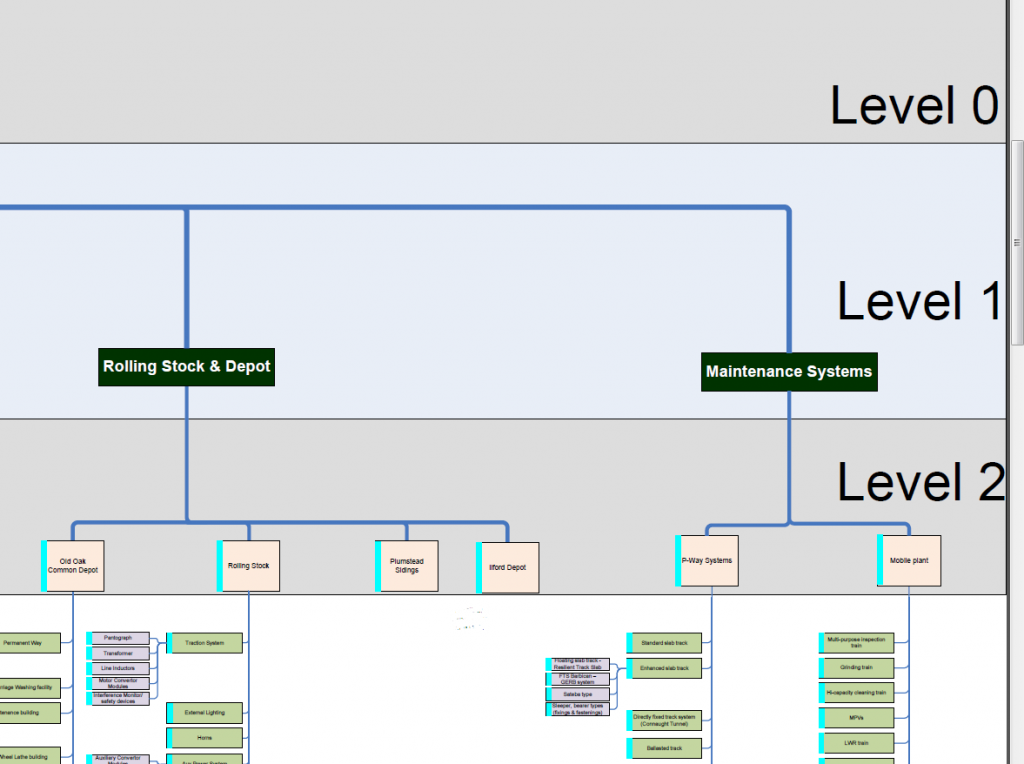
Figure 12: Portion of the SBS indicating the use of levels.
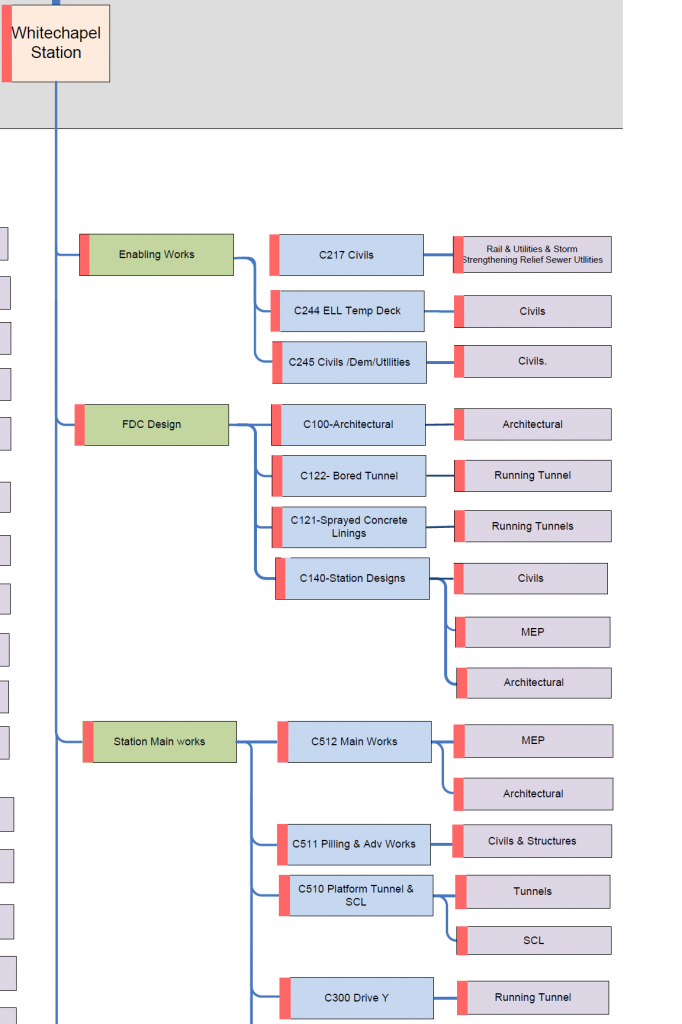
Figure 13: Expanded extract to illustrate details represented in the SBS
2.5 Systems Integration
In order to drive systems integration effort from stations, shafts portals with the systemwide contracts a series of systems architecture diagrams are produced to support the Verification Activity Plans (VAPs).
The diagrams aim to capture the system interfaces in the form of key links within the facility footprint and include the main passenger circulation areas, platforms, running tunnels, back of house areas, SOR, ticket hall and in the case of interchange locations, LU, DLR or LO platforms.
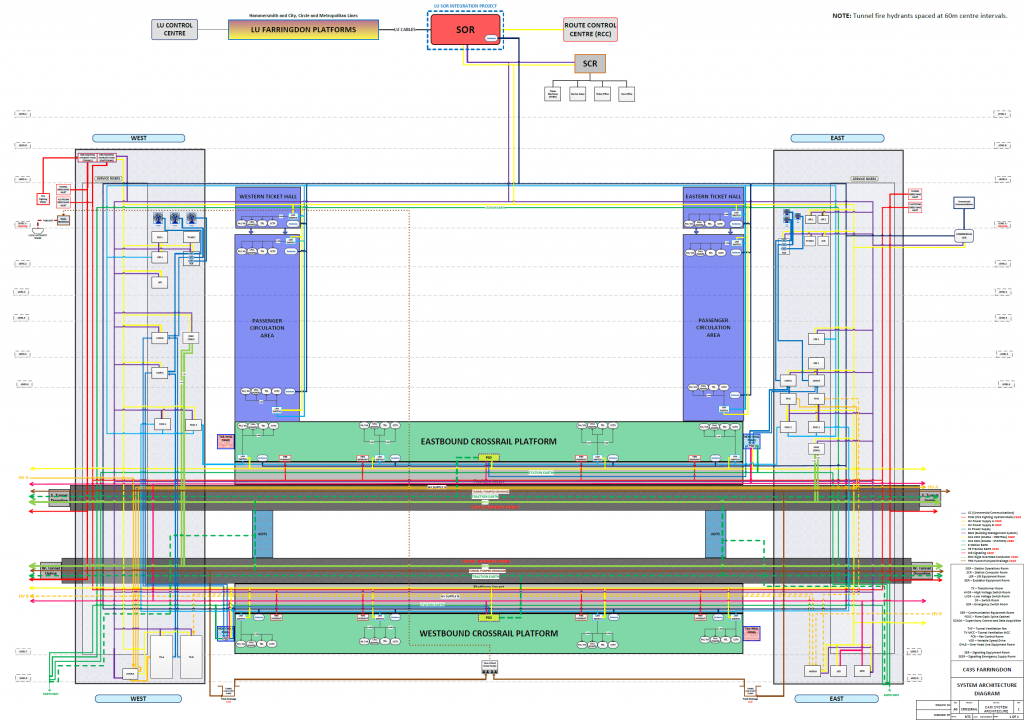
Figure 14: Example of Farringdon Systems Architecture Diagram for VAP
2.6 Test and Commissioning
The process by which the various elements that make up the Crossrail transport system are progressively integrated together, and demonstrated to deliver the Stakeholders’ requirements, is known as Integration, Testing and Commissioning. It is part of the Verification and Validation process and comprises:
- Factory acceptance of each sub‐system before delivery to site, or off‐site test facility,
- Integration of each sub‐system to work with its interfacing sub‐systems, making use where appropriate of off‐site test facilities;
- Testing of each sub‐system and then the integrated system to demonstrate that they meet their requirements;
- Commissioning of each system to form the total railway, and
- Handover to the Infrastructure Managers and Operators for further trials.
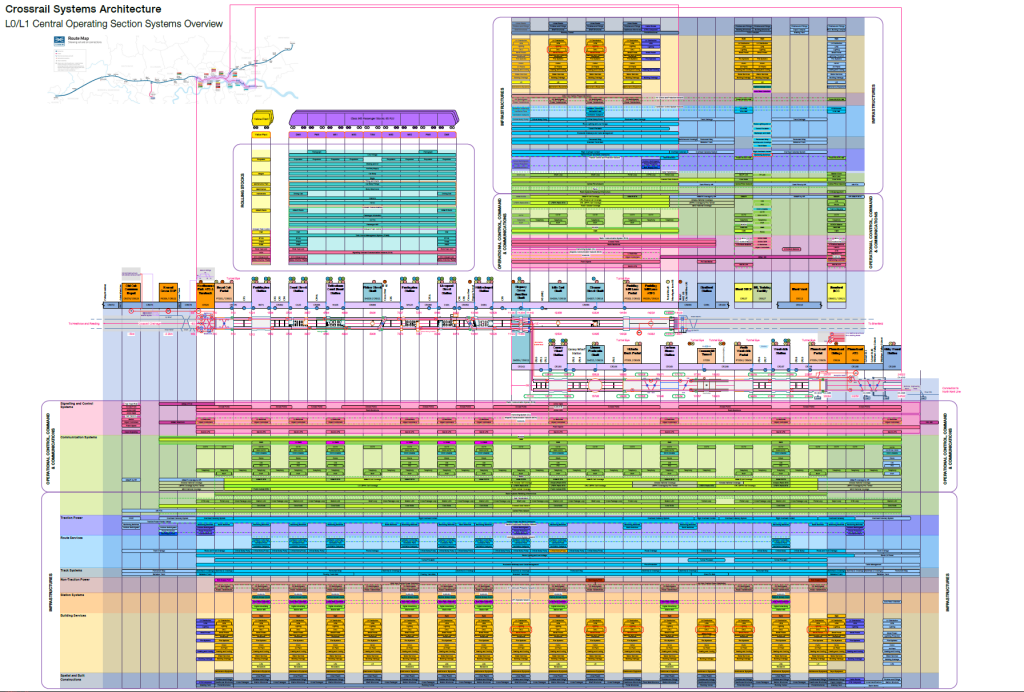
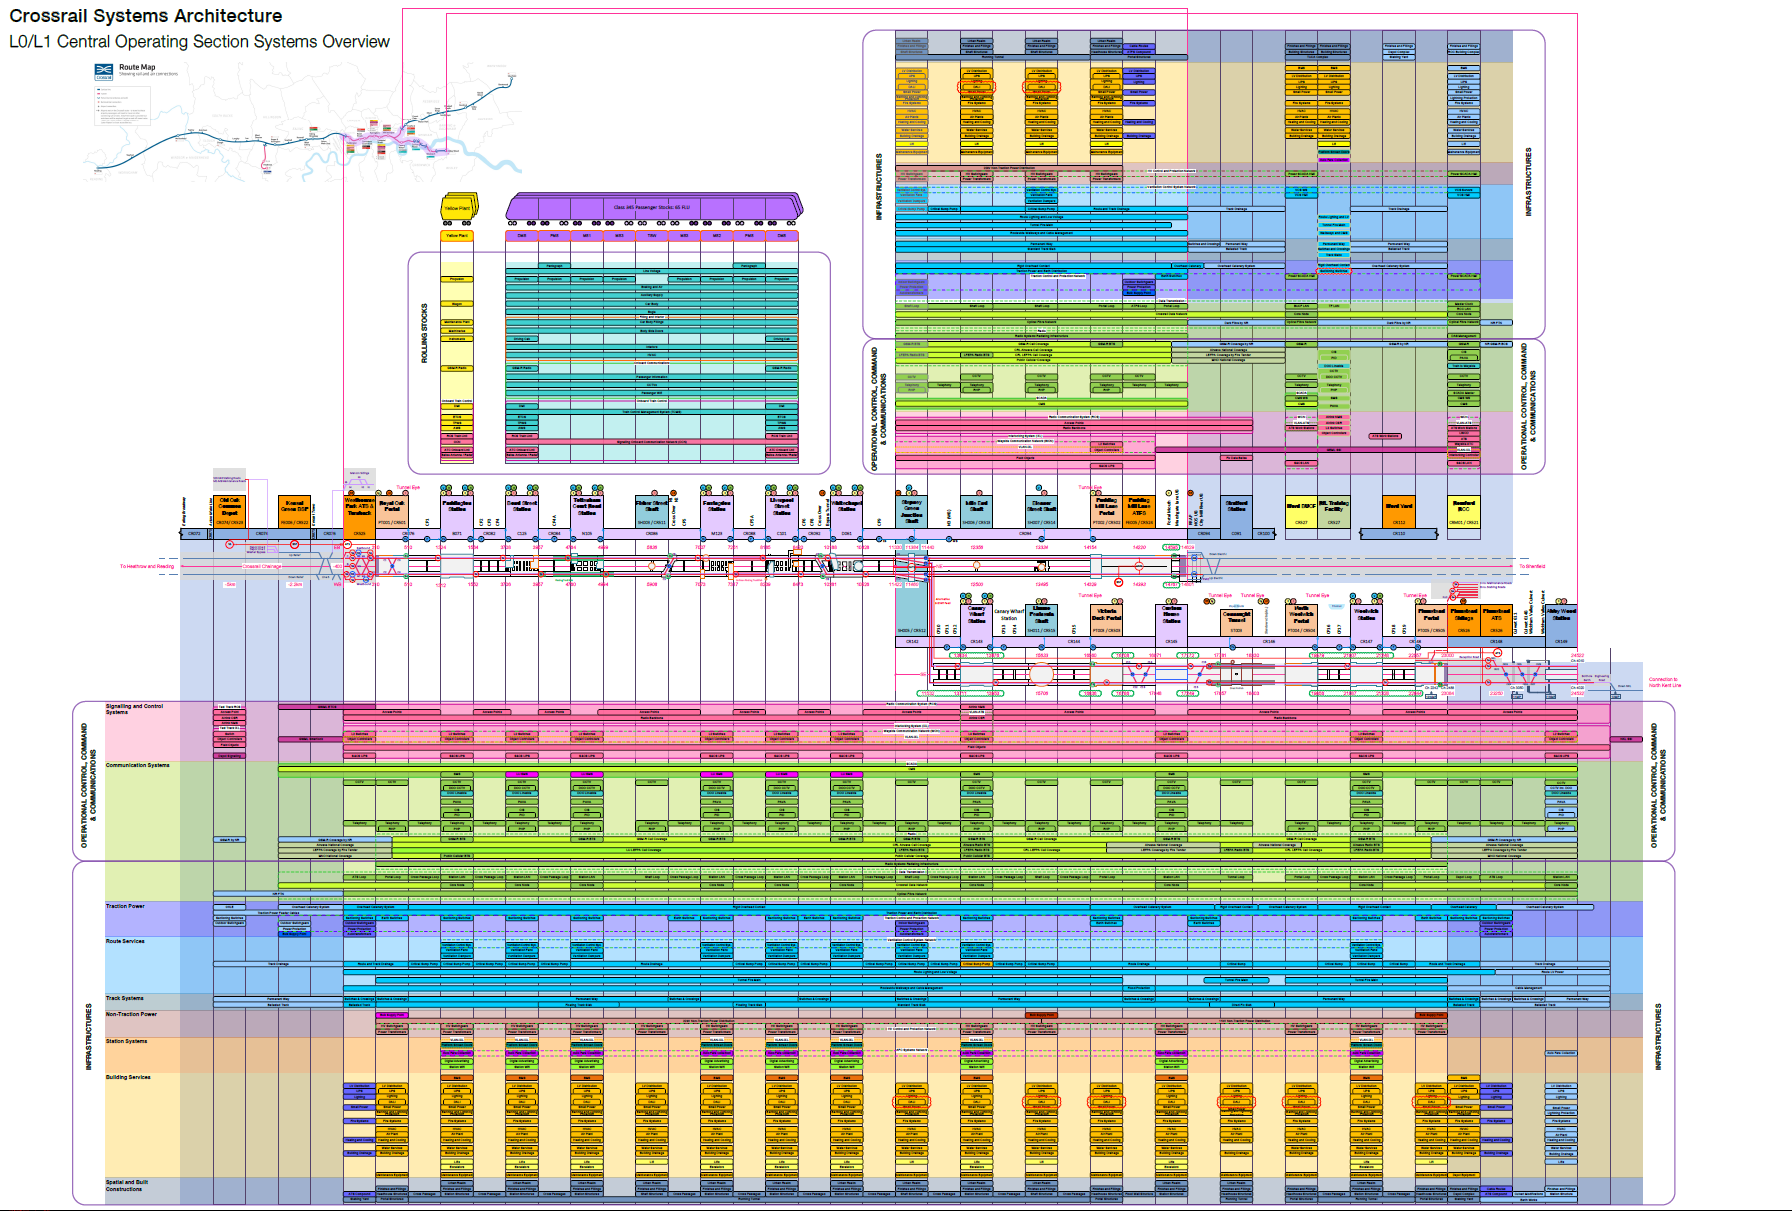
Figure 15: L0/L1 Systems Architecture Overview
The Systems Architecture Overview is developed to support the Testing and Commissioning (T&C) phase of the project to give the T&C team an overview of the railway systems to be integrated. It consists of multiple levels of models combining the geographical, systems and contractual architecture of the Central Operating Section (COS). The models and the diagrams as the architectural description product were developed in Visio. Each object contains metadata recording various attributes associated with a particular system, sub-system or element.
At the top level L0 it presents the railway assets in relation to their geographical locations. This shows the running tunnels, stations, shafts, portals and other localities as the “facilities” on the railway. Each facility is annotated with its capabilities and uses. At the heart of the L0 is the Single Line Diagram (SLD) of the railway in the COS. The SLD depicts the track layout and the track form, the traction capability and Over Head Line Equipment (OHLE) sections. These depictions are overlaid on the schematic representation of the physical layout including cross passages. L0 is not limed to the fixed assets but also includes the Rolling Stock types and their formations.

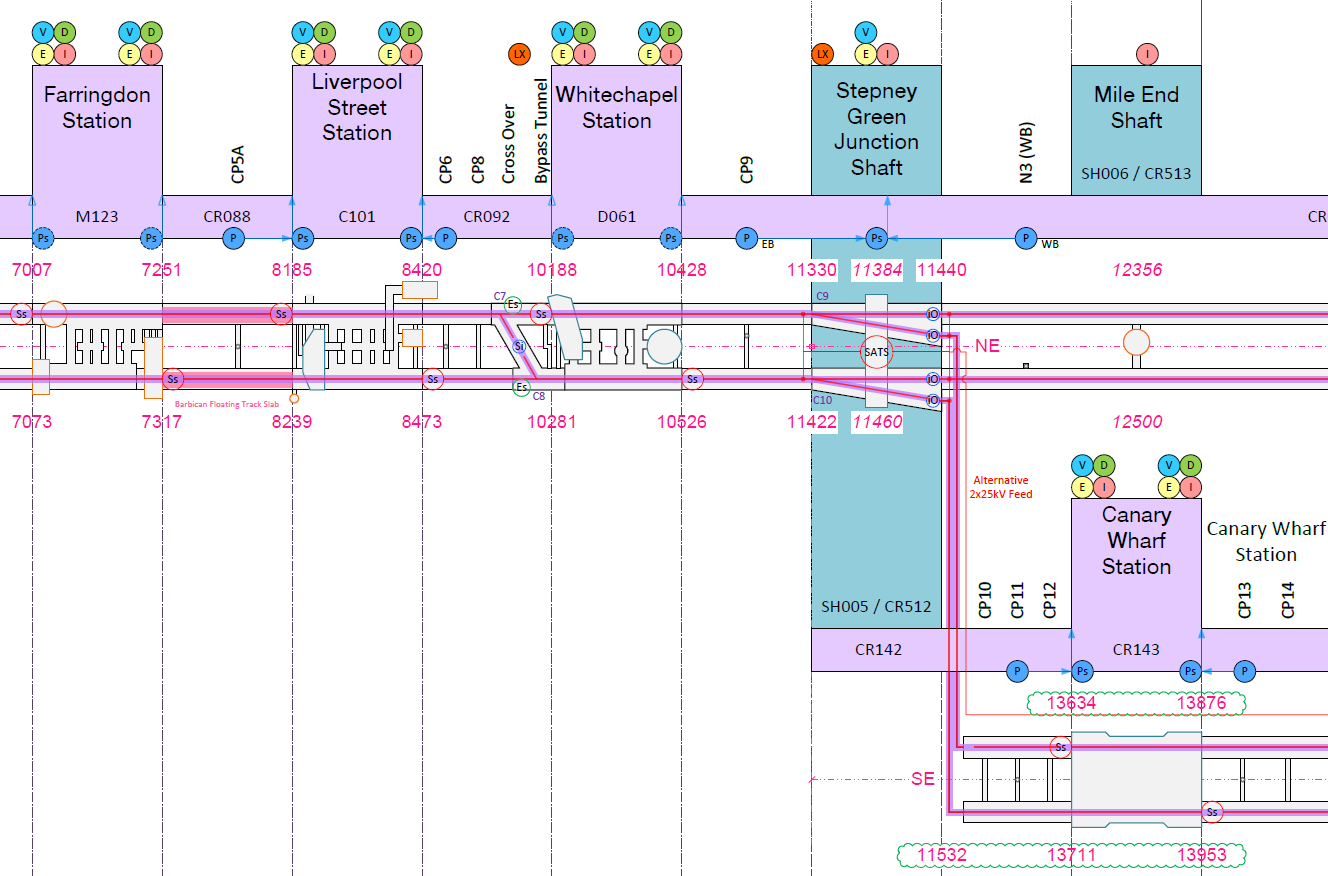
Figure 16: Enlarged L0 Systems Architecture Overview showing a section of COS
In L1 the entire railway systems are grouped into three domains namely the Infrastructure, the Rolling Stock and the Operational Control Command and Communications (OCCC). They are sub-divided into major systems, such as Building Services, Route Services, Traction and Non-Traction Power under Infrastructure and Signalling and Control and Communication systems under the OCCC. The systems are further colour coded to represent the responsible works contract to deliver the particular system in its entirety.
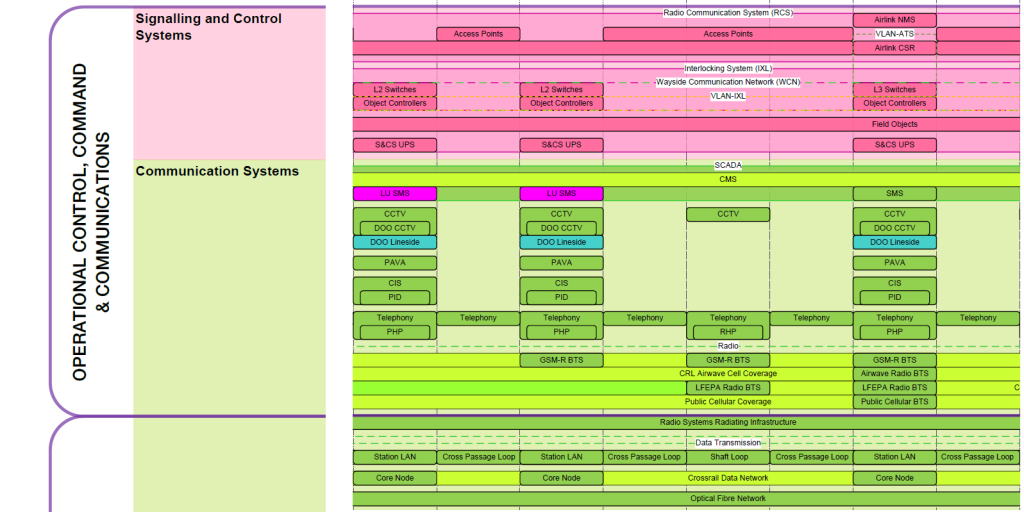
Figure 17: Snippet of L1 Systems Architecture Overview
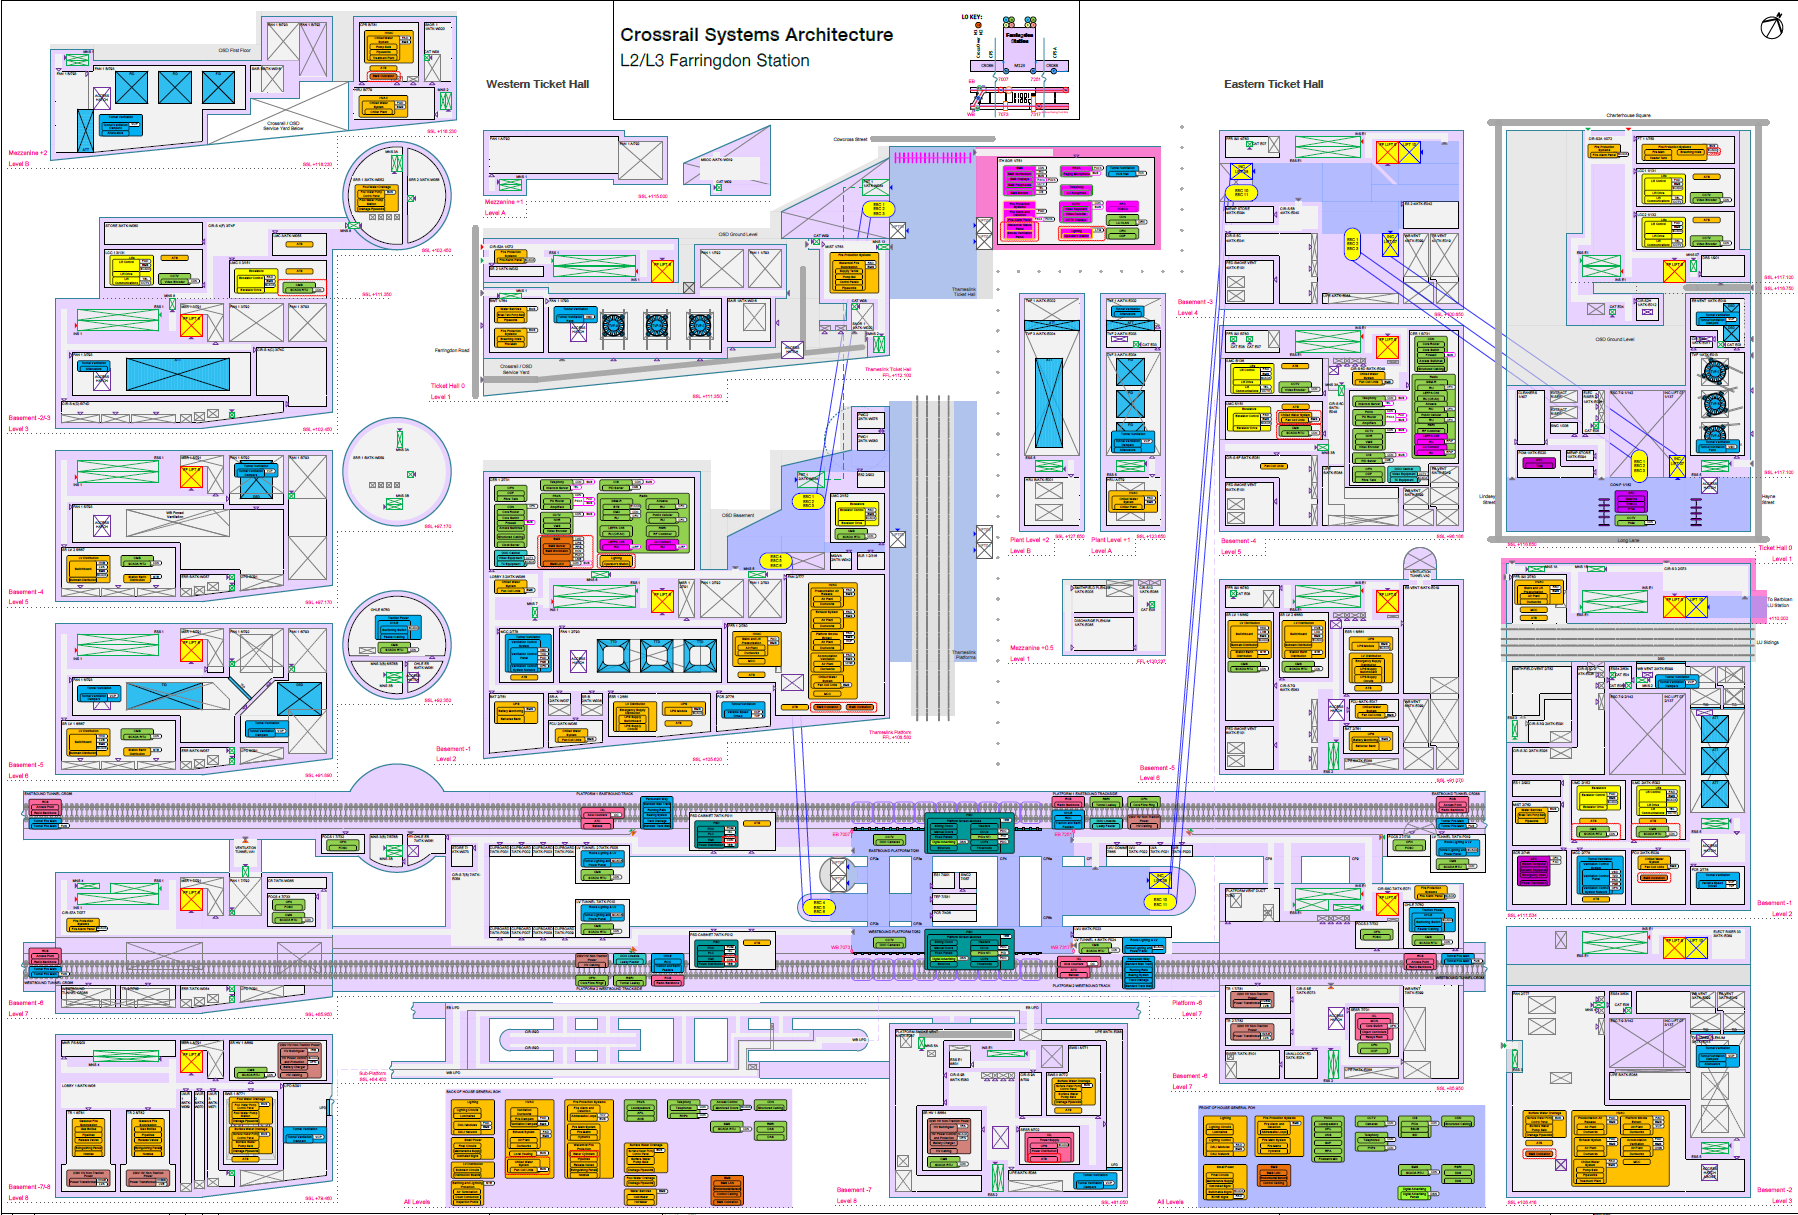
L2/L3 Systems Architecture Diagrams takes the same principles as L0/L1 but framed at each individual asset or system. Figure 18 below illustrates a diagram for Farringdon Station.
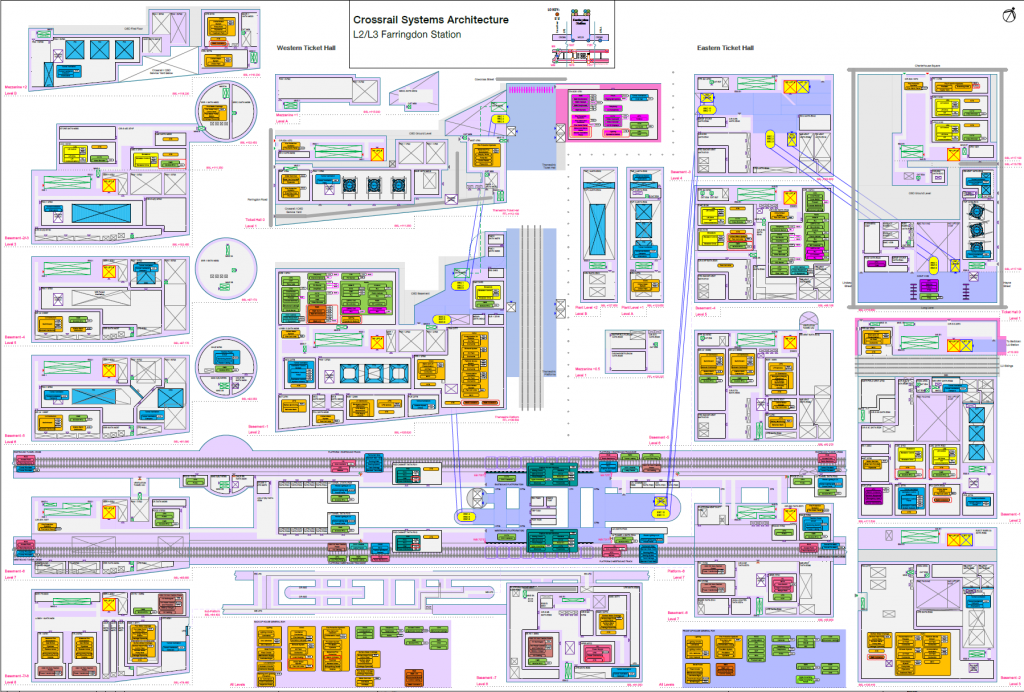
Figure 18: Farringdon Station L2/L3 Systems Architecture Overview
At L2 systems, sub-systems and elements are arranged by physical levels and room locations. The physical schematic of a locality provides a visual mapping of the objects of interest also key indications of routes for access. Objects residing in a room or space automatically inherit the room or space information in its metadata.
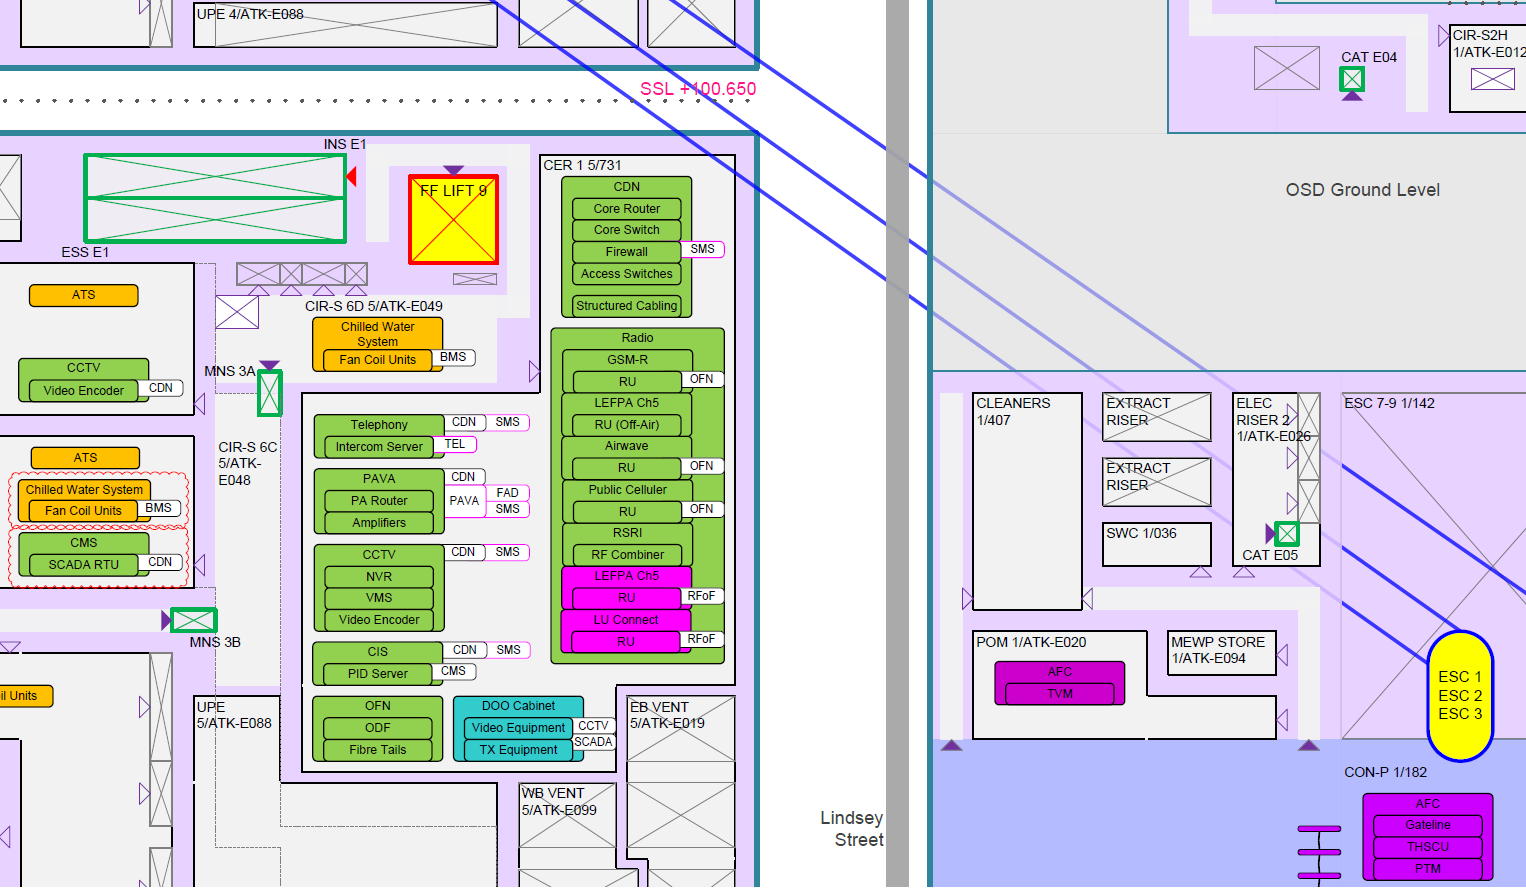
The focus of a L3 diagram is the systems and the sub-systems or elements and their interface requirements especially during T&C. The interfaces are depicted in a form of interface “tabs” attached to a system, sub-system or element. By drawing a connection from an originating system to the interface tab then to a target system, a macro is used to populate the metadata in the interface tab. The metadata in each object then allows the information to be drawn and produces reports and schedules of all objects and their interfaces that need to be addressed. A number of VBA utilities are developed to support the creation of the models.
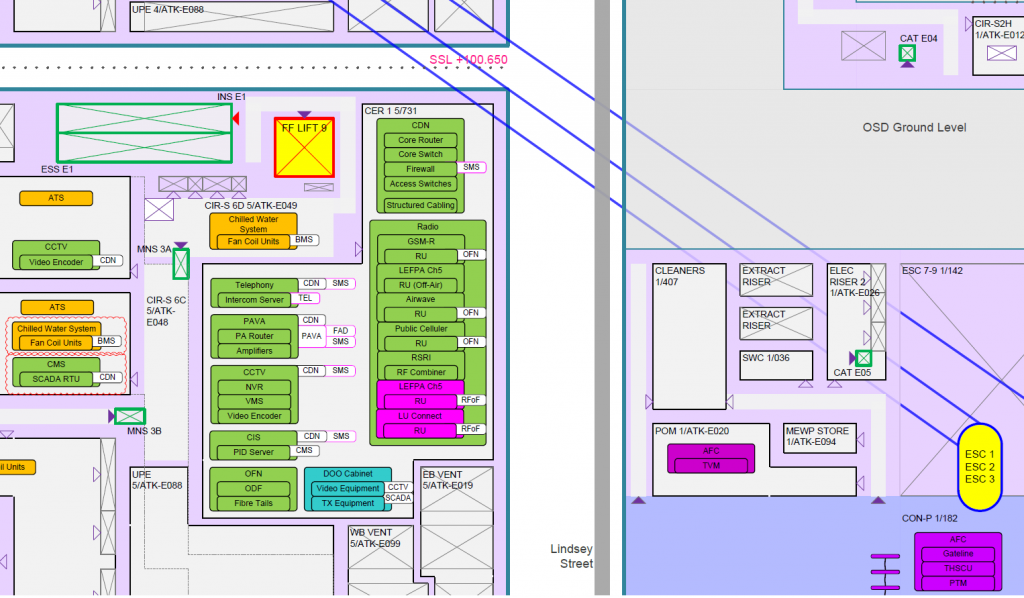
Figure 19: Snippet from Farringdon Station L2/L3 Systems Architecture Overview
3. Lessons Learned
Early Incorporation
As has been demonstrated, understanding of the developing system architecture is critical, and the use of models to depict it are a vital tool in the procedure. This needs to be recognised at the early stages of the engineering process and planned in regards to the selection of the most appropriate forms of architecture models, and ensuring sufficient experienced resources and tools are made available.
Accessibility
It is all too easy for systems architectures and models to become the domain of a few specialists. The real value in developing systems architecture models comes from the contributions provided by multiple disciplines and the communication of the work outputs. As well as ensuring early incorporation, it is essential that the models are made accessible to the project and engineering community.
Role of the System Architecture Model
The most common use of models continues to be one of illustrating and simplifying complex systems to support the development of the project. However, the role can be elevated within the process to become far more central (such as becoming the main specification of the system). This approach (model-based design) represents a paradigm shift [4] away from the more paper-based engineering approaches and must be made in light of the need for accessibility and the maturity of the project organisation.
Model Formality Selection
There is a trade-off to be made between a systems model based on formal description languages (eg SysUML) and informal drawings such as block diagrams and connection links. This relies heavily on the role of the model and the level of consistency of use across the project organisation. This decision in turn determines the software tool environment to be utilised ranging from the simple drawing tools available in text processing and spreadsheet applications, through more specific modules within drawings tools such as Visio, to specific system engineering environments.
Visual Clarity
System architecture models are an abstraction and representation of the real system. This is achieved by concentrating on a carefully selected set of attributes (such as functions, interfaces, etc.) to be denoted in the model while filtering out all other aspects of the system. However, as mentioned in this paper, the resulting architecture models can still be unwieldy and difficult to comprehend. Strategies need to be employed to aid the users to ‘see the wood for the trees’. Three such strategies employed for the Crossrail project are listed below;
- Hierarchy: Creating levelled models with a level 0 representing the top most layer. More detail can be viewed at the next level down with several model diagrams that together form Level 1. This process is repeated to the desired level of detail that needs to be represented. Mechanisms can be built in to the model diagrams to aid navigation across the various levels.
- Switchable Strata: the diagram is generated with previously selected layers giving the user the ability scrutinize the aspects of the architecture by switching on and off strata.
- Simplified Interface Identifiers: A key attribute of system architecture models is the ability to represent interfaces between components. However, for complicated systems that can result in profuse and an unwieldy set of lines and interconnections. Simplified interface indicators can be used as a substitute where a node is used to indicate an interconnection. This is best used when viewing the model on-line and building in a facility to highlight the interface meta-data when examining the model.
Imaginative Application
There are possible advantages to be gained in considering how the system architecture models are used beyond the more traditional applications of systems engineering. Some examples are listed below to illustrate this point;
- Checklist: the block diagrams and interconnections provide a ready list which can be used to check-off other work products such as specifications and test scripts to ensure completeness and consistency with the system architecture model.
- Dashboards; copies of a system architecture model drawing, perhaps in a simplified form, can be re-used with colour schemes to indicate the progressive completeness of a task such as installation or testing.
- Post Completion: the application of the developed system architecture models can extend well beyond the development phases. Operations and maintenance bodies can utilise the models for training purposes or as input for developing business and organisational strategies. The models could also form a baseline on which to plan future upgrades or changes to the operational system.
Applying Standards
As the key driver of developing a systems architecture model is to communication and coordinate project information, there is a need to employ a common language to ensure efficient dialogue. Adopting and applying an international standard such as ISO/ICE/IEEE 42010 [1] can provide a framework for such a common approach.
4. Conclusions
This paper expresses how a system architecture model describes and represents a system in its environment. Representations articulate different views for the perspective of specific system concerns. A system architecture diagram in turn is often used as a work product to communicate these views. How these principles are applied to the Crossrail development project are illustrated by descriptions of several system architecture models aligned with the lifecycle model used to structure and govern the project.
Several lessons learnt are enumerated as items for consideration to future project systems engineers and is therefore shared for use by other major projects. It is relevant mostly to ‘client’ and Project Office organisations of transport and construction sectors, however it should be of interest to other sectors as well.
References
[1] ISO/IEC/IEEE 42010, Systems and software engineering – Architecture description [2] The Influence of Architecture in Engineering Systems, The ESD Architecture Committee MIT, 2004 [3] Survey of Model-Based SE Methodologies, J Estefan, 2007 [4] A Survey of Architecture Description Languages, P Clements, 1996 [5] ISO/IEC 15288, Systems and software engineering – System Life Cycle Processes -
Authors