The Prediction of Ground Movements Adjacent to Box Excavations
Document
type: Technical Paper
Author:
James Latham MEng (Hons) MSc, Jonathan Gatter BSc (Hons), MSc (Eng), CGeol, FGS, Kevin Raven BSc (Hons), MSc, CEng, FGS, IOM3, ICE Publishing
Publication
Date: 03/11/2014
-
Read the full document
Introduction
A simple empirical based methodology has been developed by the authors to predict ground movements due to deep excavations, for the purpose of assessing whether these movements will have the potential to cause damage to existing underground utility assets.
The methodology, referred hence as the Gatter-Latham system (GLS) is a simplified approach to the assessment of ground movements and has been adapted from the published London Underground (LU) technical standard for ground movement (London Underground: Civil Engineering (2009) – Technical Advice Note G-058 A10).
Thames Water required a method of rapidly assessing the Crossrail ground movement predictions, particularly around the proposed station boxes, where it was anticipated the greatest impacts on Thames Water assets would occur. This tool was required to verify Crossrail’s methodology and for agreement of levels of damage and mitigation works required due to the impacts of tunnel and excavation induced ground movements on a representative number of the approximate 10,000 Thames Water assets potentially affected.
Existing commercially available software used on Crossrail for prediction of ground movements over tunnels did not, at the date of this phase of the damage assessment process, model ground movements around box excavations with sufficient accuracy for the purposes of calculation of damage to utility assets.
The GLS methodology creates a simple ground movement profile from a relatively small amount of input data for both the asset being assessed and the corresponding excavation. Ground movements are predicted in the vertical (z), transverse (y) and longitudinal (x) directions along a specified asset with the resulting output being used in a separate analytical process to assess the potential damage to the asset.
The paper introduces the concept of ground movements close to excavations and provides information on the currently available methodologies which have been used to predict these movements and following an appraisal of the LU G-058 methodology, the adaptations for use in damage assessment calculations are discussed.
Ground movement prediction
Ground Movements due to deep excavations
Introduction
The complexity and scale of ground movements around the deep box excavations proposed at seven of the new Crossrail stations (excluding Canary Wharf) within the tunnelled section of the scheme (See Figure 1) were likely to pose the greatest risk of damage to existing assets in close proximity to these works, particularly when combined with the tunnelling and sprayed concrete lining (SCL) works proposed as part of the station complex.

Figure 1 – Simplified plan of Crossrail underground stations and tunnel alignment
The piling and excavation works for the station boxes were planned to be one of the early activities at the station locations, hence early agreement on the impact of these works on Thames Water owned assets was essential to allow planning and implementation of protective/mitigation measures in advance of these proposed works.
Theory
Ground movements associated with excavations act in three vectors. Firstly, vertical ground movement will occur around the entire excavation. Generally, the greatest vertical settlement will be located close to the excavation itself and reduces with distance from the wall, see Figure 2a. Directly at the face of the wall, there will be other factors that affect the distribution of ground movement, such as the installation of the wall itself. The methodology developed however was to incorporate the ground movement impacts of the retaining wall installation and the subsequent excavation works.
Horizontal ground movements will also occur, and in general will act towards the excavation with the greatest movement occurring at the centre of the wall, see Figure 2b. This movement is made up of displacements in the x and y vectors.
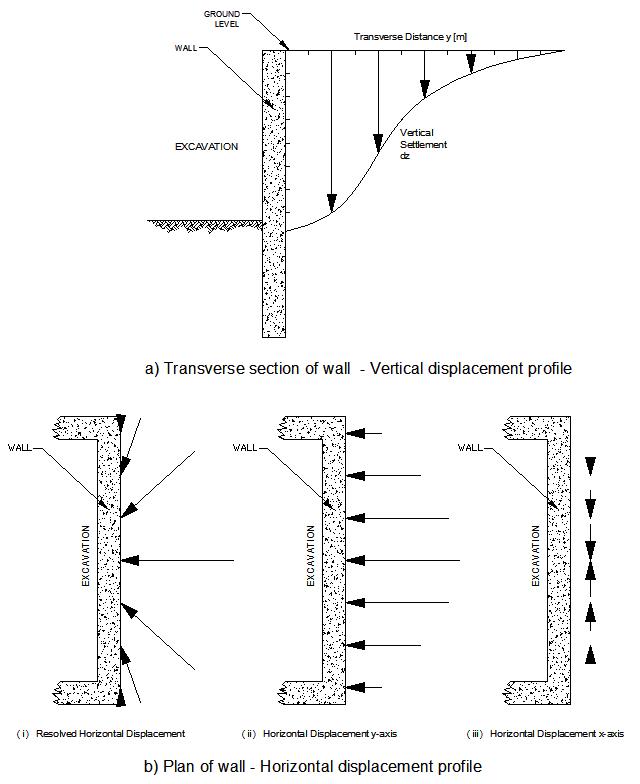
Figure 2 – Schematic section and plan indicating vertical settlement and horizontal displacement profiles.
Current methodologies
For the prediction of ground movements around box excavations, the general practice is to adopt the Ciria C580 (Gaba A.R., Simpson B., Powrie W., Beadman D.R. (2003): Embedded Retaining Walls, Guidance for Economic Design) ground behaviour model. This data is primarily based on ‘long wall’ retaining structures defined as having a length of greater than 2.5 times its depth, and the data tends to represent plane strain at the centre of the ‘long wall’ remote from the corners of the excavation.
The majority of the station boxes on Crossrail could be defined as ‘short wall’ excavations, where the length of the wall is similar to its depth. Use of the C580 data, which is based on an upper-bound envelope of data for longs walls, which tend to be less stiff than short walls, is considered to be over-conservative for the modelling of ground movements around ‘short wall’ shafts. The C580 approach also does not take into account the stiffening effects of the corners to the short walls, which significantly modifies the ground movement pattern around the shafts, although reference is made to the effects of stiff corners in the Ciria document.
The commercially available ground movement software at the date of the start of the damage assessment process for Thames Water assets used the Ciria C580 ground movement prediction model and assumed that the entire length of the wall displaces by the same degree of movement, regardless of its length. This assumption is known to be incorrect for box excavations where, as noted in the LU document, because many of the walls are relatively short compared to their depth, the total movement of the wall and deflection of the wall at the corner of the excavation will be greatly reduced in reality.
The combination of short walls in a shaft excavation creates a more rigid structure, as the wall perpendicular to the one being assessed acts as a prop and limits its deflection in the direction of the excavation. The greatest deflection will therefore be located at the centre of the wall, furthest away from the corners.
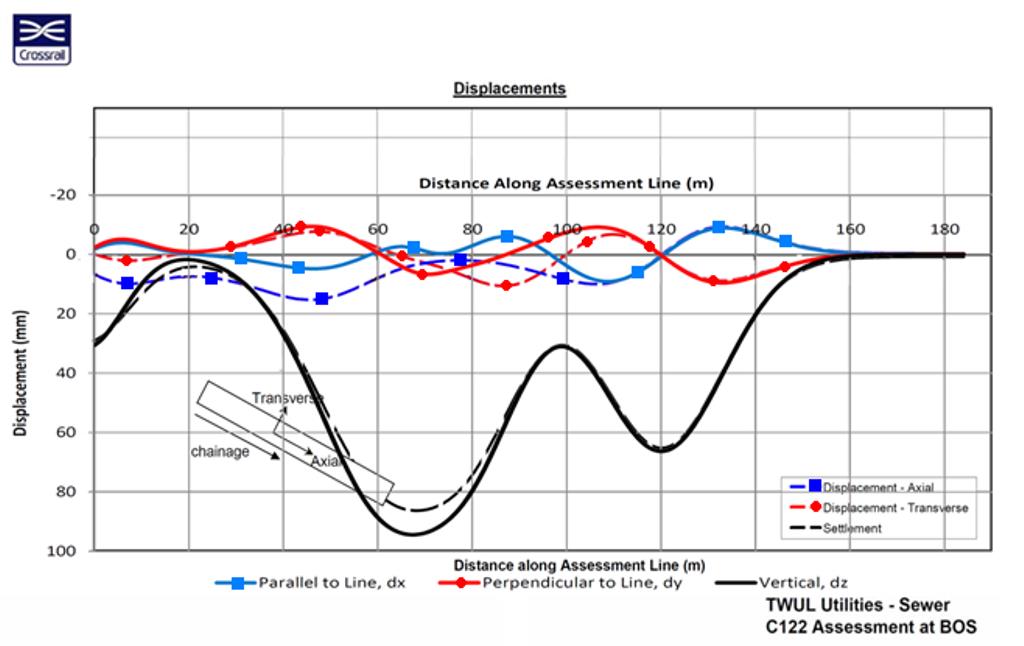
A typical plot from the commercial software showing displacements in the x (axial along the length of the asset), y (transverse towards the excavation) and z (vertical) directions are shown as dashed lines in Figure 3 and settlement contours are given in Figure 4. It can therefore be seen that along the length of the wall, between chainages -15 and +15, displacements towards the excavation are equal and therefore induce no displacement in the x direction, which is incorrect.
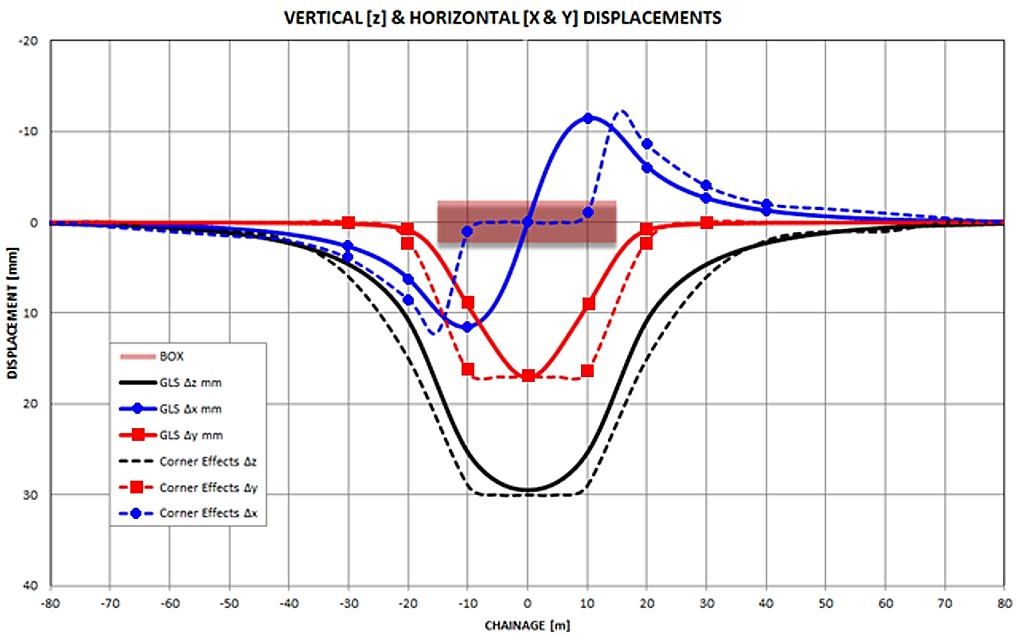
Note: Dashed lines indicate corner effects. Solid lines indicate GLS corner stiffening effects.
Figure 3 – Typical output of ground displacements along line of asset
As a consequence, high values of differential ground movement are calculated at the corners of the excavation, due to abrupt changes in displacement, resulting in artificially elevated magnitudes of strain when assessing the potential damage to assets in proximity to the ends of these excavations. The model also over-predicts total ground movements around the excavation. Hence, an alternative method of the prediction of ground movements around the short wall excavations typical of the Crossrail station geometries was required to be developed.
In comparison, a more representative profile of ground displacements taking into account corner stiffening using the GLS method is shown as solid lines in Figure 3. Maximum displacements are in the same order as the typical displacement plot, however there are no sudden changes in the deflection, as anticipated, a smoother transition is demonstrated at the limits of the excavation.
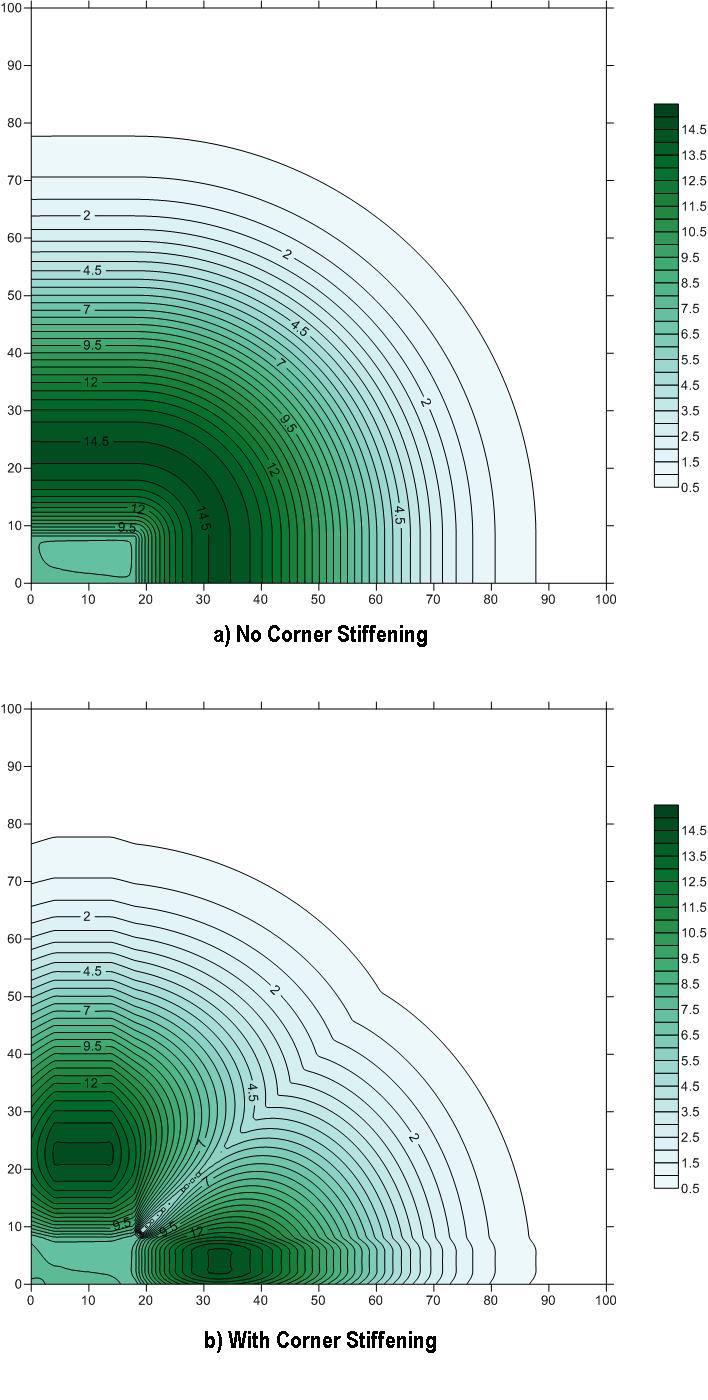
Typical contours for the standard C580 method and the proposed GLS method are given in Figure 4. Ground displacements are shown in Figure 4a and contours follow equally spaced, concentric rings around the corner of the excavation based on the C580 model.
Figure 4b indicates the proposed GLS method and shows limited displacements due to the corner stiffening effects at the corner of the excavtion.
Figure 4 – Typical contour output of ground displacements adjacent to corner of asset
Generic/parametric numerical modelling
Selected publications were reviewed in order to ascertain guidance on developing a simplistic approach for verification of the 3D FEA models including Wu et Al.(Choa-Hui Wu, Chang-Yu Ou, Ningchien Tung (2010): Corner effects in Deep Excavations, Establishment of a Forecast Model for Taipei Basin T2 Zone, Journal of Marine Science and Technology, Vol 18, No 1, pp 1 -11) and Crossrail, where a number of finite element analysis (FEA) parametric studies (Crossrail Ltd. (2009): Sub-Surface Movements from Deep Excavations 1D0101-G0G00-01025 Rev. A. and Crossrail Ltd. (2010): Movements due to Box Excavations, Phase 3/Detailed Assessment Methodology, C122-OVE-C2-RAN-CRG01-00059) were undertaken to investigate an improved approach to the modelling of ground movements around the proposed station excavations.
Crossrail developed analyses included the XR2 model, which included a wrap-around of contours similar to the current empirical methods and was considered to be an over-conservative approach.
The XR3 method, based upon the elliptical ground displacement theory, was developed and compared against a series of 3D finite element analyses which suggested a less conservative approach for the estimation of ground movements than comparable empirical methods. Review of case history data however indicated that the XR3 parametric study did not represent the displacement correctly along the long wall of the excavation.
In long excavations, ground displacements will become constant further from the corners, towards the central the part of the excavation, as it behaves predominantly as a retaining wall due to the diminishing effects of ‘stiffening’ from the corners. The XR3 method calculates displacements in an arc pattern between the corners along the length of a long wall as opposed to the spandrel displacement profile generated by field observations. A ground movement contour output from the XR3 method is included as Figure 5.
In addition, calculations of vertical and horizontal displacement using this parametric study were carried out on an irregular grid pattern which necessitates surface ‘contouring’ using specialist software to provide displacement data specific to the location of the asset for damage assessment calculations.
The limitations and practical applicability of these techniques therefore precluded them from being adopted as a simple method for modifying computer based empirical predictions for use in the damage assessment process.
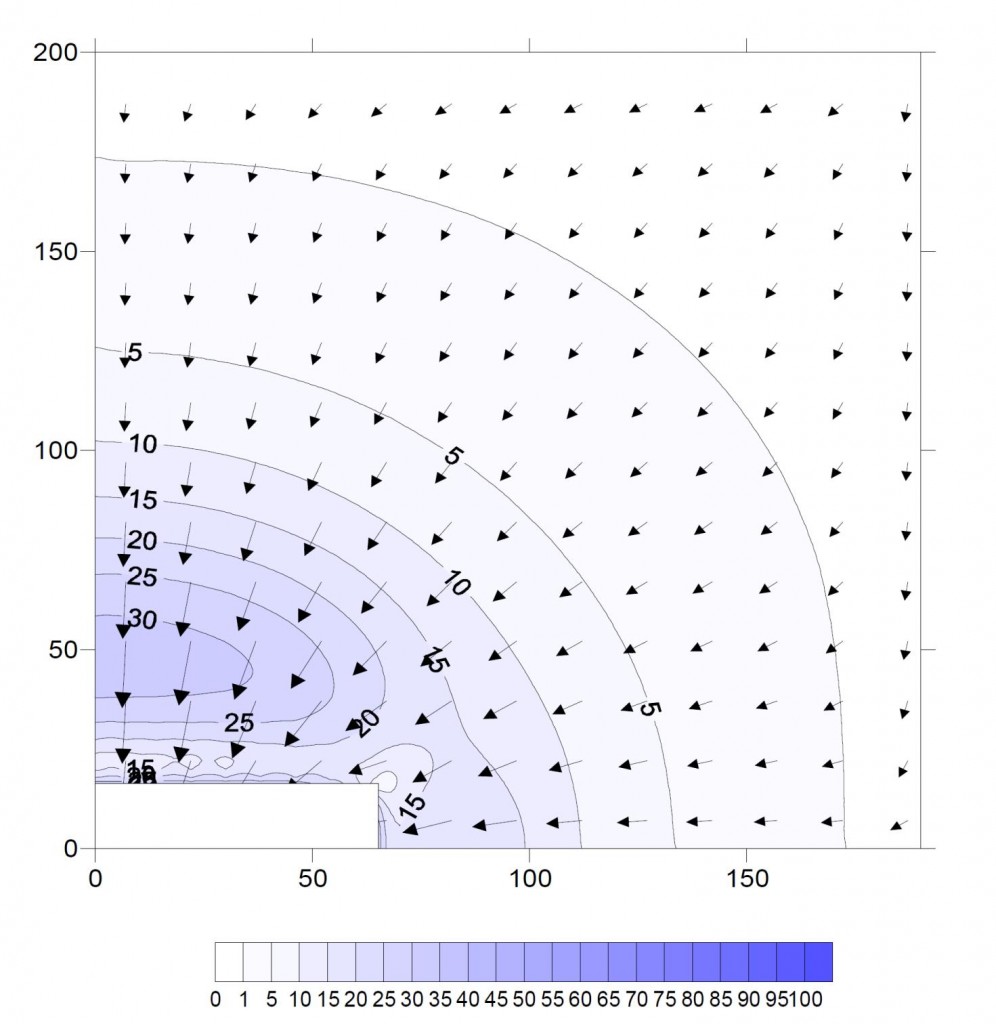
Figure 5 – Typical XR3 contour output of ground displacements
From the study of various empirical and FEA based ground movement models for box excavations, it was concluded that due the large number of variables associated with each particular station site, the use of site specific 3D FEA analysis would be adopted by Crossrail, modified to provide a ‘best estimate’ rather than a moderately conservative approach to the prediction of ground movements and associated damage to 3rd party assets around station boxes.
Thames Water approach
The use of site specific 3D FEA to model ground movements around the station excavations on Crossrail was not considered appropriate for use by Thames Water Crossrail for a number of reasons, particularly as the calculations were to be used as a verification tool only.
These were;
- Insufficient time within the damage assessment programme to generate independent 3D FEA models for each site, particularly as it was known that the stations designs were undergoing development as part of the ECI process.
- A budget to construct duplicate 3D FEA models to those developed by Crossrail could not be justified.
- A method was required that could easily be validated against previous case history or monitoring data.
- A method that would allow rapid review and agreement of the Crossrail ground movement predictions.
Following a detailed literature review of available method of ground movements around non-circular excavations, the LU Technical Note G-058 was identified for further study and analysis.
London Underground G-058 technical advice note
Following extensive experience in deep excavations in London, London Underground have developed a technical advice note which sets out a methodology for analysing various types of excavations appropriate to the ground conditions with the City , including short walled shafts, circular shafts and long wall excavations.
A simplified approach for the assessment of short walls is set out in the LU technical advice note and uses correction factor percentages to vary the estimated ground movements close to the corner of an excavation.
The methodology firstly calculates the assumed maximum vertical settlement at an offset x from the wall for each point to be assessed, using Equation 1:
Sv/H = 0.15% e^([1-(1+2x/3H)^2 ]/2)
Equation 1
A correction factor is applied to the equivalent vertical settlement which is determined based on the position of the assessment point along the wall. The relative distances from the assessment point to each corner of the wall are calculated and divided by the depth of excavation. These values, and the value of the offset from the wall divided by the depth of the excavation, are then matched on a lookup table to give the corresponding correction factors. These factors are either summed or subtracted depending on the position of the point along the wall to obtain a corrected value for settlement.
Horizontal movements are calculated in a similar way with the equivalent horizontal settlement determined using the expression:
Sh/H(%) = 0.016(x/H)+0.08
Equation 2
The corresponding correction factors are applied to the horizontal settlements in the same way as the vertical settlements to give the value of the total horizontal displacement at each assessment point. The predictions of horizontal movement assume however that they only act in a direction perpendicular to the wall being analysed.
Limitations
The standard LU methodology provides a simplified approach to the assessment of ground movements adjacent to excavations. However the level of detail required for a viable damage assessment along a linear asset such as a sewer or water main is much greater than the data provided via the look-up tables within G-058, and therefore there are a number of limitations to using the standard methodology.
Firstly, the interval between the values in the lookup table is fairly large and so when assessing points at close intervals along an asset, interpolation is required. As a result, steps are generated in the ground movement profile which gives rise to abnormal peaks in strains in the damage assessment, which are unrealistic, and the process is very time consuming.
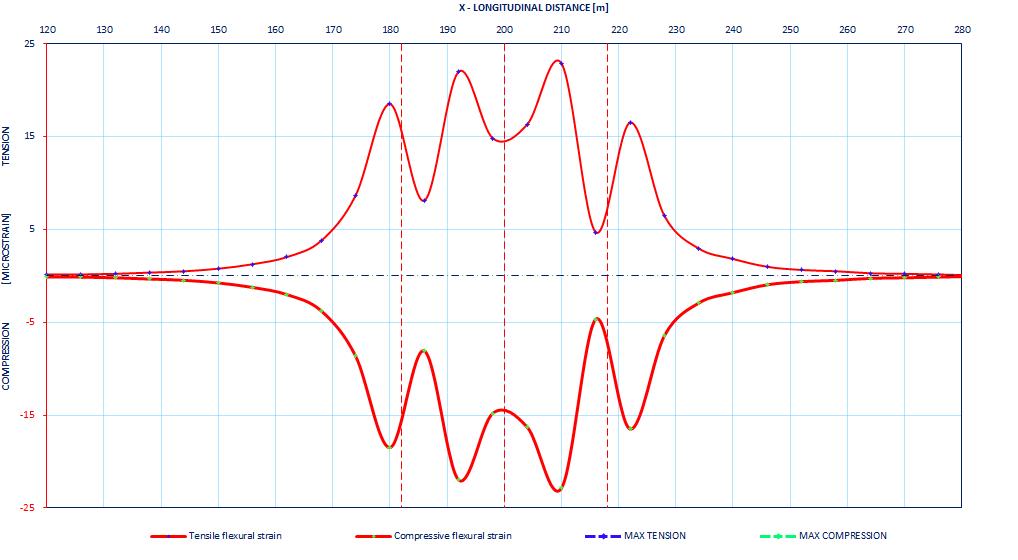
Figure 6 – Example of GLS strain analysis using original lookup table
Secondly, the LU methodology is predominantly set out to solely consider vertical ground movements due to excavations. Horizontal ground movements have only been briefly considered in the LU technical advice note and can only be calculated using this method perpendicular to the line of the excavation. For the purpose of a detailed damage assessment, horizontal ground movements in both the x and y vectors as defined by Figure 2, but related to the orientation of the asset under analysis, need to be calculated in addition to the vertical settlement, for multiple points set at relatively small intervals along the asset
Adaptations to LU G-058 methodology
In order to assess the ground movements along Thames Water assets at specified intervals, calculations as described above need to be undertaken and corrected for their position relative to the excavation wall using predefined values from the lookup table as set out in G-058. The damage assessment analysis, based on the ground movement predictions, require ground movement data at between 0.5 m to 2.0 m intervals along the line of the asset.
However, the original lookup table, provided within the LU G-058 report, is too coarse and was not developed for the detail of analysis required, and therefore had to be enhanced to a much finer grid of values in order to provide correction factors at the required intervals.
A three dimensional grid surface was generated from the original correction factor table data using a Kriging contouring process, which allowed the interpolation of values to a much finer grid of values. This grid was then developed as a refined lookup table in a spread sheet calculation by enabling a significantly finer selection of correction factors to be determined for specific input values using an advanced lookup table. Further high level smoothing algorithms were then developed in the spread sheet, to provide seamless interpolated correction factors for any required calculation interval, thus ensuring that differential movements between each assessment point follow a continuous curve to represent a realistic ground movement profile.
A manual check and validation process was undertaken to confirm that this refined process did not impact on the magnitude and distribution of ground movements as predicted by the G-058.
Review of horizontal movements
As the damage assessment analysis based on the ground movement predictions requires ground movements in the x, y and z vectors related to the orientation of the asset, and based on an understanding that the current LU methodology provides only vertical settlement and total horizontal displacement perpendicular to the excavation walls, it was necessary to provide a solution to separate the total horizontal displacement into its corresponding x and y component vectors. To overcome this limitation, a process was developed which included the following steps:
Step 1: Firstly, as previously described, the formula for the trend line in Figure 3 of the LU technical advice note can be used to calculate the total equivalent long wall horizontal ground movement at a particular assessment point. The same correction factors can also be applied to the horizontal movements that were applied to the vertical movements, creating a similar profile.
For each assessment point, the offset from the centre of the wall to the location of a point with an equal horizontal displacement can be established.
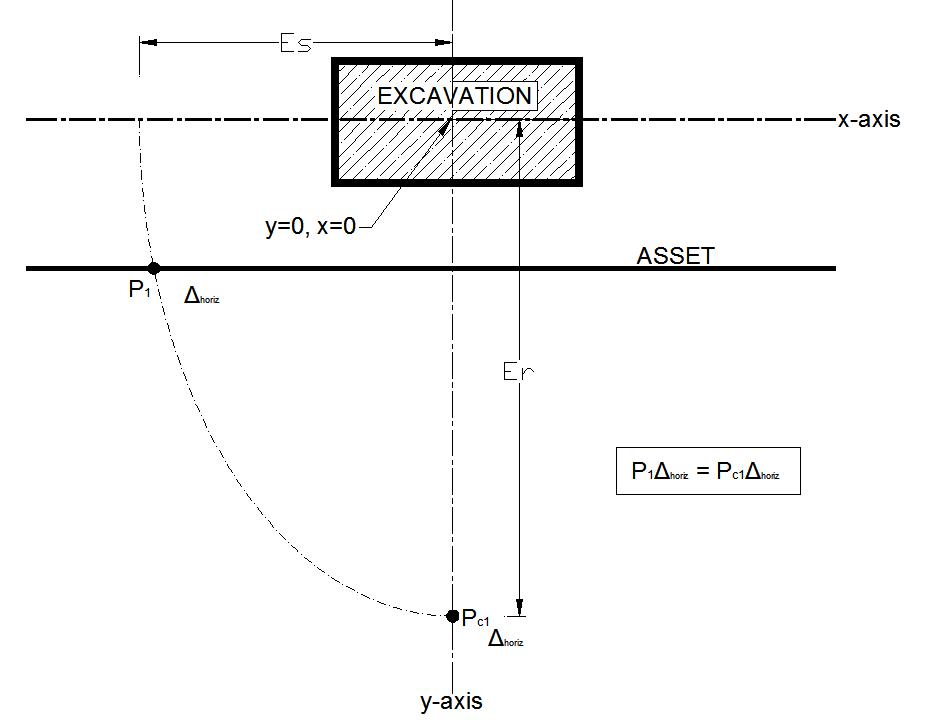
Figure 7 – Model of assessment points of equal horizontal displacement and elliptical contour
Step 2: It can be assumed, based on the study of case history data and parametric studies undertaken, that the points of equal horizontal ground movement around an excavation are elliptical in distribution. If the central coordinates of the ellipse are at 0,0 the calculation of the major and minor radii for this ellipse is straightforward.
x2/Es2 + y2/Er2 =1
Equation 3
Horizontal displacement will act in a direction normal to the curve of the ellipse, and the direction or gradient of this normal can be calculated to give the angle at which the displacement acts. The total horizontal ground movement can therefore then be resolved into the x and y axes.
The resultant gradient is given by:
dx/dy = (Er2×x)/(Es2×y)
Equation 4 and
R=Δy/cosθ
Equation 5
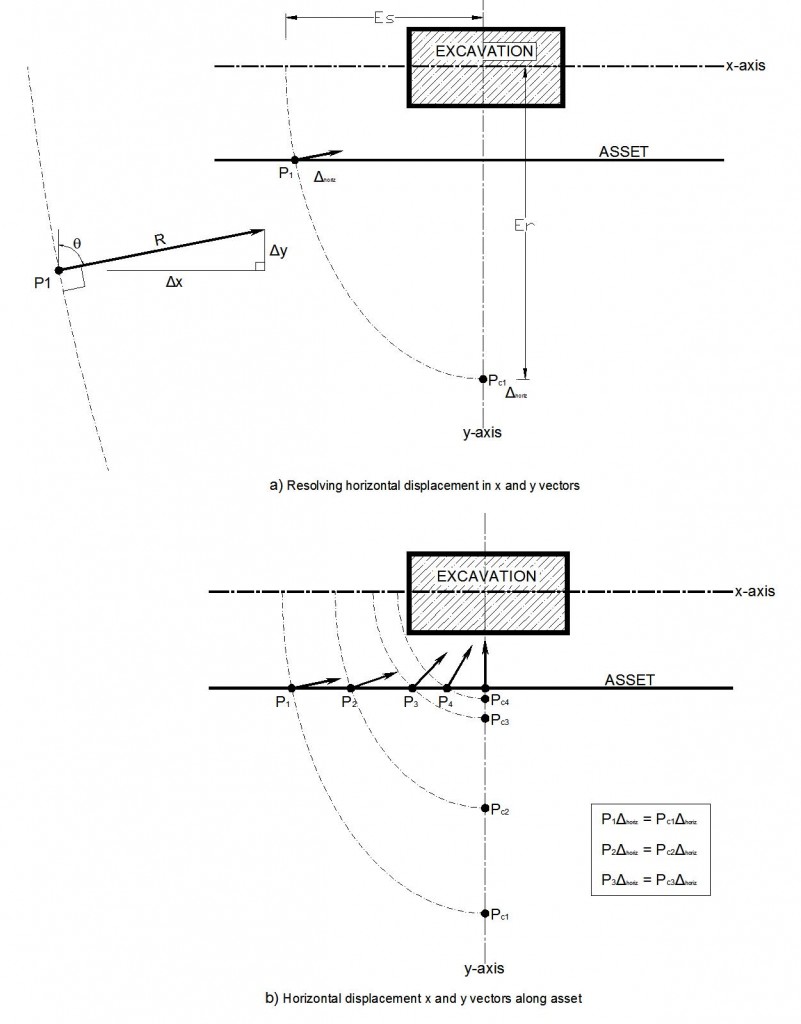
Figure 8 – Resolving horizontal displacement in x and y vectors
Step 3: The previous stage is repeated for all locations along the asset. It should be noted that the angle of incidence ? of the horizontal ground movements towards the excavation varies according to the position along the asset as would be expected.
Using the GLS
The GLS calculation has been set out so that the ground movements are assessed at set points along the length of an asset impacted by a box excavation. The interval of these points is determined by simple divisions of an individual pipe length within the asset or an arbitrary value of between 0.5 m and 2 m for continuous structures such as a brick sewer. For each assessment point along the asset, a number of calculation steps are carried out to determine the vertical (z), transverse (y) and longitudinal (x) ground movements.
Coordinate system and symbols
Details of both the asset and the dimensions of the excavation adjacent to the asset are required for the assessment. The Thames Water GIS database provided the plan location of the asset and information on the proposed excavation works was extracted from the current scheme drawings. A CAD system was used to locate the coordinates of the asset and the walls of the excavation.
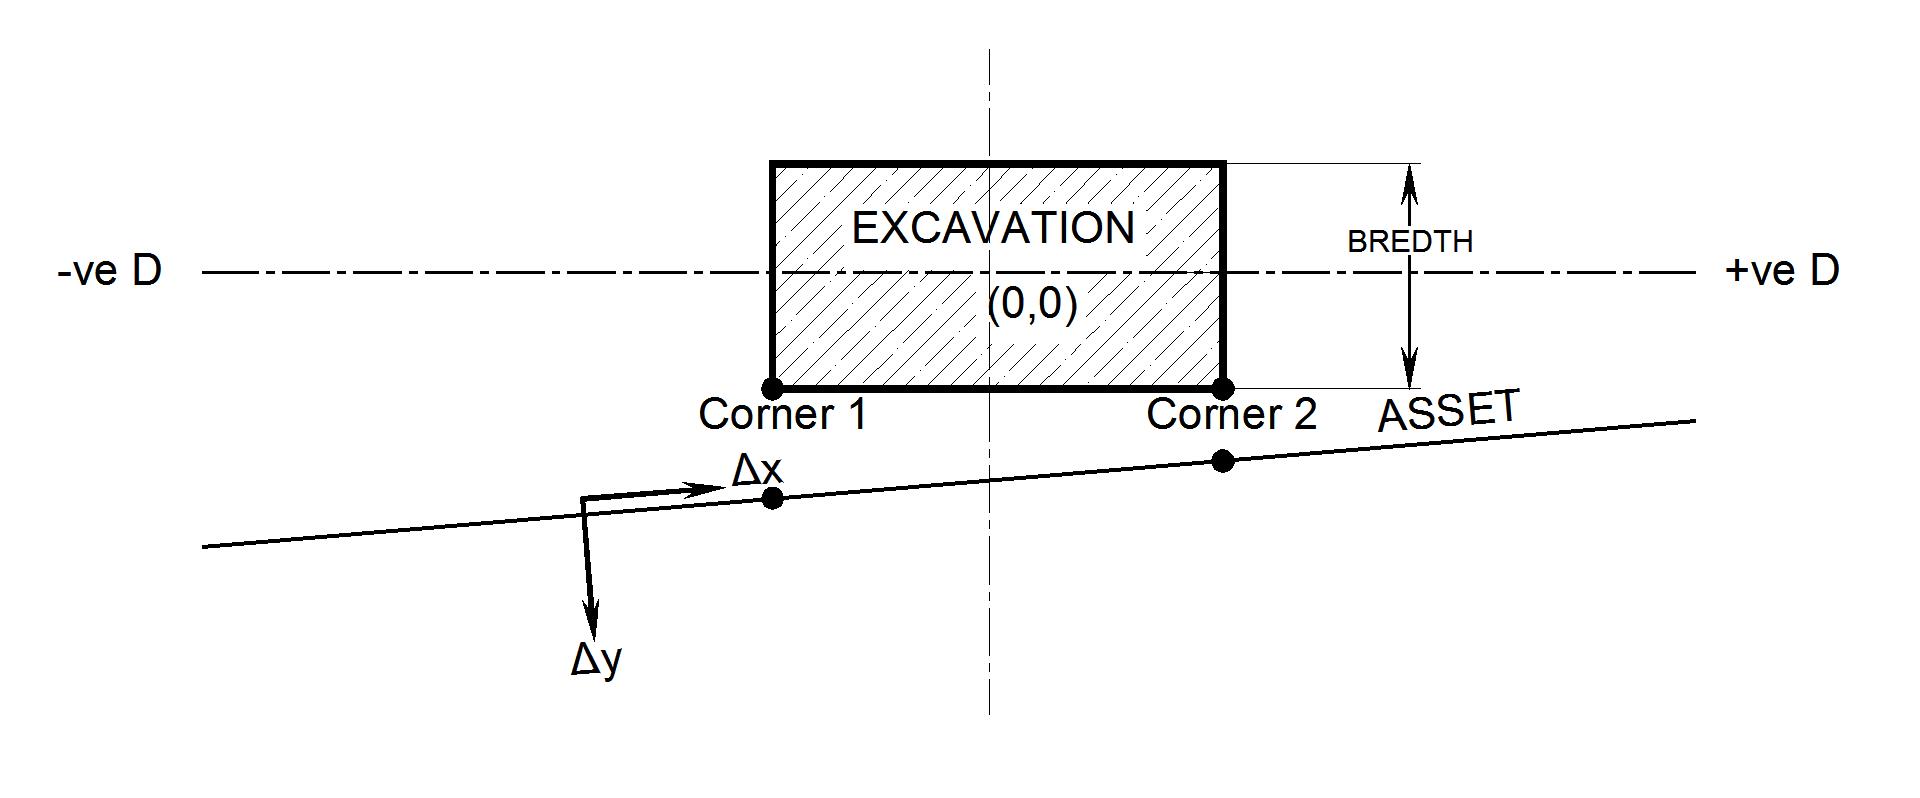
A coordinate system was set up so that a simplified analysis can be carried out for any asset. Looking towards the excavation, corners 1 and 2 of the wall are located on the left hand and right hand side respectively. The central axis centre is located at the centre of the assumed excavation (i.e. at the centre of the wall/box excavation in the x direction and half of the assumed breadth of the excavation behind the wall in the y direction).
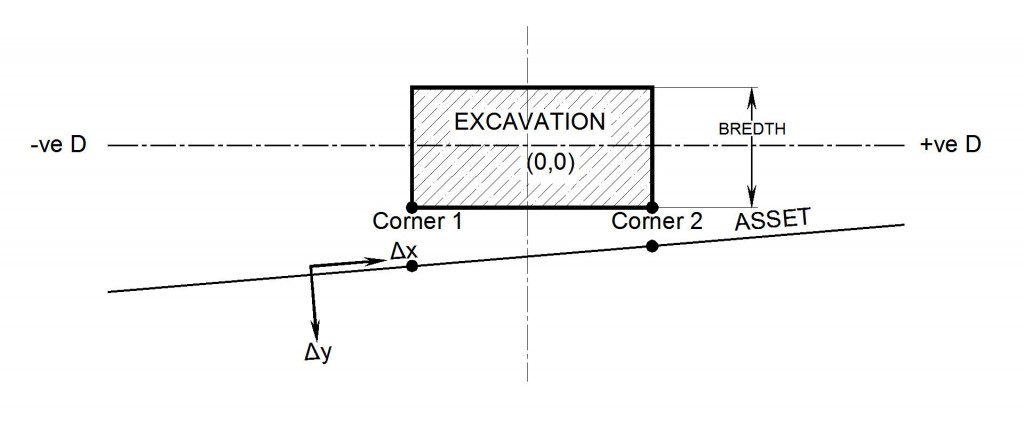
Figure 9 – Diagrammatic representation of coordinate system
The coordinate system is used for the purpose of simplifying the location of the assessment points and for calculation purposes. Values for the location of the wall and the asset were entered using the local grid system.
The only additional data required to be entered is;
- Breadth of the excavation (distance between the wall and the other face of the excavation)
- Elevation at the base of the excavation and at ground level
The coordinates of the asset and excavation works input into the programme allows automatic calculation of the relative distances of the asset to the wall, width and depth of the excavation, and the predictions of ground movement based on the methodology as set out in LU G-058, with the refinements as set out in this paper, to allow a fine grid of assessment points to be used and the calculation of horizontal movements in the x and y direction along the asset being assessed.
The GLS programme generates a plot of ground movements in the x, y and z directions along the length of the asset being assessed as shown in Figure 3. The digital data the GLS uses to generate the ground movement profile in a graphical format was also designed to be directly input into a separate software package to undertake damage assessment calculations, and to be combined with other ground movement data produced for adjacent tunnels and SCL works to provide a composite ground movement model by superposition for the whole station complex.
By the principal of superposition, complex station geometries other than square shaped excavations can be modelled using GLS, in addition the assessment of stages of construction can be analysed for multiple excavations.
Validation and comparison with Crossrail FEA data
Extensive validation using the manual calculations from the G-058 technical advice note was undertaken and independent calculation of horizontal movements using the elliptical pattern of ground movements around box excavations were performed before use of the software on Crossrail.
The first station where the Crossrail FEA ground movement models were compared for validation purposes against the GLS was Bond Street Station, where calculations additional to normal verification testing was undertaken to test the software.
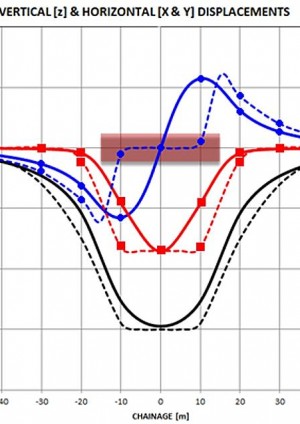
As Figure 10 demonstrates, there is an extremely close agreement between the 3D FEA and the empirical GLS software, in terms of ground movement predictions, which resulted in the calculation of very similar levels and location of damage to the Thames Water assets based on the respective ground movement prediction methods. This close agreement was replicated across all the stations subsequently analysed. For most validation checks performed, the 3D FEA and the GLS output was within +/- 10% of the calculated tensile strain/joint rotation/joint pull-out values calculated, a variation which was acceptable to all parties involved in the damage assessment process.

Note: Solid lines – GLS, dashed lines – FEA
Figure 10 – Comparison of 3D FEA and GLS generated ground movement profile along a TW sewer assetConclusions
Refinement of the LU G-058 technical advice note by developing a spread sheet based analysis of the methodology, and further development of the analytical process to allow validation of Crossrail generated ground movements and damage assessments to be undertaken for utility assets, met all the objectives of the brief specified by Thames Water. It provided;
- An empirical method based on case history data to validate the sophisticated 3D FEA model developed by Crossrail as part of their damage assessment and asset protection process for all 3rd party assets
- A highly efficient method of undertaking validation checks on the Crossrail calculations, with multiple analyses being capable of being run within a single working day
- The grid referencing system and output data was compatible with the scheme wide ground movement prediction model produced using commercially available software for the tunnel and SCL works, allowing composite ground movements models to be easily generated for each asset assessed using GLS for input into the damage assessment calculations
- The simple input data and automatically generated ground movement plots allowed the software to be used with minimal training, which provided flexibility of resources within the Thames Water geotechnical team working with Crossrail on the damage assessment and asset protection process
- Supported an efficient process for validation of the predicted levels of damage to Thames Water assets as a result of the highly complex ground movements around the station complexes and agreement of the levels of mitigation/protection required
The one limitation of the GLS software is that the ground movement predictions are limited to those at the ground surface, which needs to be taken into account when analysing deep sewer assets. Because of the significant depth of the majority of the Crossrail station boxes, there was minimal difference in predictions between the Crossrail 3D FEA output which modelled sewers at the correct depths, and GLS, for sewers down to depths of the order of 5 m to 7 m depth. For deeper sewers, because the patterns of movement were similar, although there were some slight variations in the scale of movements, engineering judgement could be used to agree the results of the damage assessment output and required level of mitigation.
Acknowledgements
The Authors would like to acknowledge the contribution and support received from Steve Wilkinson of Thames Water, John Lamont of CH2MHILL, Chris Drew of CH2MHILL, Victoria Crewe of Hyder Consulting (UK) Limited and Dr Barry New of GCG. We would also like to thank Keith Bowers of London Underground for permission to publish this article for the 2013 Crossrail Paper Competition.
References
London Underground: Civil Engineering (2009) – Technical Advice Note G-058 A10.
Gaba A.R., Simpson B., Powrie W., Beadman D.R. (2003): CIRIA C580 – Embedded Retaining Walls, Guidance for Economic Design.
Crossrail Ltd. (2009): Sub-Surface Movements from Deep Excavations 1D0101-G0G00-01025 Rev. A.
Choa-Hui Wu, Chang-Yu Ou, Ningchien Tung (2010): Corner effects in Deep Excavations, Establishment of a Forecast Model for Taipei Basin T2 Zone, Journal of Marine Science and Technology, Vol 18, No 1, pp 1 -11.
Crossrail Ltd. (2010): Movements due to Box Excavations, Phase 3/Detailed Assessment Methodology, C122-OVE-C2-RAN-CRG01-00059.List of notations
a Relative distance from corner
b Relative distance from corner
C1 Corner 1
C2 Corner 2
CFa Correction Factor for distance a
CFb Correction Factor for distance b
CF Total Correction Factor
D Distance along asset
R Resultant horizontal ground movement
Δhoriz Factored horizontal ground movement
Δx Longitudinal ground movement
Δy Transverse ground movement
Δz Vertical ground movement
Hb Elevation at base of excavation
Hg Elevation at Ground Level
H Depth of Wall
Sh Assumed “long wall” horizontal displacement
Sv Assumed “long wall” vertical displacement
WL Width of Wall
x0 Offset from wall to asset -
Authors