Volume Loss and Long Term Settlement at Kempton Court, Whitechapel
Document
type: Technical Paper
Author:
Nigel Hill, Dr Alfred Stärk Dipl Ing Dr Ing, ICE Publishing
Publication
Date: 07/09/2015
-
Read the full document
Notation
Ch chainage
DCSMAX direct calculation maximum settlement
EBRT-W EL Eastbound Running Tunnel – West Enlargement
EBRT-W PT Eastbound Running Tunnel – West Pilot Tunnel
i, iy trough width, offset of inflection point from the trough centre
K trough width parameter
Minimum SAE minimum sum of absolute errors
PTW-W EL Platform Tunnel Westbound – West Enlargement
PTW-W PT Platform Tunnel Westbound – West Pilot Tunnel
S measured settlement
Sj measured settlement at point j
Smax maximum settlement at centre of trough
Vs volume loss percentage
z depth of tunnel axis below ground levelIntroduction
Kempton Court is located in the zone of influence of Whitechapel Station tunnels, Figure 1. Whitechapel station comprises two deep excavations extending from ground level down to the platform tunnel level, one at Durward Street (DSS) and one at Cambridge Heath Road (CHS). The station at depth includes two main station platform tunnels at 24m below ground level (bgl) each about 11m in diameter. Various connecting cross passages, escalator tunnels and emergency escape routes are constructed between the platform tunnels and connect with the deep excavations.
All station tunnels were excavated using the LaserShellTM method with sprayed concrete as primary and permanent support. LaserShellTM has been developed for Heathrow’s Terminal 5 tunnelling works. Details of the LaserShellTM can be found in Eddie and Neumann (2003 and 2004) and Chapman et al. (2010) [9, 10].
Kempton Court consists of two four storey residential buildings built in the mid-1990s. These buildings are located immediately above the eastbound and westbound platform tunnels, cross passage CP1a, Escape passage EPW1, escalator barrel ES1. Whilst Building A extends across all of these tunnels, Building B is located above and almost in line with the westbound platform tunnel. The ground floor comprises 150mm pre-cast units typically spanning 6m onto 500 x 600mm deep reinforced concrete beams that are founded on 350mm diameter 11.1m to 19.9m long Continuous Flight Auger (CFA) piles. The first and second floors typically consist of timber floors spanning onto a combination of load-bearing block work and load bearing timber walls. The first floor along Brady Street also comprises 150mm thick units spanning 6m onto steel beams and load bearing masonry walls. The external walls are cavity construction with brick outer leaves and a thick lightweight block inner leaf [4].
Extensive monitoring of Kempton Court has been on-going since November 2012 and was on-going at issue of this report. Monitoring instruments include automated prims installed high on the building facades, manually read levelling bolts along the base of the facades and manual levelling studs installed on the ground surface pavement areas near to the building. This report will only include analysis of the ground settlements directly measured by the road studs induced by the westbound platform pilot and enlargement tunnel drives, Figure 2. Longitudinal settlement analysis will be undertaken on Section 1 above the tunnel axis between Chainage 24m to 149m and the transverse settlement trough will be analysed at Section 2, located at Ch 41m. Due to section 2 being subject to influence form the adjacent PTE W tunnel, a third section influenced by a single tunnel at Vallance Road will also be anslysed. The Valance Road section is discussed later in the report.
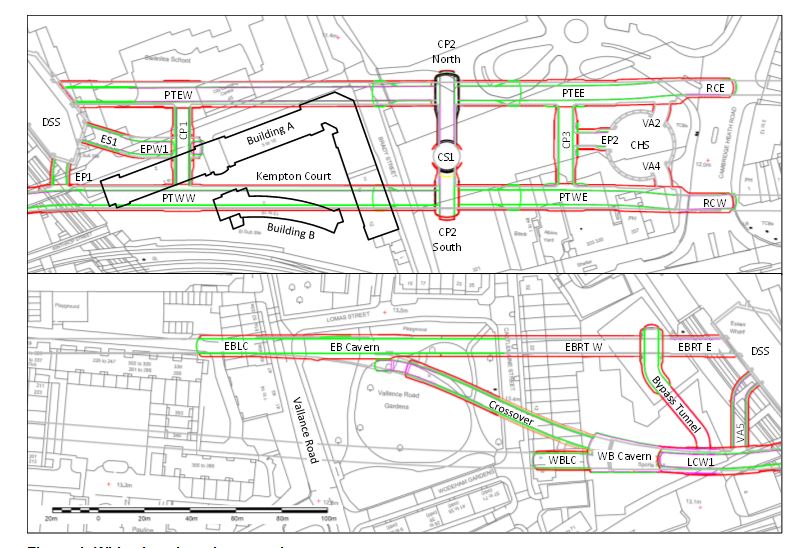
Figure 1 – Whitechapel station tunnels
The C510 contractual limit for volume loss (Vs) for tunnels between CP2 and the Durward Street Shaft under Kempton Court is 1.25%. The trough width parameter (K-value) of 0.5 for London Clay is used to predict the short term settlement behaviour directly induced by tunnel excavation. The short term settlement trough for a face loss of 1.25% from the PTW-W tunnel at 24.3m bgl is predicted to have a trough width of 12.15m, with a maximum settlement (Smax) of 13.4mm for the pilot heading, or Smax of 25.3mm for the enlargement.
To differentiate between settlements directly attributed to tunnel excavation and the long term settlements that occur after excavation: Settlements directly related to the tunnel face passing beneath the transverse array is referred to in this report as the short term settlement trough.
All Platform Tunnels have been excavated in two stages. First: Excavation of a ~6.5m diameter Pilot Tunnel; full face excavation with advance length of 1m. The pilot Tunnel was followed by the excavation of the ~11m diameter Enlargement comprising two 1m top heading advances and 2m-invert for each 2m full ring closure.
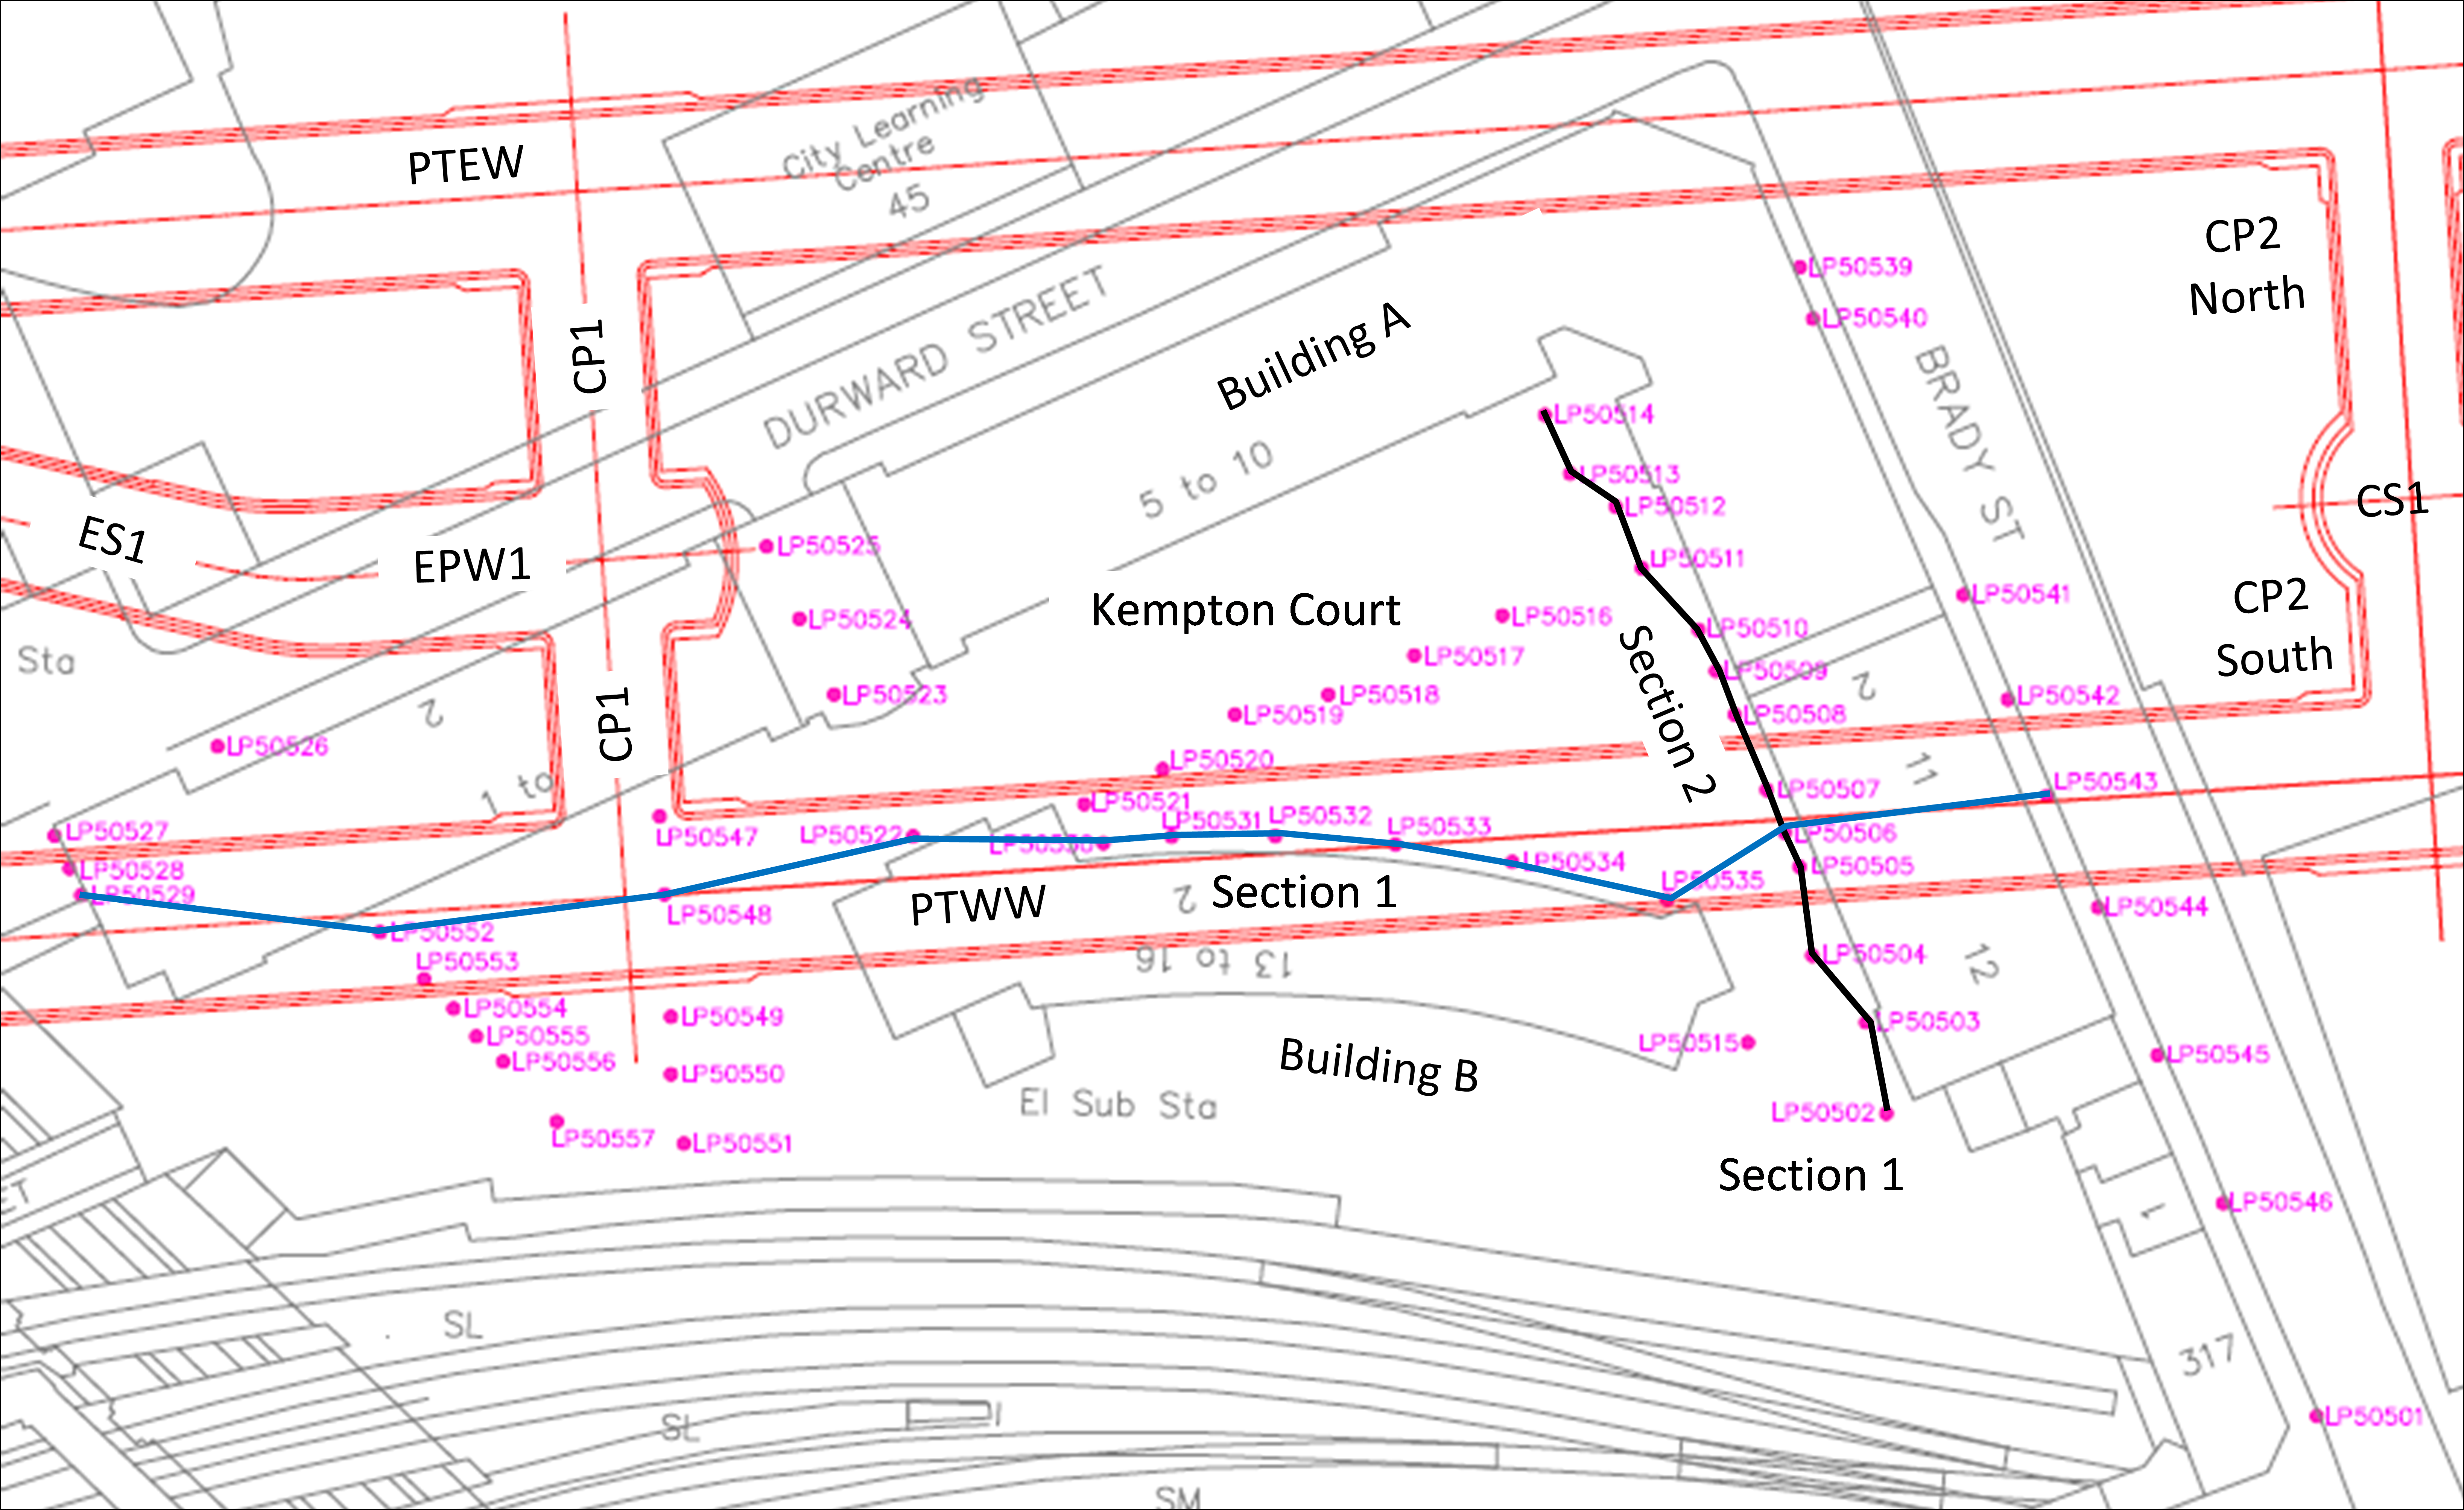
Figure 2 – Location of the transverse section and road studs along the tunnel axis above the Westbound Platform Tunnel.
The Settlement Trough
The transverse settlement profile induced by tunnel excavation in soft ground can be characterised by a ‘Gaussian’ settlement trough[2][3]. The Gaussian settlement trough takes the form of an inverted normal probability distribution curve, transverse to the direction of the tunnel axis shown in Figure 3.
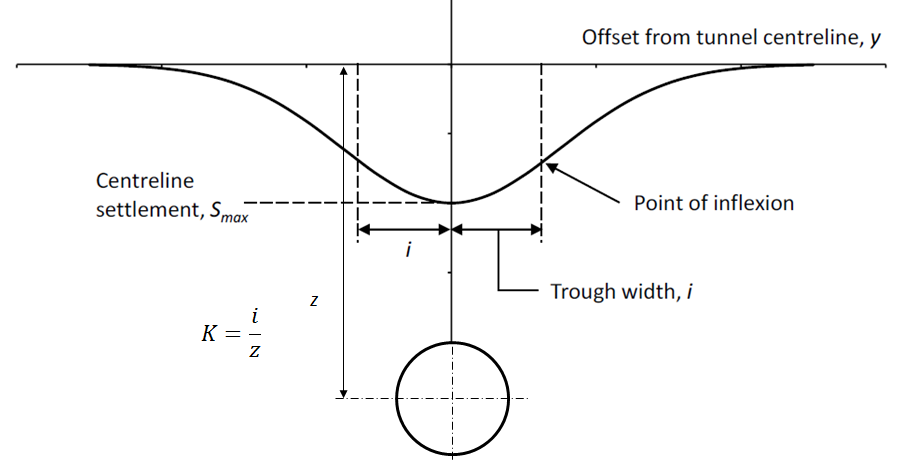
Figure 3 – Gaussian Settlement Trough and Parameters after Jones & Clayton 2013[1].
Two parameters can be used to define the settlement trough. The first parameter is the distance from the centre of maximum settlement to the point of inflection, known as the ‘trough width’, i. The maximum settlement at the centreline of the tunnel, Smax, is the second parameter. In terms of a normal distribution curve the trough width is analogous to one standard deviation and Smax is analogous to the value of the apex of the trough at the mean. The distribution of settlement S at offset y from the tunnel centre line is given by equation (1) [1].
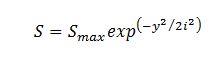 (1)
(1)The area encapsulated between the baseline and the curve is defined as the ‘Volume loss’, Vs. This can be expressed by the following equations (2) [1].
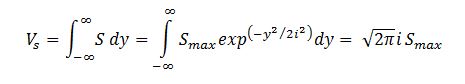 (2)
(2)Using these two equations or combinations, the settlement trough can be defined by any two of the parameters Vs, Smax or i. However, during back analysis the of settlement trough, all three of these parameters are usually unknown variables. The requirement that two of these variables must be known to be able to define the third means curve fitting and back analysis is not straightforward. Requiring
‘Trough width’, i, is often expressed as a ratio relative to the depth of the tunnel axis. This ratio ‘Trough width parameter’, K, expressed in equation (3) is a dimensionless parameter that is used to predict the size of the trough in relation to tunnel depth.
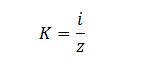 (3)
(3)Volume loss prediction requires consideration of case histories of tunnelling in similar geologies to provide a starting point to estimate the most likely or expected K-value. For tunnelling in London Clay, K-value is typically 0.5.
Gaussian curve-fitting
Back analysis and fitting a Gaussian curve to a settlement trough can be accomplished using nonlinear and linear regression methods. Jones & Clayton[1] provides guidance on the reliability of Gaussian curve parameter determination for different trough and monitoring array scenarios with different curve-fitting methods. For volume loss analysis BBMV has adopted the nonlinear regression method that uses a minimum sum of absolute errors (Minimum SAE) to derive best fit parameters. This is checked against a more straightforward linear regression and direct calculation method based on the maximum settlement (DCSMAX). Trapezoidal integration is not used as this method requires measurement of a complete settlement trough; usually this is not practical or possible in a built up urban environment. The advantage of methods Minimum SAE and DCSMAX is they do not require measurement of the full settlement trough.
Linear regression
The linear method is modified from the Direct Calculation Maximum Settlement ‘DCSMAX’ analysis reviewed by by Jones & Clayton[1]. Direct calculation is more straight forward, but is disadvantaged by the requirement for measurement of Smax. Assuming Smax is accurately known, equation 1 can be reformatted to equation 4 and used to calculate the trough width, i, for each settlement, Sj, at each point j, and averaged by n number of points.
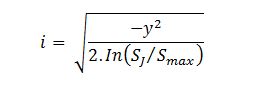
(4)
To increase confidence in DCSMAX back analysis, equation 4 can be rearranged to perform a linear least squares regression analysis of trough width. Figure 4 shows the squared offset y of point j from the centre of the settlement plotted against the natural log of the ratio between settlement Sj of each point j and Smax. As long as Smax is accurately known, readings from a settlement trough that conforms to a Gaussian distribution will plot along a straight line passing through the origin. The gradient of this line from least squares regression can be used to calculate the trough width, i.
However, in the real world it is not always possible to measure Smax in a built up urban environment and there are many possible sources of uncertainty that must be considered. Sources of uncertainty include: monitoring accuracy; offset of the centre of maximum settlement from the tunnel axis due to nearby ground disturbance; the ground may not be uniform and may cause the trough may be asymmetric with different settlement behaviour on each side; settlement influences from other tunnels or depressurisation activities, ground movement unrelated to tunnelling; the ground may not react with a Gaussian settlement distribution. Any one or combination of these uncertainties will result in the best fit line to move away from the origin. If Smax cannot be measured, or is inaccurate, engineering judgement can be applied to estimate Smax. An offset from the tunnel axis can be applied to the model to match the location of maximum settlement. An asymmetric trough can be analysed by treating each side of the trough separately to give a combined total volume loss. A vertical offset can compensate for background settlement or drift in the monitoring data caused by survey error. Non-Gaussian settlement behaviour will require additional analysis. As long as settlements follow a Gaussian trough, maximum settlement, horizontal and vertical offsets can be applied until the linear regression passes near to or through the origin, and achieve a best fit model of the measured trough. Although this method may require some engineering judgement and estimation of data, it provides a useful check on the more complicated non-linear regression method.
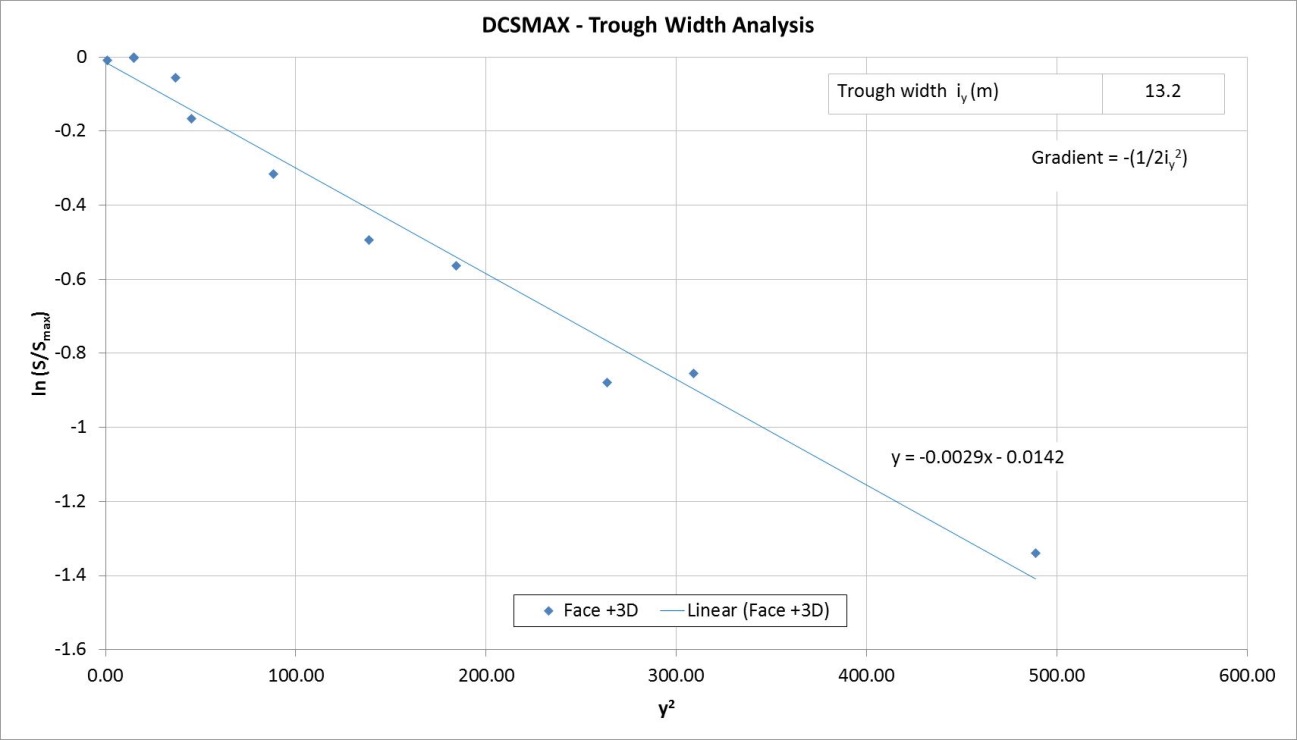
Figure 4 – Least squares regression and calculation of trough width. Example: Last direct settlement influence of the enlargement excavation at Kempton Court.
Nonlinear regression
Sum of absolute errors, SAE, nonlinear regression uses a range of values for two variables, Vs and i, to find the non-linear ‘best fit’. The best fit is defined as the minimum sum of absolute errors. This error is the difference between the measured monitoring data and the Gaussian curve at the same offset from the trough centreline, y, (Figure 5). To find the ‘best fit’ a sum of errors is calculated for each incremental value of volume loss and trough width (Figure 6). The minimum sum of absolute errors, will correspond to the values of volume loss and trough width that describe the best fit Gaussian curve.
The sum of absolute errors, SAE, can be represented by the following expression (5) [1]
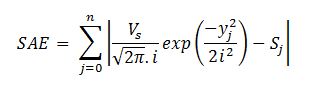
(5)
Where Vs and i are varied, and Sj is the settlement, S, of data point j, from a monitoring array of n monitoring points.
The advantage of Minimum SAE analysis is, unlike DCSMAX analysis, the maximum settlement does not need to be measured and linear regression is not required. However, minimum SEA analysis does require consideration of background settlement influences and may require a vertical offset. The location of maximum settlement does not always coincide with the tunnel axis, and may require an offset from the tunnel axis. For analysis presented in this report, these vertical and horizontal offsets are adjusted manually to reduce the minimum SAE. These offsets could also be included as two additional variable parameters in the non-linear analysis for volume loss at a later date.
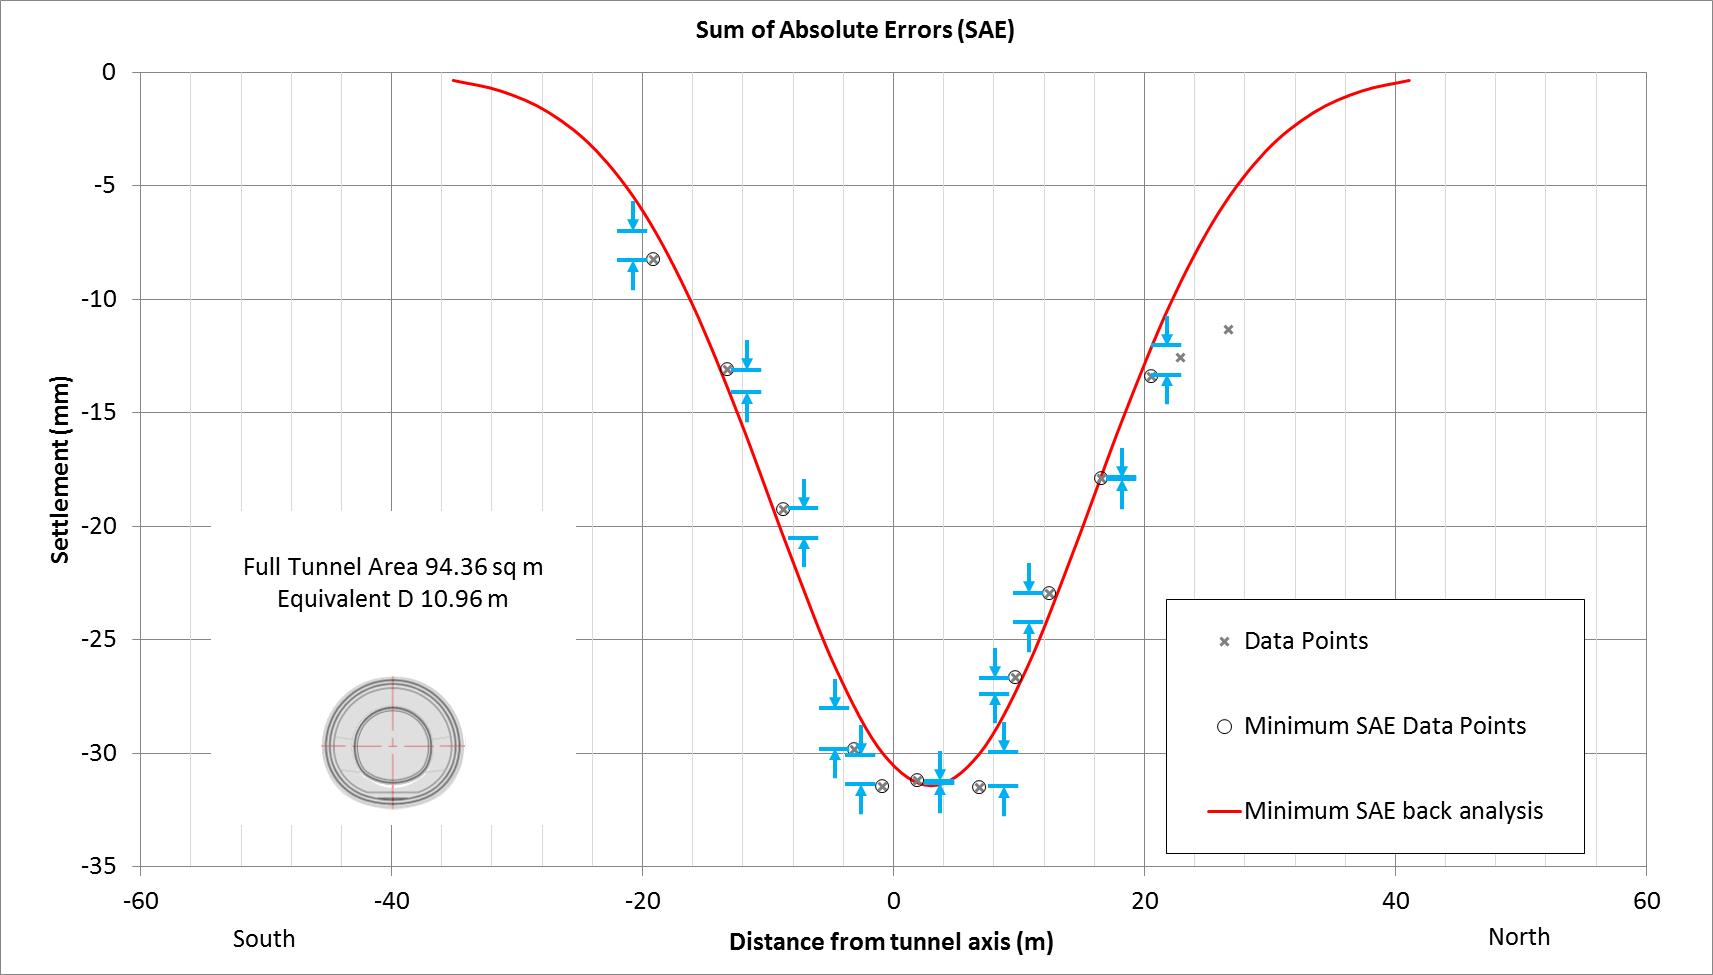
Figure 5 – Minimum SAE best fit curve calculated for the last direct settlement influence of the Platform Westbound Tunnel at Kempton Court.
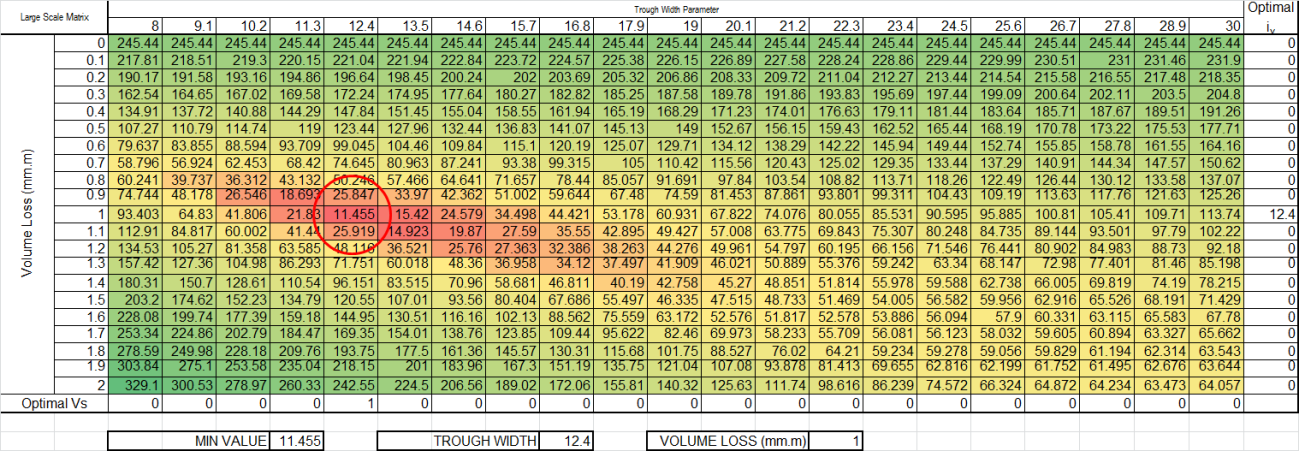
Figure 6 – Non-linear SAE analysis of variable trough width and volume loss parameters to identify the Gaussian curve with the best fit to the manual measured trough.
Monitoring Accuracy and Data Pre-processing
The industry best practice method of monitoring surface settlements used by C510 is precise bar-coded invar staff laser levelling. Transverse or near transverse arrays of monitoring points, comprising nails inserted into pavements surfaces are installed across the zone of influence. The repeatability of this laser levelling method on the C510 contract is approximately 0.5mm or better. Where sufficient data is available, unstable points can be identified and removed from the database and background settlement influences such as additional long term settlements unrelated to the excavation can be identified and corrected for.
Baseline of data
All curve matching methods require the data to be baselined or zeroed at the start of tunnel induced settlement. The longitudinal settlement profile is used to identify the distance from the tunnel face where settlement begins ahead of the active mining face.
For the baseline and for all excavation related analysis, all the surface points are assigned an effective tunnel chainage transverse to the tunnel axis. The effective chainage of each point defines the effective distance of the point to the tunnel face. Regardless of offset from the tunnel axis, each measured point was baselined to zero at the same relative distance along the axis from the tunnel face. This distance is defined by the location of first influence ahead of tunnel face. The consequence of this baseline is points on an array that is oblique to the tunnel axis will not be baselined with the same date and time or to the same excavated advance. This baseline will eliminate any previous settlement and the settlement values of all the points are considered to be related to the same effective distance from the tunnel face.
Monitoring accuracy is an important consideration for baseline of data. Monitoring uncertainty typically ranges from ±0.3mm to ±2.0mm; taking this into consideration an average of a minimum of four readings or more is recommended to reduce the effect of this error. The method of baseline becomes particularly significant where tunnels are small and small settlements are expected to occur. Making use of a single reading for the baseline could result in high uncertainties in the back calculated volume loss. Monitoring frequency can also impact on the ability to identify when the first tunnelling influence occurred. It is recommended that monitoring ahead of the excavation face be sufficiently large enough and undertaken at least daily to accurately identify the first settlement influence.
Data Quality
Both Minimum SAE and DCSMAX methods are sensitive to monitoring accuracy of points at large offsets from the centreline of the trough. Erroneous or outlier points or readings were removed and the settlement history was checked for anomalous movements and offsets. The DCSMAX calculation is particularly sensitive to the accuracy of maximum measured settlement and required careful consideration before inclusion into the calculation.
Initially, daily readings were taken for all manual monitoring points on the C510 Contract. Whilst this provided a high quality set of data, it became clear early on that this was costly and unsustainable. In line with the C510 I&M Plan, cost reduction was implemented with a programme of targeted monitoring with reduced frequencies in areas not direct directly influenced by tunnelling. The side effect of making these cost savings was a reduction in the quality of the monitoring data that became discontinuous and fragmented. To improve analysis, the lower frequency points were interpolated to fill in the gaps in the data.
Most analysis in this report is analysed relative to the advancing tunnel face. Due to monitoring frequency readings could not be taken to coincide with every tunnel advance. To improve data resolution the effective level of the measured points were interpolated for the date and time of each advance. These additional values were required to fill in the gaps between readings due to the variable rates of excavation, variable monitoring frequencies and variable extent of readings. Usually several advances can be excavated between any two readings and often full arrays of points were not measured. This was necessary to build up full profiles both laterally and in time.
Monitoring uncertainty, influence from other tunnels and non-tunnel related settlement
It has been identified on this project the settlement trough of a tunnel can be influenced by ground disturbance from a previously excavated tunnel. Such as in the case of the Westbound Platform Tunnel beneath Kempton Court. The westbound tunnel excavation followed completion of the Eastbound Platform Tunnel running parallel at a distance of 45m to the north from axis to axis. This has resulted in development of an asymmetric settlement trough and offset of the centre of maximum settlement to the north, towards the other tunnel. Both volume loss calculation methods are sensitive to this offset, and required a horizontal offset of the trough centreline from the tunnel axis.
Ideally, all settlement that occurs since the first tunnel influence is considered entirely the result of tunnel excavation. Despite having a baseline to zero settlements to the first tunnel influence, other settlement influences unrelated to tunnelling can still affect the settlement trough after the baseline. These additional settlements can occur both during and after excavation. These settlement influences could be related to on-going residual long term settlements related to nearby excavations, depressurisation of water bearing strata, or any naturally ground movements that may affect the local or wider area. If these ground movements are not considered or accounted for, volume loss could be overestimated. The effect of ground movement unrelated to tunnel excavation can be mitigated by applying a vertical offset, Dz, to the monitoring array.
Monitoring the zone of Influence
To ensure the first and last settlement influence of the tunnel excavation is correctly identified, monitoring of points needs to be sufficiently far ahead of the tunnel face and of a high enough frequency relative to the rate of excavation to capture the start of settlement. For the Pilot tunnel, the rate of excavation for SCL tunnelling has been as high as 8m per day and the first settlement has been identified as far as 35m ahead of the tunnel face. To ensure capture of the first settlement influence, this would require monitoring at least 35m ahead of the face plus an additional 8m to account for the daily rate of excavation.
Identification of external settlement influences can only be accomplished if the monitoring array is sufficiently wide enough to characterise the edges of the trough beyond the inflection point, i. Monitoring up to two trough widths, 2i, from the trough centre may be sufficient to identify ground movement unrelated to tunnelling, but three trough widths, 3i, would be more reliable. If accessible, the full extent of the trough up to 3i should be monitored.
Longitudinal Settlement Profile at Kempton Court
Identification of the first direct influence on ground surface is crucial to set the baseline for the tunnel induced settlement. The longitudinal settlement profile of an advancing tunnel takes the shape of a cumulative probability distribution form. This shape can be treated in a similar way to the Gaussian settlement trough and given a trough length parameter iy that is equivalent to the trough width parameter ix. For tunnels excavated in stiff clays, the surface settlement directly above the tunnel face is reported [6, 7, 8] to generally correspond to about half the maximum short term settlement. The same studies also report the wave length of the longitudinal settlement profile to extend up to 3 times the trough width or 3i in front and behind the tunnel face. Based on this assumption the longitudinal profile of PTW W at Kempton Court should extend 36.6m in front and behind the tunnel with a trough width parameter of 0.5 and tunnel axis at 24.3m bgl.
Analysis of the longitudinal settlement profile was undertaken for eleven road studs located along the axis of the PTW W tunnel at Kempton court (Figure 2) between Chainage 24m and Chainage 149m. The advancement of the tunnel face of was normalised relative each of the levelling studs (face dependent analysis) for the pilot tunnel (Figure 7) and the enlargement (Figure 8). The median of these longitudinal profiles is provided in Figures 9 and 10 for the pilot and enlargement respectively. The longitudinal profile for the maximum settlement of the transverse trough is provided in Figures 11 and 12 for the pilot and enlargement excavations. These are used to refined the zone of influence and set the baseline for volume loss calculations. The predicted settlement profile for a volume loss of 1.25%, is included for comparison with the measured settlement. A second cumulative profile is normalised to the measured settlement profile to compare the measured development of settlement with the predicted form.
Pilot Tunnel
Generally the direct tunnel induced, or short term settlement of the pilot tunnel resulted in a maximum settlement of about 9mm±1mm. Settlement directly above the tunnel face was 3.5mm ±1mm, or 40% of measured Smax. The first influence of the Pilot tunnel is measured at about 35m ahead of the tunnel face, or ~3i, and the final short term settlements occurred from about 20m to 30m behind the face, approximately 2i to 3i. The transition between short term and long term settlement is not well defined and is likely the long term settlement process has started before the short term settlements have stopped. The longitudinal profile of the maximum settlement of the transverse section at Ch 41 is a near perfect match with the 3i predicted distribution of settlements. Although the maximum settlement is 4mm less than predicted, the ground movement above the Pilot tunnel in Kempton Court has developed as expected with an approximate ±3i wavelength or slightly less.
Enlargement Tunnel
The development of the longitudinal settlement profile above the enlargement heading is more complex and does not follow the expected normal cumulative form. According to the median profile, the onset of settlement is reduced to 20m ahead of the tunnel face, a reduction of 42% from the predicted 3i, and only 34% of the short term settlement has occurred above the tunnel face. The maximum short term settlement is achieved within 25m behind the face, reduced by 31% from the predicted 3i. The maximum measured settlement of the PTW W enlargement heading at Kempton Court is 18mm ±3mm, much less than the predicted 25mm with a 1.25% volume loss. Overall the method of excavation with a pilot and enlargement has controlled the zone of influence to within ±2i in the longitudinal direction. The maximum settlement at Ch41 on Section 2 conforms to the median profile.
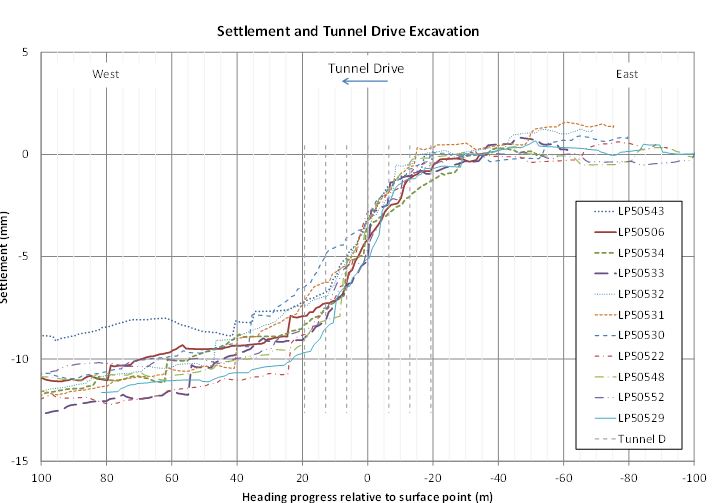
Figure 7 – Longitudinal settlement of roadstuds above the axis of Platform Tunnel Westbound-West Pilot Tunnel (PTW-W PT) at Kempton Court (see Figure 2, Section 1).
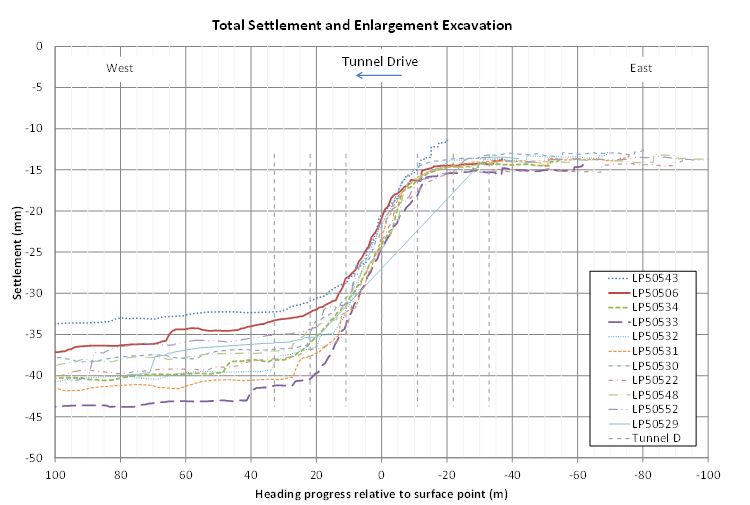
Figure 8 – Longitudinal settlement of roadstuds above the axis of Platform Tunnel Westbound-West Enlargement (PTW-W EL) at Kempton Court (see Fig 2, Section 1).
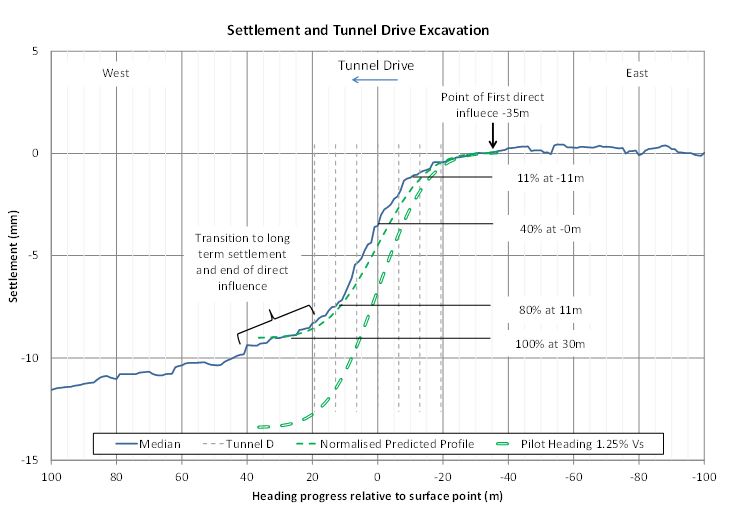
Figure 9 – Median longitudinal settlement profile above the axis of PTW-W PT at Kempton Court (see Figure 2, Section 1).
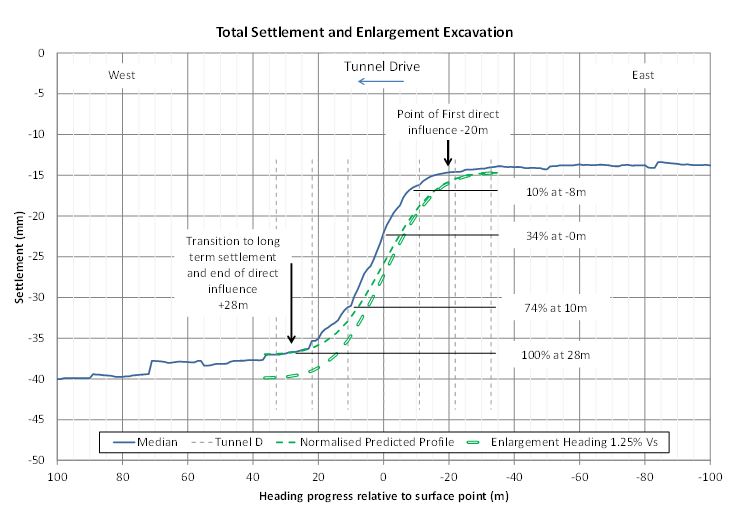
Figure 10 – Median longitudinal settlement profile above the axis of PTW-W EL at Kempton Court (see Figure 2, Section 1).
Figure 11 – Longitudinal settlement profile of Smax at the Ch 41 transverse array above the PTW-W PT axis at Kempton Court (see Figure 2, Section 2).
Figure 12 – Longitudinal settlement profile of Smax at the Ch 41 transverse profile above the axis of PTW-W EL at Kempton Court (see Figure 2, Section 2).
Volume Loss at Kempton Court
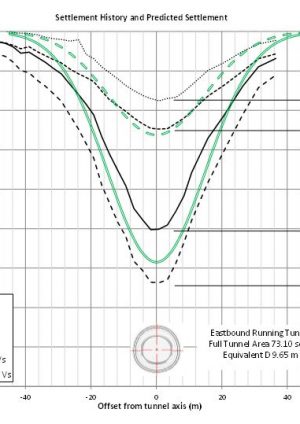
Kempton Court has undergone two phases of short term tunnelling influence from the Pilot tunnel and Enlargement, and two periods of long term settlement (Figure 13). The short term settlement is directly related to the tunnel face passing beneath as previously described. The equivalent diameters for the cross sectional area is 6.5m for the pilot tunnel and 10.96m for the enlargement.
Figure 13 shows excavation of the Pilot tunnel achieved Smax of 9mm, followed by 6mm of long term settlement over a three month period. The enlargement short term settlement reached and Smax of 17mm followed by at 15mm of mm of additional long term settlement over a 17 month period. A larger amount to long term settlement is observed in the area between the tunnels than at the axis of PTW W.
The transverse array located at Section 2 comprises 13 levelling studs across PTW W at Chainage 41. This array is located at the base of the West facing façade of Building B at the eastern end of the courtyard, and is rotated 20° counter clockwise relative to the true transverse section. To better analyse this oblique section settlement of each measured point is calculated independently relative to the advancing face to ensure the correct settlement relative to the advancing tunnel face factored into the calculations.
The measured short term and long term periods of settlement are defined for both the Pilot tunnel and Enlargement in Figure 13. The predicted short term settlement troughs for the Pilot and Enlargement are also included on this figure. The measured trough is clearly asymmetric with the centre of the trough offset from the tunnel axis towards the north. There is an unexpectedly large amount of long term settlement that has occurred after both the pilot and enlargement excavations.
A volume loss best fit analysis was conducted using the standard Gaussian method with the baseline zeroed to the first influence from the pilot tunnel. The single Gaussian curve is assumed to approximate the total settlement trough and was applied to each stage of settlement. The best fit parameters are in Table 1. A best fit was achieved with both the linear DCSMAX and non-linear Minimum SAE methods. An offset from the tunnel axis to match the offset of maximum settlement was included in the calculation. A vertical offset was not applied as the measured trough does not extend far enough from the tunnel axis to identify settlement unrelated the PTW W tunnel.
Figure 13 – Predicted and measured settlement of the Kempton Court array due to PTW-W Tunnel excavation.
Table 1 – Volume loss and best fit parameters for PTW W at Chainage 41.
Pilot Tunnel Settlement Trough
The short term settlement trough for the pilot tunnel reached 0.98% – 1.08% volume loss with a trough width of 13m and maximum settlement of 9mm. The face loss was considerably smaller than the contractual limit of 1.25% (Figure 14). The form of the transverse trough is as expected with a K-value of 0.48. The LasershellTM excavation technique has successfully maintained the face loss below the limit.
Each Gaussian best fit volume loss graph has all available measured data points overlaid onto the predicted short term settlement trough. Each of the data points that are included into the best fit calculations are marked by a black x for DCSMAX and circled for Minimum SAE. The Gaussian best fits are the red lines fit to the data. Data points not marked by a black x and/or circle are considered an outlier or are not representative of the settlement trough.
Figure 14 – Short term volume loss for the PTW-W PT
Face dependent analysis of settlement, volume loss and trough width (Figures 15, 16 & 17) shows there is an identifiable transition between short term and long term settlement. At this transition the maximum short term settlement is reached, rate of increase in volume loss flattens out and the trough width begins to increase. For the Pilot tunnel, this takes place at about 30-35m or 3i behind the tunnel face. By the time the tunnel face is directly beneath the array, the predicted trough width or K-value of 0.5 has fully developed. The trough width remains constant for the rest of the period of direct influence until the tunnel face passes beyond 35m (Figure 17). After the tunnel face passes moves beyond 3i, long term settlement is on-going (Figure 18) resulting in a widening of the trough (19) and long term increase volume loss (Figure 20).
After the Pilot tunnel excavation, three months of long term settlement is observed to increase Vs to ~1.9% relative to the pilot tunnel cross sectional area (Figure 20,21). During this period the trough expands significantly beyond the 1.25% predicted trough with K-value increasing from 0.48 to 0.65. Slopes and deflections of the trough have also increased. Whilst widening of the trough was to be expected in response to long term settlement, the magnitude was of the increase was unexpected. At the edges of the short term trough, long term settlement has also caused an increase in slopes and deflections that are not consistent with the short term settlement trough. This long term ground movement extends beyond the extent of the short term settlement trough.
Figure 15 – Face dependent analysis of settlement for the pilot tunnel.
Figure 16 – Face dependent analysis of Volume Loss for the pilot tunnel.
Figure 17 – Face dependent analysis of Trough Width and Trough Width Parameter for the pilot tunnel.
Figure 18 – Maximum settlement with time for the pilot tunnel.
Figure 19 – Trough width development after the pilot tunnel excavation.
Figure 20 – Long term volume loss after the pilot tunnel excavation.
Figure 21 – Long term settlement three months after completion of the PTW-W Pilot tunnel.
Enlargement Settlement Trough
The total settlement trough after excavation of the enlargement achieved 1.08% – 1.12% face loss, smaller than the contractual face loss requirement of 1.25% (Figure 22). This value also includes the long term settlement that occurred between the Pilot and Enlargement. The K-value of the total settlement tough is 0.55, in agreement with the design value of 0.5 for London Clay.
In addition to the volume loss calculated for the full excavation (94.36m2, or 10.96m equivalent diameter), a separate analysis of the settlement induced by the enlargement heading (61.59m2, or equivalent tunnel diameter of 8.86m) showed some interesting results. For this separate analysis the settlements were baselined to the first settlement influence from the enlargement tunnel face and the excavated cross sectional of the enlargement heading is 61.59m2. The enlargement heading was found to induced a 0.7% volume loss, Figure 23, in comparison with the Pilot tunnel this is a 30% reduction in volume loss. The trough width for the enlargement heading is also unexpectedly smaller then pilot by a factor 20% measuring at ~10m or K-value of ~0.4. The reduction in volume loss of the enlargement heading is attributed to the use of a Pilot tunnel to control settlements of the enlargement. The more narrow settlement trough of the enlargement heading may be influenced by the ground movement already induced by pilot excavation. Face dependent analysis of volume loss shows volume loss developed rapidly stopped increasing at ~20m behind the tunnel face (Figure 24), a distance consistent with the longitudinal zone of influence. The trough width for the enlargement heading remains constant throughout the excavation influence (Figure 25).
Seventeen months of long term settlement has occurred up to September 2014 since completion of the enlargement and is still on-going. During the first three months, volume loss has increased from ~1.1% to ~1.3% (Figure 26) and the total settlement trough match the predicted settlement trough for the full tunnel. Long term settlement over the full 17 month period has increased volume loss to ~1.9% – 2.0%, nearly double the short term volume loss (Figure 27). The calculated volume loss using the standard Gaussian best fit is much larger than was predicted. The trough width has increased from 13.5m to 15.4m or K-value from 0.55 to 0.63. The widening of the trough has significantly contributed to the increase in face loss and increased slopes near to and beyond the limit of the short term trough.
North of PTW W in the area between this tunnel and PTE W, long term settlement is having a different effect. The slopes and deflections are decreasing and the apex of the trough is progressively offset further northwards from the tunnel axis towards the other tunnel. This is attributed to the cumulative effect of settlement induced by the platform tunnel excavated 45m to the north.
Figure 22 – Total short term settlement for PTW-W, including the Pilot tunnel, enlargement and the long term settlement between excavations.
Figure 23 – Short term settlement trough for the PTW-W EL, enlargement heading. Settlement is baselined to zero at first influence from the Enlargement.
Figure 24 – Face dependent development of volume loss for the PTW-W EL, enlargement heading. Settlement is baselined to zero at first influence from the Enlargement.
Figure 25 – Face dependent development of trough width for the PTW-W EL, enlargement heading. Settlement is baselined to zero at first influence from the Enlargement.
Figure 26 – Total settlement three months after completion of PTW-W EL.
Figure 27 – Total settlement 17 months after completion of PTW-W EL
Long term settlement
Independent analysis of the periods of long term settlements after the pilot and enlargement excavations shows little apparent correlation between the long term settlement and the short term settlement trough (Figures 28 and 29). Figures 28 and 29 show the long term settlement profile three months after the pilot and enlargement headings are nearly identical. The profile appears to form one half of a very wide settlement trough centred above the mid-point between the two tunnels. If this is true, matching a Gaussian curve to this data may be able to predict the extent of the trough and may represent the combined long term settlement behaviour of both tunnels.
A best fit analysis for the long term settlement indicates this long term settlement trough has a remarkably consistent profile and trough width of ~36m to ~40m and K-values ranging between ~1.5 to ~1.7 for the entire period. The trough best fit at 17 months after the enlargement give an estimated trough width of 36m or a K-value of 1.5 (Figure 30).
Since the start of this period, no additional settlement is identified to matching the profile of the short term trough. This suggests that the short term settlement has completely stabilised after the last influence form the tunnel face. This indicates the only settlement that has occurred is entirely due to long term consolidation processes.
For this report, there is not enough available processed data to understand the affect the double tunnel system has on long term settlement. To better understand the effect of long term settlement, the long term settlement trough for a single tunnel needs to be analysed first.
Figure 28 – Long term settlement three months after completion of PTW-W PT tunnel. Settlement baselined to the last influence from the Pilot tunnel
Figure 29 – Long term settlement three months after completion of PTW-W EL
Figure 30 – Long term settlement 17 months after completion of PTW W pilot tunnel
Development of the Settlement Trough
Analyses of the development of the total settlement trough in response to tunnelling and long term settlement (Figures 31, 32 and 33) show some unexpected behaviour. Principally, the trough width, i, of the measured settlement trough is observed to decreases during tunnel excavation and to increases during periods of long term settlement. While it is expected for the trough width to increase in during the long term, it was not expected the trough width to decrease during excavation.
Preliminary analysis indicates the short term settlement trough and long term settlements represent influence from different settlement processes. The short term settlement trough is well understood and well quantified, whereas the less well understood long term settlements may represent a much wider settlement feature. The long term settlements may be able to be approximated by a Gaussian best fit. Comparison of the extent of the short term trough with the extent of distribution of the long term settlement shows these processes will have a different trough width. It is suggested the widening of short term settlement trough in response to long term settlement can be explained geometrically as a superposition of a wider wavelength form onto the existing trough. This could explain how the trough is widening with settlements occurring outside the area of short term settlement and explain the gradual increase in slopes and deflections observed throughout the trough. Conversely, the superposition of the more narrow trough such as that induced by the enlargement excavation, will act to narrow the measured trough. This inter-relationship between different settlement influences requires further study.
Figure 31 – Full settlement history of maximum settlement.
Figure 32 – Volume loss development, analysis from single Gaussian curve analysis. All values are calculated relative to the full Enlargement excavation.
Figure 33 – Trough width and trough width parameter development
Short Term vs Long Term settlement influences
Traditional volume loss analysis uses a single Gaussian best fit for the total settlement trough since baseline at the first tunnel settlement influence. The short term trough is well understood and the Gaussian best fit curve can match very closely the shape of the measured trough. However, the ability of the Gaussian curve to fit the measured trough seems to reduce with each successive tunnel heading and during periods of long term settlement. In the case of multiple tunnel drives, the best fit Gaussian curve will match closely with the measured trough only if the most recent tunnel drive induces enough settlement to overwhelm the geometry of a pre-existing trough.
At Kempton Court and throughout the Whitechapel area, the long term settlement is observed to increase the slopes and deflections both within and beyond the short term settlement trough. This settlement results in non-Gaussian development of settlement that affects each back analysis method differently. The DCSMAX best fit that is constrained by the maximum measured settlement tends to widen resulting in an overestimation of settlement at the inflection point of the trough and therefore overestimate volume loss. The least squares analysis shows the data at large offsets from the tunnel axis to deviate from the line that defines the Gaussian curve. The SAE best fit that is not constrained by Smax will also widen in response to long term settlement, but to maintain best fit the apex of the trough tends to rise above Smax, resulting in underestimation of volume loss. Both methods require a vertical offset Dz to be applied to improve the curve fit, but Dz introduces some uncertainty.
Long term settlement is not uniformly distributed, but decreases with increasing offset from the tunnel axis. The zone of long term settlement also extends much further than the short term settlement trough. The process of long term settlement affecting the ground after tunnelling defines a much wider area that is independent of the short term settlement trough. Wongsaroj et al.[5] provided a method for predicting long-term tunnelling induced consolidation settlement in London Clay from first principles. Predictions were validated using case studies from St James’ Park and the Heathrow Express (HEX) Trial Tunnel. Results from this method indicate the long term consolidation settlement takes the form of a trough that is much wider than the short term settlement trough. It stands to reason that if the short term settlement trough can be empirically back calculated, so can the long term settlement trough. It is proposed the short term and long term settlements can be analysed separately and the wider long term settlement can be modelled by its own Gaussian best fit. The two values can be summed together to give a total volume loss.
To investigate the long term settlement, an exceptionally long array is needed with points located far from areas affected by short term or long term settlement, and is influenced by only one tunnel. The natural ground movements of the area must also be well understood and the natural on-going or seasonal ground movements identified. One array that fits this criteria is located at Vallance Road to the west of Whitechapel station.
Vallance Road Volume Loss
The Vallance Road array comprises a 110m long array of 35 road studs that are offset to up to 73m to the south and 37m to the north of the tunnel axis, Figure 34. This array is only influenced by one tunnel, the Eastbound Running Tunnel West (EBRT W), that was excavated with a pilot tunnel heading followed by enlargement. The short term and long term settlement components for each tunnel heading are identified in Figure 35. These periods of settlement will be analysed independently using multiple Gaussian best fit curves to determine differences between the short term and long term settlement behaviour. These well be compared with the standard single Gaussian best fit method.
Figure 34 – Vallance Road Roadstuds
The Vallance Road Gardens area has been monitored continuously for the last three years since November 2011. During the period of monitoring, the area has undergone a continuous long term settlement of about 4mm per year[11]. This settlement is unrelated to tunnelling and depressurisation works and is likely the result of natural on-going ground consolidation processes.
The south end of the array is considered outside the zone of influence for both short term and long term settlement induced by tunnelling, yet 2mm of settlement has been observed. This 2mm has accumulated over a 6 month period since the first influence from tunnelling in March 2014, a rate of settlement that is identical to the natural ground movement. Based on this information, the entire settlement trough is assumed to have a uniform 2mm settlement component that is unrelated to tunnelling that can be removed from the calculation.
Standard Gaussian analysis
Standard back-analysis using a single Gaussian best fit for the total settlement trough at each stage of excavation has been undertaken (Table 2). Each calculation is baselined to the pilot first influence and a Dz is applied to improve the best fit. Volume loss is calculated for the total settlement trough at the last influence from the pilot heading (Figure 36); the end of the first period of long term settlement and start of influence from the enlargement (Figure 37); the last influence for the enlargement (Figure 38); and the latest reading three months after excavation (Figure 39).
In the attempt to correct for long term settlement by applying a Dz to the standard Gaussian analysis, two deficiencies were identified. To attain a best fit, the value of vertical offset, Dz, often needed to be larger than the equivalent long term settlement for the same period, occasionally overestimated by as much as 50%. The measured levels farthest from the tunnel axis also could not be matched by the best fit trough and some had to be excluded from the calculation to achieve best fit.
Figure 35 – Predicted and measured settlement of the Vallance Road array due to EBRT-W Tunnel excavation.
Table 2 -Standard Gaussian analysis best fit parameters for EBRT-W
Figure 36 – Short term volume loss for the EBRT-W Pilot Tunnel
Figure 37 – Three months after completion of EBRT-W Pilot tunnel before first settlement influence from the enlargement.
Figure 38 – Total settlement analysis for the EBRT-W Pilot tunnel, Enlargement and long term settlement between tunnel headings.
Figure 39 – Total settlement trough at three months after completion of EBRT-W EL.
Modified Gaussian Analysis
The absolute measured trough is observed to undergo a continuous trend of narrowing during excavation and widening with long term settlement. Table 3, shows how the trough width for EBRT-W tunnel varied in response to excavation and long term settlement. To find the Gaussian best fit, the trough width had to be varied with each reading to for the curve to fit the measured trough.
In detail, the initial short term trough induced by the Pilot excavation rapidly reached the predicted trough width by the time tunnel face reached the transverse section. As Pilot tunnel face passed beneath and progressed away from the measured section, the trough width of the pilot remained constant until the last settlement influence of excavation stopped. The Gaussian best fit is a near perfect match to the short term settlement of the pilot tunnel. After pilot excavation and onset of long term settlement, the Gaussian best fit trough width had to be increased with every reading to maintain best fit with the measured trough. However the Gaussian best fit deteriorated with on-going long term settlement and could not perfectly fit the total measured trough. During excavation of the enlargement the trough width of the Gaussian best fit had to be reduced to follow the behaviour of the measured trough. During this second stage of excavation the measured trough width continually decreases until the last influence from excavation. After the last influence from enlargement and onset of renewed long term settlement, the Gaussian best fit trough width had to be increased again to maintain a best fit to the measured settlement trough. Due to the ever changing trough width and long term settlements occurring at the edges of the trough, the Gaussian best fit becomes less able to perfectly match the measured settlement profile of the trough. Consequently the error in the estimated volume loss increases.
Therefore in an attempt to understand the behaviour of the absolute settlement trough, each period of settlement influence was analysed separately. Each period of short term and long term settlement are defined as per Figure 40. It was found the Gaussian best fit matched perfectly to the settlement of each period and interestingly, the trough width of the best fit did not change during the each settlement period, Figure 41. Separate analysis of each period of settlement shows the short term and long term settlements have significantly different trough parameters (Table 3). The difference is likely due to the different processes of settlement that dominant of each settlement period. Based on this reasoning, we propose separate analysis of long term and short term settlement is required to accurately determine total volume loss of the settlement trough.
Results from separate analysis of short and long term settlement for the EBRT W indicates volume loss may be underestimated by the standard Gaussian best fit by as much as 0.1% to 0.2%, Figure 42. The most significant discrepancy is due to the contribution of long term settlement. Separate analysis of the long term settlement between the pilot and enlargement excavation gave a volume loss of ~0.55%, whereas standard analysis indicates ~0.22% volume loss occurred over the same period. It appears the single Gaussian best fit was not able to fully account the wider distribution of long term settlement.
Table 3 – Summary of the development of the settlement trough and comparison to separate analysis of periods of settlement.
Figure 40 – Maximum settlement for the Vallance Road array
Figure 41 – Trough width comparison between total settlement Gaussian and multiple Gaussian analysis of periods of settlement.
Figure 42 – Cumulative volume loss for the Vallance Road array. All values are calculated relative to full enlargement excavation.
Settlements for each period of short term and long term ground movement are analysed separately. The volume losses are calculated relative to the cross sectional area of each excavated heading for EBRT-W (Pilot tunnel 32.77m2; Enlargement heading 41.33m2; Full Enlargement 73.10m2). The calculated volume loss and best fit parameters are shown in Table 3. During the long term settlement periods, a Dz of about -1mm has been applied to each ~3 month period to remove the actual long term settlement known to affect the area form the calculation.
Separate analysis of each period identified significant differences in the settlement behaviour between short term settlement influence of tunnel excavation and long term settlement influence after excavation. This analysis also showed variation between settlement induced by the pilot tunnel and enlargement headings.
Separate analysis of the long term settlement during the three months after the pilot tunnel excavation revealed a smooth, low amplitude and long wavelength distribution of settlement. This settlement distribution did not resemble the short term settlement trough, Figure 43, and extended far beyond the short term trough nearly to the end of the array 73m from the tunnel axis. The Gaussian best fit found a near perfect match to the measured long term settlements. The best fit has a trough width of 29m or K-value of 1.0, and the trough width was found to not change during the whole three month period. By three months there was an Smax of 2.5mm at the tunnel axis and there is approximately ~1mm of settlement at the edge of the short term settlement trough. The combined short term settlements of from excavation and the observed long term settlement, explained how widening of the absolute trough has developed in Figure 37. The settlement causing an increase of slopes and deflections at the edge of the short term trough matched the increase in slopes and deflections on the long term settlement trough. When a Gaussian best fit is attempted for the combined trough, there is a miss-match at the inflection point and the apex of the trough (Figure 37).
The short term settlement induced by the enlargement heading (Figure 44) is shown to have narrow trough width of 12.5m or K-value of 0.42. This trough width is smaller than the pilot tunnel induced trough width of 14.5m or K-value of 0.48. The narrower enlargement trough is similar to findings at Kempton Court. However the enlargement at Vallance Road induced a volume loss of 0.94%, nearly the same as the pilot tunnel (0.98%).
The distribution of long term settlement that occurred for the three months after enlargement excavation has a trough width of ~22m or K-value of 0.75, Figure 45. This is 25% more narrow than the long term trough before the enlargement and may be related to the reduction in the short term settlement trough induced by the enlargement heading, this requires further study.
Table 4 – Best fit parameters from multiple Gaussian analyses
Figure 43 – Long term settlement trough best fit analysis for the period between the EBRT W pilot tunnel and enlargement heading excavations.
Figure 44 – Settlement trough best fit analysis for the EBRT W enlargement heading. Settlement data is baselined to the first influence of the Enlargement.
Figure 45 – Long term settlement trough best fit analysis for the period since completion of the enlargement.
Conclusion
Short Term Settlement Trough
The short term settlement trough induced by the Pilot tunnel at both Kempton Court and Vallance Road has closely followed the predicted form for London Clay. The transverse trough width, i is about 12m or K-value of 0.5 and longitudinal zone of influence is ±35m or ±3i. The short term volume loss of the pilot tunnel was generally limited to 1.0 to 1.1%, well below the contractual Vs of 1.25%.
The enlargement short term settlement trough at Kempton Court was limited to a volume loss of 0.7%. In comparison to the pilot tunnel this is a 35% reduction. The trough width of the enlargement heading was also reduced by 20% to 10m or K-value of 0.4. Most significantly, the longitudinal zone of influence, or settlement ahead and behind the tunnel face was reduced from 35m observed for the pilot to 20m. At Vallance Road the enlargement heading settlement trough was similar in that the trough width was 2m less than the pilot, but the volume loss was the same as the pilot tunnel.
The similarities between Vallance Road and Kempton Court, suggests there is continuity in ground conditions across the Whitechapel Site.
Long Term settlement Trough
The long term settlement has a much wider than expected influence than the short term settlements induced by tunnelling. Separate analysis of the long term settlement shows the long term settlements do have a Gaussian distribution relative to the tunnel axis, albeit of a lower amplitude and much wider wavelength.
At Vallance Road, best fit analysis of the long term settlement identified a long term trough width of 29m or K-value of 0.96 after pilot excavation. After excavation of the enlargement the long term trough had a trough width of 22m or K-value of 0.74. This 25% reduction in the long term settlement trough width coincides with a 15% narrowing of the short term trough width of the enlargement heading in comparison to the Pilot heading. This suggests there may be some proportion relation between the size of the short term and long term trough, but this requires more study to verify. The effect of depressurisation has not been separated from the long term settlements.
The long term settlement profile at Kempton is likely to represent the cumulative effect of the two long term settlement troughs from the PTW W and PTW E tunnels. Due to the size of the long term settlement troughs and the 45m distance between the tunnel axes, the long term settlement troughs will merge into a single indistinguishable trough. The centre of maximum settlement of this combined trough will be located mid-way between the Platform Tunnels. This idea is currently untested, but is supported by the observation of higher rates of long term settlement in the area between the tunnels than at the axis of the tunnels. This settlement is still on-going at the time this report was written (Oct 2014).
Behaviour of the total Settlement Trough.
Superposition of different trough widths induced by for short term and long term settlement processes has resulted in width of the total settlement trough to decrease during excavation and to increase during long term settlement.
Separate analysis of short term and long term settlement shows the settlement processes affecting a single settlement trough do not have the same trough width. In reality, the settlement trough is the combined result of multiple superimposed settlement troughs of varying wavelengths.
Observations from Kempton Court suggest the short term settlement induced by tunnelling has fully stabilised once the tunnel face has passed beyond the zone of influence defined by the longitudinal settlement profile. From this moment it appears the ground movement is no longer influenced by a settlement trough defined by K-value 0.5, but is influenced by the longer wavelength long term settlement trough. For a single tunnel as in the case of Vallance Road, the long term settlement trough width can vary from 20m to 30m or K-value of 0.75 to 1.0.
Modified Approach
We propose a modified multiple Gaussian best fit analyses approach to volume loss. This approach may provide the means to address discrepancies identified between the Gaussian best fit and the total measured trough. This approach may be able to model the non-Gaussian settlements observed at the edge of the trough and quantify the on-going increase in slopes and deflections observed inside and outside the short term settlement trough.
The modified approach can analyse each distinct period of settlement by setting baselines at the start and end of each period and calculate the relative volume loss for each period. Each measured point was baselined individually using the same method as described for the initial baseline. The total volume loss can then be summed from the individual periods.
The modified approach applied to Kempton Court and Vallance Road helped to demonstrate a better understanding of the scale and behaviour of long term settlement and the effect on slopes and deflections.
The modified approach was able to better estimate the volume loss of the periods of long term settlement than the standard single best fit method. In the case of EBRT W the volume loss was underestimated by 0.1% to 0.2% due to the wide distribution of the long term settlement trough relative to the short term settlement.
References
[1] Jones, B. and Clayton, C., 2013. Guidelines for Gaussian curve-fitting to settlement data. World Tunnel Congress 2013 Geneva Underground – the way to the future! Ed: G. Anagnostau & H. Ehrbar.
[2] Peck, R. B. (1969). Deep excavations and tunnelling in soft ground. Proceedings of 7th International Conference of Soil Mechanics and Foundation Engineering, Mexico City, State of the Art Volume, 225-290
[3] Schmidt, B. (1969). Settlements and ground movement associated with tunnelling in soils. PhD Thesis, University of Illinois, Urbana.
[4] Robertshaw, R., 2011. Piled Building Settlement Assessment Stations/Shafts/Portals Phase 3 Report, Kempton Court, 2 Durward Street. Document number: C122-OVE-Z-CRG01-00651 Rev 2.0
[5] Wongsaroj, J., Soga, K. & Mair (2013) Tunnelling-induced consolidation settlements in London Clay, Geotechnique, 63 (13), 1103-1115
[6] CIRIA (1996) Prediction and effects of ground movements caused by tunnelling in soft ground beneath urban areas. London: CIRIA
[7] Mair, R. J. & Taylor, R. N. (1997) ‘Theme lecture: Bored tunnelling in the urban environment’. Proceedings of the 14th International Conference on Soil Mechanics & Foundation Engineering 4. Held in Hamburg. Rotterdam, Balkema, 2353-2385.
[8] Groves, P. N., Morgan, S. R. (1997) Engineering consequences of ground conditions of NATM works at London Bridge Station, Jubilee Line Extension. Proceedings of the 8th International Tunnelling Symposium. London: Institution of Mining and Metallurgy.
[9] Eddie, C. and Neumann, C. (2003) LaserShell™ leads the way for SCL tunnels. Tunnels and Tunnelling, June 2003, 38 – 42.
[10] Eddie, C. and Neumann, C. (2004) Development of LaserShell™ Method of Tunneling. Proceedings of the North American Tunneling Conference 2004, Atlanta. Pub. Balkema, Rotterdam.
[11] Colace, A. and Stärk, A. (2014) Depressurisation and Surface Settlement at Vallance Road Garden, WHI. CRL Technical Paper Contest 2014.
-
Authors


Dr Alfred Stärk Dipl Ing Dr Ing - BeMo Tunnelling
Dr Alfred Stärk is Chief Geotechnical Engineer and Engineering Manager at BBMV for Crossrail Contract 510 ‘Whitechapel and Liverpool Street Station Tunnels’ since March of 2011. He started his career at the University of Hanover, Germany, where he worked as assistant professor and consultant for 10 years. In 2002 he joined BeMo Tunnelling, Innsbruck, Austria. He now has 25 years of experience in large-scale tunnelling, mainly with sprayed concrete lining in soft ground.
