3D numerical analysis of sprayed concrete lined tunnels: Influence and optimisation of the simulation of varied construction schemes
Document
type: Technical Paper
Author:
Stephen Flynn MSc, CEng MIEI, Angelos Gakis Dr. Dipl-Ing, MSc DIC, CEng MICE, Panagiotis Spyridis Dr.Dipl-Ing, MSc, CEng MICE
Publication
Date: 31/08/2016
-
Abstract
3D numerical models require significant effort for their preparation and analysis, translated into time and cost. It is in the hands of the engineer to set the optimal level of simulation detail that will provide a reliable and cost effective solution. In sprayed concrete lined tunnels, a common simplification is to simulate the excavation with full face steps. This assumption can prove effective in minimising the modelling and analysis effort required to check the structural capacity of the concrete lining. However the calculated in-tunnel and surface deformations may not adequately reflect the actual observations due to the behaviour of the calculated lining stresses. The results of such analysis are often utilised in order to establish trigger levels. Therefore, it is imperative that the solution best reflects the real behaviour as much as possible.
The effect of simulating varied excavation sequences of a sprayed concrete lining tunnel on the 3D numerical analysis results, was investigated in this study. The excavation of a 20m long tunnel, 11.2m high and 10.4m wide, enlarged from an existing TBM tunnel (6.4m OD) was simulated using four different excavation sequences: i) full face, ii) top heading, bench and invert and iii) top heading, invert and bench and iv) top heading, combined bench/invert. Moreover, the effect of applying intermediate soil relaxation factors prior to the installation of the lining was also examined. The models were calibrated against real measurements.
-
Read the full document
Notation
CAD Computer Aided Design
CAE Complete Abaqus Environment
FE, FEA Finite Element, Finite Element Analysis
FF Full Face (referring to the excavation and support sequence)
TH, B, I Top Heading, Bench, Invert respectively
MCS Monitoring Cross Section
SCL Sprayed Concrete Lining
SFR Steel Fibre Reinforced
TBM Tunnel Boring MachineIntroduction
In tunnelling, the use of finite element (FE) modelling to determine lining stress and in-tunnel displacement is a commonly employed practice. Either two-dimensional (2D) or three-dimensional (3D) analyses may be deployed, with the latter accounting for many of the 3D effects that are not captured in the simplistic, two dimensional approach. In this study, a number of 3D FE analyses were carried out, utilising software – ABAQUS [2]. A selection of back-calculated field stresses and concrete stiffness values were modelled using various excavation and support sequences to determine the in-tunnel displacements and lining stresses of the advancing tunnel. Four different excavation sequences were developed and the results were compared with field measurements observed at Crossrail’s Farringdon Station. Using a well-instrumented tunnel as a case study, the paper aims to demonstrate how a very detailed sensitivity study and 3D numerical analysis can be used to determine the optimal level of simulation for future FE problems. More than 40 different analyses have been performed in order to identify the sensitivity to variations in the inputs in an attempt to replicate the actual in-tunnel monitoring data. Out of those, some were selected as most representative and relevant to the conclusions. The study uses Crossrail Farringdon station as an example, but the conclusions can be considered for similar ground and construction conditions.
Considered Geology
The geological formations encountered in the area of Farringdon Station are typical of the London basin, where the upper strata comprise of man-made deposits (Made Ground), Alluvium and River Terrace Deposits (mainly in the Eastern part) overlaying London Clay, Lambeth Group, Thanet sand and chalk. In the FE model chalk layer was considered as the bed rock and therefore the bottom boundary of the model is the top of the chalk layer. An important feature is that the thickness of the London Clay layer was significantly thinner in the western part in relation to the eastern part, varying between 4 to 10m and contains London Clay A2 subdivision only. The tunnel horizon is mainly within the Lambeth Group, a heterogeneous formation comprising of stiff to very stiff, overconsolidated clays with interbedded sand lenses of unknown orientation, size and water pressure regime. The presence of multiple Faults which affected the thickness, the elevation and the continuity of the top/bottom of the soil layers has not been taken into consideration in the present study. Instead horizontal bedding has been introduced. The soil parameters used in the FE models are given in Table 1 and the stratigraphy introduced in the model is shown in Figure 1.
Soil Properties Upper Strata London Clay Lambeth Group Thanet Sand Unit Weight [kN/m3] 17 20 21 21 Young’s Modulus [MPa] 10 40+3.7z 36+5.9z 209+4.3z Poisson’s Ratio [-] 0.2 0.495 0.495 0.2 Undrained Shear Strength [kPa] N/A 85+6.5z 95+10z N/A Friction Angle [o] 31 0 0 39 Lateral pressure coeff. ko [-] 0.5 1.2/0.6 1.2/0.6 1.0 Table 1 – Geotechnical parameters considered in the present study.
In-tunnel Monitoring
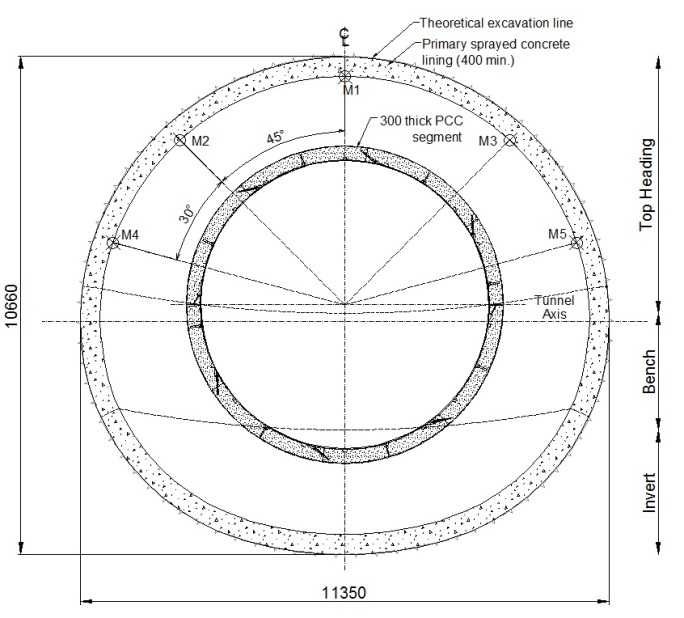
A 12m diameter platform tunnel (platform tunnel east – PTE), 300m in length was taken as the case study. Monitoring was performed with a total station measuring manually absolute 3D displacements of monitoring targets. Monitoring cross sections (MCS) were installed approximately every 10m of the tunnel. The tunnel cross section and the position of the monitoring points are shown in Figure 2. After the installation of a MCS the first (zero) reading was taken. The MCS in general exhibited initial deformations up to the point of the ring closure (typically 3 days with top heading, invert, bench excavation at 2m per day advance rate), where displacements/time relationship was linear. Post ring closure, the tunnel section began levelling out for a maximum of 5 days, after which stable conditions were observed. For the purpose of this report, values were extracted from the 3D FE model at its middle section, 30m either side of the boundary. This position was less affected by boundary effects, allowing for a comparison between the field values and FE results.
Finite Element Modelling
The numerical calculations were carried out by use of the finite element method. The program used for the analyses was Abaqus CAE Ver. 13-1 of Dassault Systems [2] and some elements of this program are presented below. Abaqus – CAE (Complete Abaqus Environment) is a software application combining all steps of the model, that being (a) the CAD formation of the model geometry, (b) the input of the modelling parameters, the mesh generator and generally the pre-processing, (c) the solver, and (d) the post-processing of the results.
The dimensions of the model were chosen so that the boundary conditions did not influence the stresses and deformations around the investigated structure. Based on sensitivity analyses performed in the course of the investigations, that was typically a distance of more than 5 diameters from the areas of interest, and more than approximately 1.5 diameters from the model bottom. The study was based on total stress analyses with a Mohr-Coulomb material law, accounting for an increased unloading stiffness below the excavations. The boundary conditions were set as uni-directional constraints of the x, y, and z directions at the external yz, xz, and yx planes of the model respectively.
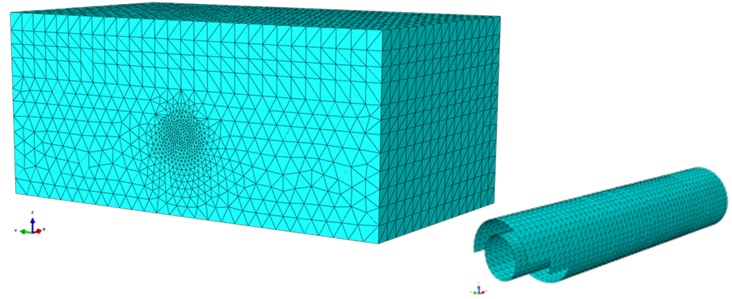
The analyses have utilised 3D continuum elements in order to simulate the soil whereas the linings were simulated as 2D shells (skins) in the same plane with the excavation boundary. For the meshing of the model a global element size of 8m was applied to the soil elements, this being the element size towards the outer boundaries of the model as shown in Figure 3. A generic size of 0.50 m was assigned to the lining shell elements. The elements used for the tunnel lining were triangular linear shell elements with finite membrane strains, specified as S3 in the Abaqus element library, while the 3D soil elements were 4-noded tetrahedral linear solid elements specified as C3D4.
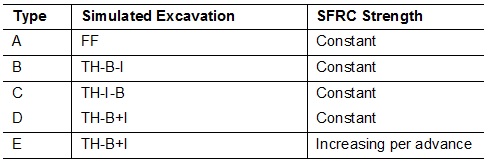
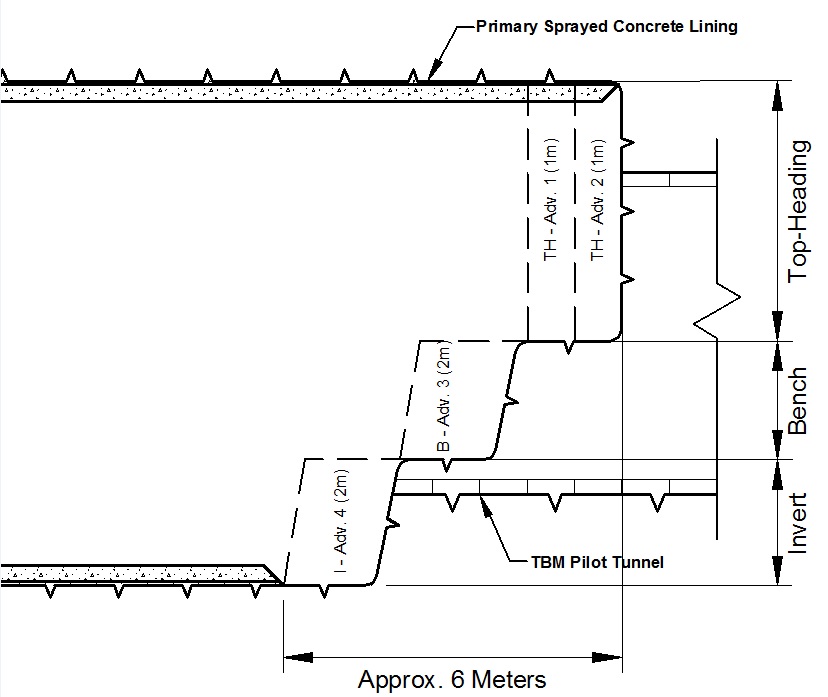
The calculation steps were modelled so as to simulate the various excavation and support approaches, whether this was a full face excavation (FF), top heading-bench-invert (TH-B-I), top heading-invert-bench (TH-I-B) or top heading-combined bench and invert (TH-B+I) (see Figure 4). These four, separate excavation sequences were modelled using various combinations of the earth coefficient at rest (ko), steel fibre reinforced concrete (SFRC) stiffness and soil softening to produce a comprehensive register of in-tunnel deformations and lining stress behaviour.
The general analyses steps followed were:
- Geostatic stress state
- Softening of subsequently excavated TBM tunnel area by 50%
- Installation of TBM lining and removal of softened soil
- Simulation of the stepwise excavation and the construction procedure
The soil self-weight was assigned in the model elements and the loads exhibited on the lining elements were calculated automatically with the soil-structure stress/strain equilibrium of the numerical analysis. Various parameters were investigated with the base simulations presented in Table 2. Additionally the effect of adopting a smaller ko value (0.6) at the vicinity of the tunnel as compared to the design value of 1.2 was examined.
Results and Evaluation
The results of multiple 3D Finite Element (FE) analysis undertaken to assess in-tunnel deformations and lining stresses of the primary sprayed concrete linings (SCL) are presented and discussed below.
Effect of various excavation sequences
The main factor investigated in this study was the excavation and support simulation. The actual sequence in Farringdon a top TH-I-B. The TH-B-I was simulated to assess any possible differences with the TH-I-B whereas the TH-B+I was simulated as a less demanding calculation effort. Representative results comparing these three strategies and the commonly used full face one (FF) to the actual results are presented in Figure 5.
As expected, the use of a FF sequence yielded the lowest deformations and significantly lower than the actual ones. The TH-I-B results were closer the observations and slightly higher than the TH-B-I, with additional 2mm vertical and 2 to 3mm transverse displacements. The TH-B+I analyses yielded results in between the TH-I-B and TH-B-I as expected, providing a good compromise due to the significant saving in computational effort.
All these results were with a concrete stiffness of 13 GPa and ko=1.2.
Effect of ko value
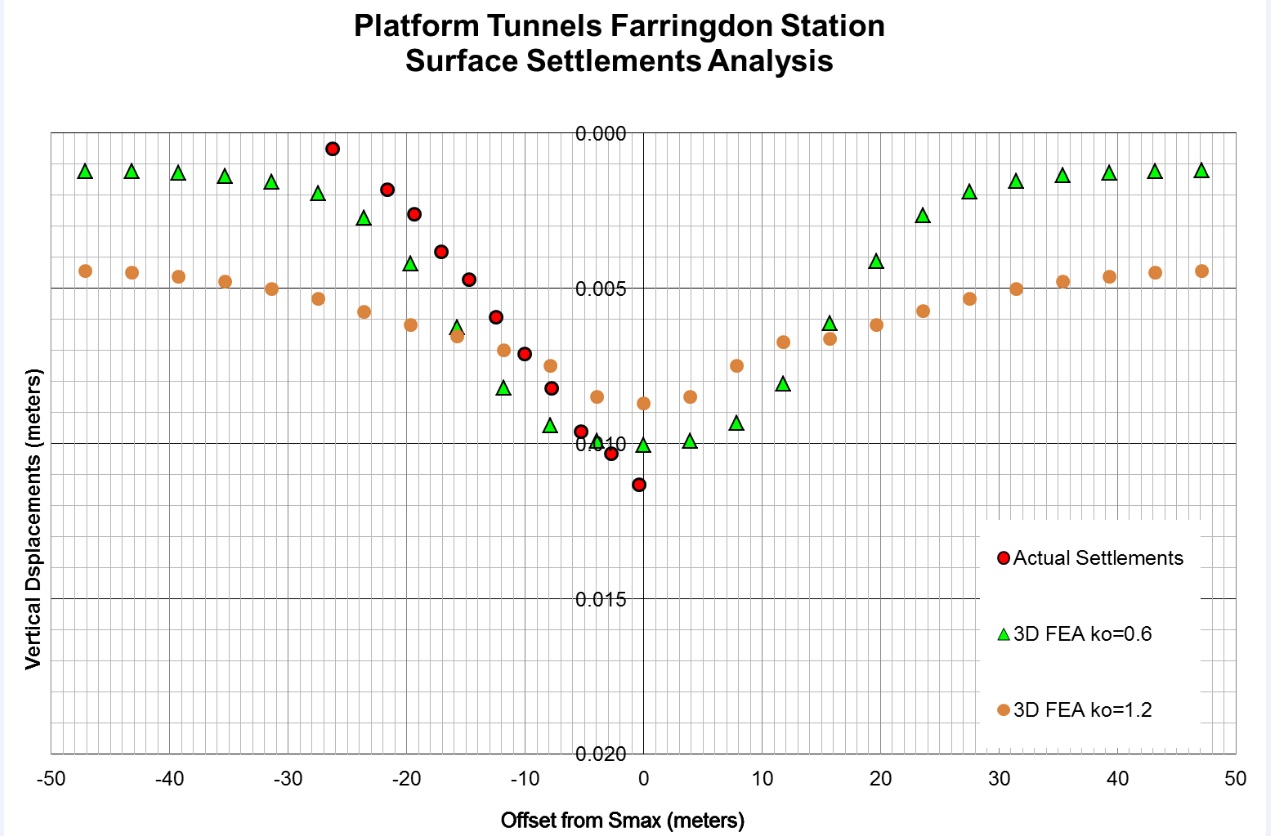
In order to investigate the effect of K0, two scenarios were checked; one adopting a generic design value of 1.2 for all London Clay and Lambeth Group units and an alternative one introducing a reduced K0=0.6 zone in the vicinity of the tunnel excavation according to Figure 6. The use of the design value of 1.2 in the vicinity of the tunnel excavation, overestimated slightly the transverse displacements as compared to the reduced value of 0.6 (similar to the outcomes from [3] and [4]) (see Figure 7). Additionally, the surface settlements induced by the tunnel excavation were plotted in Figure 8 for the two ko strategies and compared to the actual observations. The reduced ko strategy produced significantly improved settlement troughs that were in a better agreement with the obseravtions.
Effect of varied SFR concrete lining stiffness
The effect of various values of the concrete stiffness (Econc) was also investigated. Values of Econc based on laboratory testing and theoretical assumptions (see [5],[6],[7]) ranged from 0.1GPa to 30GPa. A value for Econc of 3GPa was selected as more representative based on the findings from the sensitivity analysis. (see Figure 9). In points M4 and M5 the vertical displacements are slightly underestimated. In the FE model at the footings of the top-heading, the SRF concrete shell and soil element interface is fixed in position and hence does not precisely capture entirely the in-field behaviour. The main difference with the actual behaviour is that in reality, once the primary lining is applied to the top-heading, the footings are resting on disturbed material from the excavation and that may lead to slightly higher displacements being measured at the lowest targets.
Approximately 2/3 of the calculated displacements occured prior to ring closure, with the remaining simulated displacements developing over the length of the modelled tunnel. In the context of this outcome, a strength development technique that allowed the SFR concrete lining stiffness to increase from a low to high value following ring closure was applied to the model. The application of such a technique replicated the tunnel behaviour more realistically allowing maximum deformation of the lining prior to ring closure and full strength gain. The results show close agreement to the field measurements.

Figure 9 – Assessment of varied SFR concrete lining stiffness (E=3GPa, E=13GPa, E increasing from 3 to 13GPa and E increasing from 3 to 30GPa). Additionally, lining stresses generated from the above model also followed the predicted behaviour, which was inadequately replicated when applying one Econc value of 3GPa and therefore underestimated the predicted lining stress (see Figure 10).
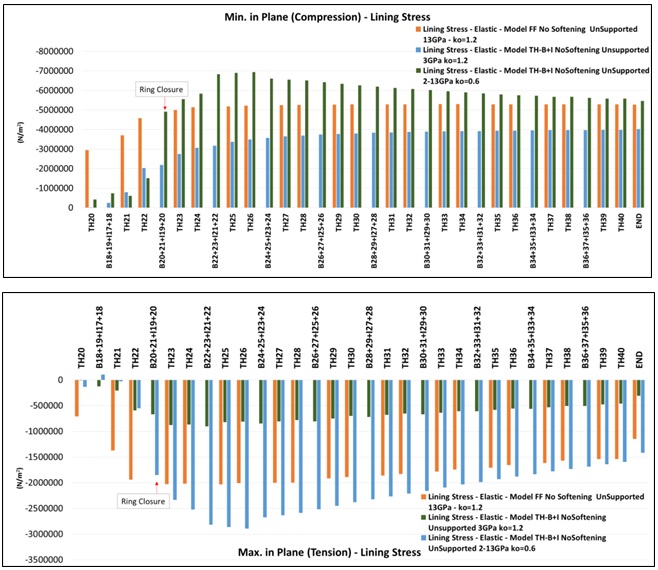
Figure 10 – Stress development of varied SFR concrete lining stiffness. E=3GPa, E=13GPa and E increased from 2 to 13GPa. Conclusions
A comparative assessment of various simulation parameters was performed in an attempt to back analyse the observed in-tunnel displacements in Crossrail Farringdon station platform tunnels. The research included an extensive study on the influence of various soil and SFR concrete parameters. The main conclusions of this research suggest that:
- The adoption of a full face simulation (1m slices) underestimates the in-tunnel displacements.
- The simulation of a top-heading with a combined bench and invert excavation sequence allows for reduced computational efforts and yields adequately satisfactory results.
- The value of K0 = 1.2 that was used in the design slightly overestimated the magnitude of the transverse displacements. A value of K0 = 0.6 in the vicinity of the tunnel excavation produced results closer to the actual field displacements as regards both in-tunnel displacements and surface settlements.
- A lining stiffness value of 3GPa shows very close results of in-tunnel displacements compared with field values, both in the vertical and the transverse direction. However, lining stresses were underestimated when using a low Econc stiffness as expected.
- It is beneficial to apply two values of SFR concrete lining stiffness; one during the initial concrete shell installation and the other higher value after ring closure. Very good results for both in-tunnel displacements and predicted lining stresses were exhibited, however further studies are required to determine the optimal strategy for the implementation of a gradual increase of the concrete stiffness from its “young concrete” value to the “fully strengthened”.
References
[1] Crossrail C435 (2013). Design Statement for Temporary SCL Works. C435-BFK-C4-XST-M123-50001.
[2] Dassault Systemes Simulia 2011. ABAQUS Analysis User’s Manual-V6.12
[3] Gakis, A., Flynn, S. Nasekhian, A. 2014. Back analysis of observed measurements for optimised SCL tunnel design. North American Tunneling: 2014 Proceedings
[4] Gakis, A. 2014. Design of a SCL wraparound tunnel utilising a 3D geological model for Crossrail Farringdon Station. BTS Harding price 2014 finalist paper (see in www.britishtunnelling.org.uk).
[5] John, M., & Mattle, B. (2003). Shotcrete Lining Design: Factors of Influence. Proc. RETC.
[6] Poettler, R. (1990). Time-dependent rock—Shotcrete interaction a numerical shortcut. Computers and geotechnics, 9(3), 149-169.
[7] Wittke, W., Pierau, B., & Erichsen, C. (2006). New Austrian Tunneling Method (NATM)—stability analysis and design. WBI, Essen.
-
Authors
Stephen Flynn MSc, CEng MIEI - Dr Sauer & Partners Ltd
SCL Tunnel Engineer, Crossrail Farringdon Station
Angelos Gakis Dr. Dipl-Ing, MSc DIC, CEng MICE - Dr Sauer & Partners Ltd
Chief Geotechnical Engineer, Crossrail Farringdon Station

