Managing Reliability Growth in Practice
Document
type: Technical Paper
Author:
Richard Consterdine MIMechE MIAM, Brian Halliday, Jonathan King FIET, Trevor Birch FIC CMC, Phil Dubery BSc CEng MIMechE
Publication
Date: 02/12/2021
-
Read the full document
1 Introduction
1.1 Crossrail System of Systems
Crossrail is classified as a System of Systems (SoS) comprising:
- operational independence of component systems;
- managerial independence of component systems;
- geographical distribution;
- emergent behaviour, and;
- evolutionary development processes.
1.2 State of the Art Systems and Technology
Crossrail takes advantage of state-of-art systems technology including complex systems which can deliver high levels of safety, capacity and performance coupled with lower life cycle costs (LCC). Some of the systems and their context is shown in Figure 1.
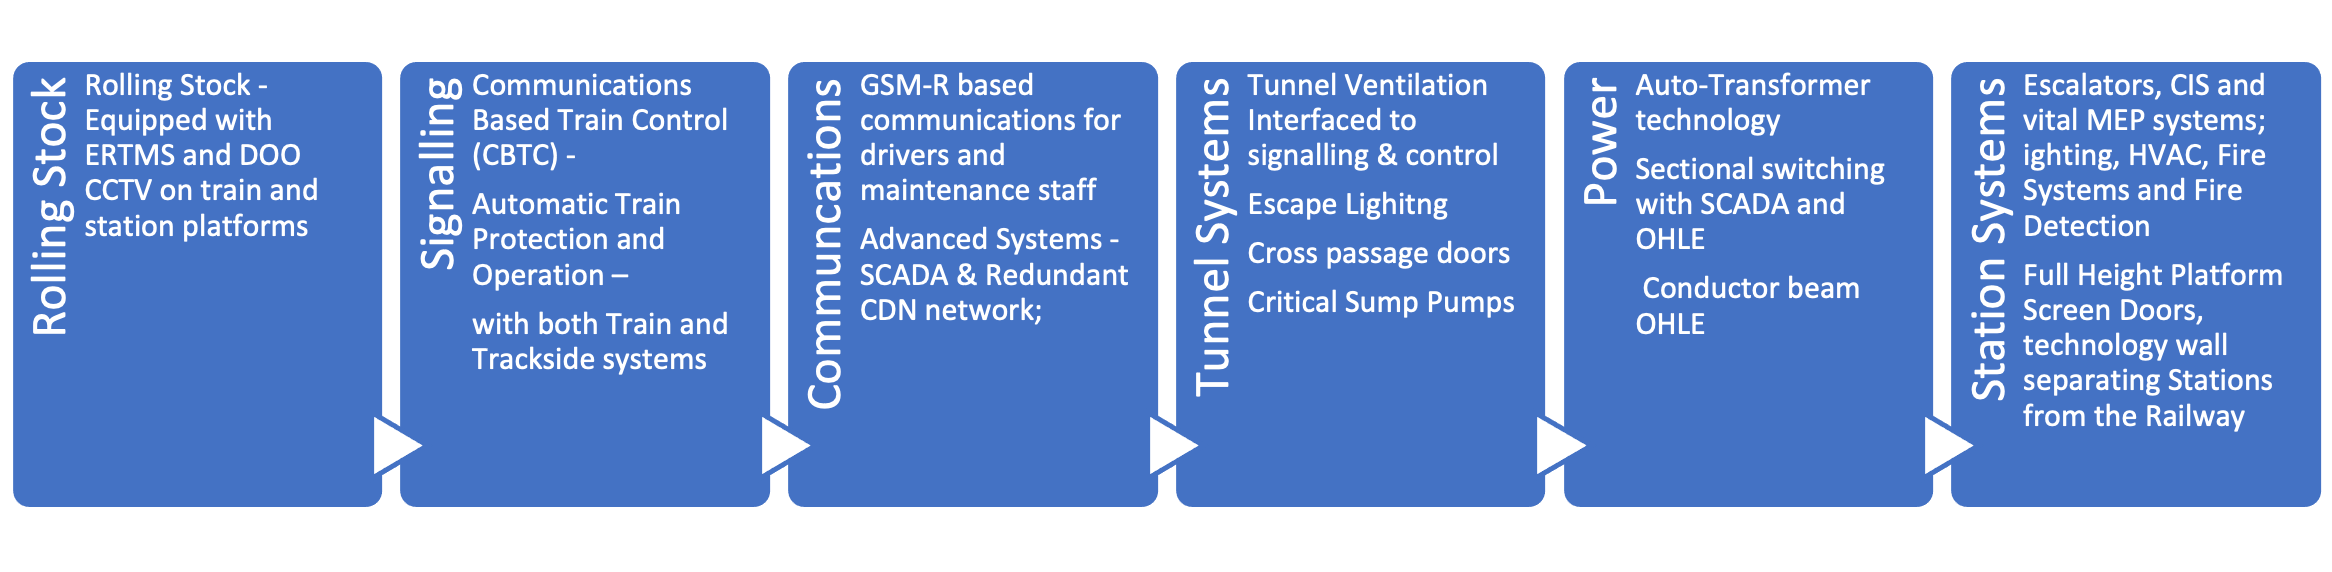
Figure 1. State-of-the-art systems technology
1.3 Complexity
Crossrail has complexity. It is a large programme with multiple projects across many disciplines involving high levels of interfaces and integration. This is typical in railway megaprojects and has to be managed in the approach across the lifecycle, as in Figure 2.
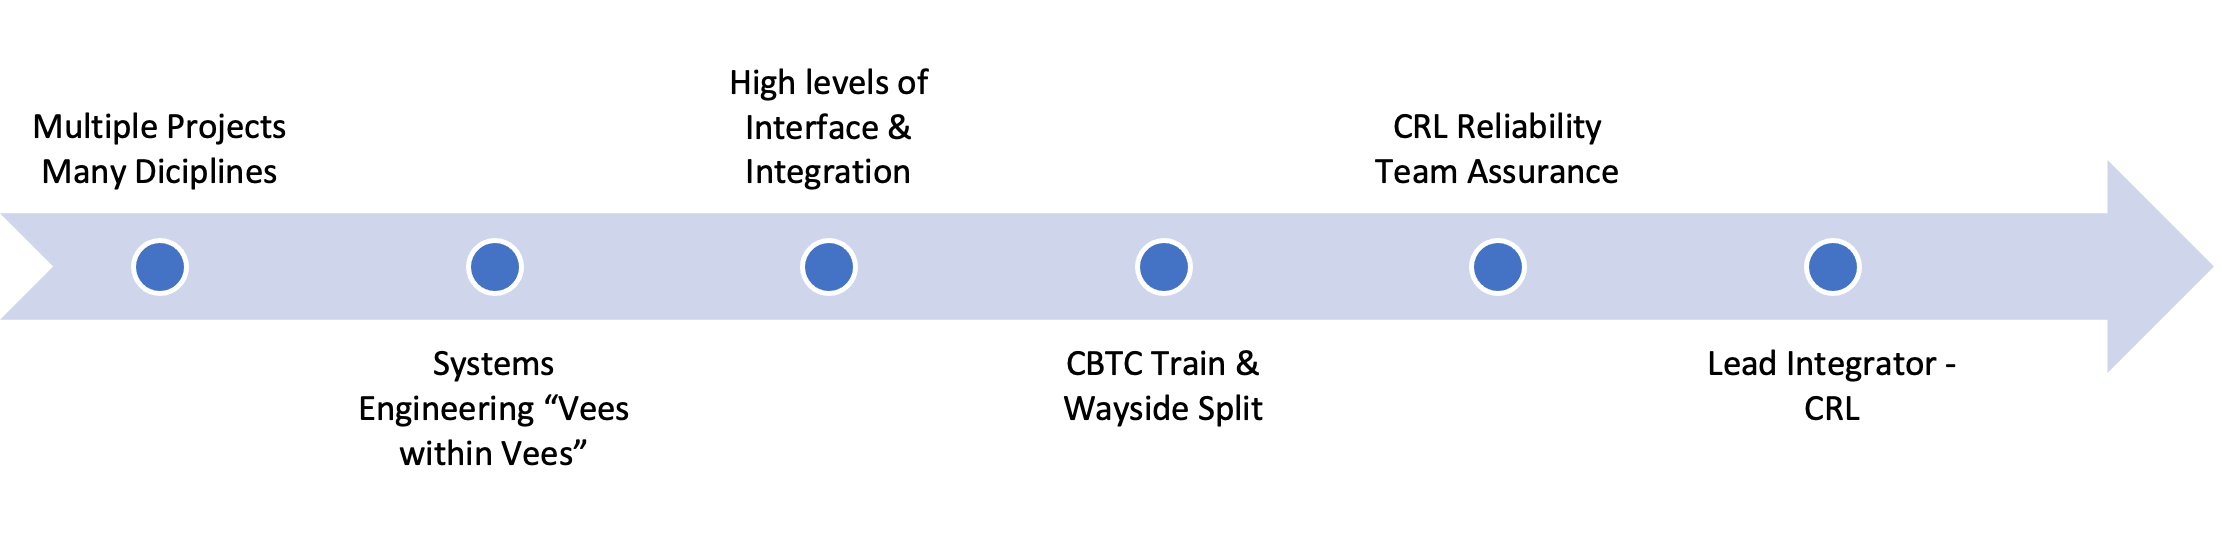
Figure 2. Crossrail Complexity
1.4 RAM Scope and Reliability Integration on Crossrail
RAM scope for the Elizabeth Line (EL) is vast and covers the scope of the whole route including sections east and west of London, on Network Rail and Heathrow Airport infrastructure. Figure 3 shows the geographical area covered, the site locations and railway systems involved. CRL provided RAM assurance for the Central Operating Section (COS). In the COS CRL provides RAM assurance was provided by others e.g., Network Rail (NR), Rail for London Infrastructure (RfLI) and Alstom for assets including Surface works, Rolling Stock and depots, the CRL and RfLI needed to integrate reliability growth activities across the systems, assets and operations to understand the performance of the whole system. This involved ensuring the critical interfaces were reliable e.g., between the train, signalling, transitions, power systems, and platform screen doors.
Figure 3. Crossrail RAM Scope
1.1 Challenges for Reliability Growth on Crossrail
SoS characteristics, state-of-art system technology, complexity and distributed responsibility for scope led to a significant challenge managing and proving Reliability, Availability and Maintainability (RAM). Reliability Growth (RG) formed a major part of RAM, helping verify and validate original predicted or target values and actual values achieved. This informed the project of the current status on the reliability, readiness for entry into the final stages of the programme (Trial Running and Trial Operations) and readiness for Revenue Service. RG and its management played a critical part of the Crossrail programme.
2 Crossrail Reliability Growth Management (RGM)
2.1 Introduction to Reliability Growth Management
RGM is managing and integrating reliability across an organisation at all levels. It has many elements as shown in Figure 4. The key to a successful RGM is building a strong foundation by implementing Reliability Growth Management Strategy (RGMS), benchmarking, reliability monitoring and reporting and setting up specialised and focused working groups. It is a discipline in Systems Engineering (SE) that helps inform and focus the latter stages of projects, providing confidence that performance objectives can be met on completion.
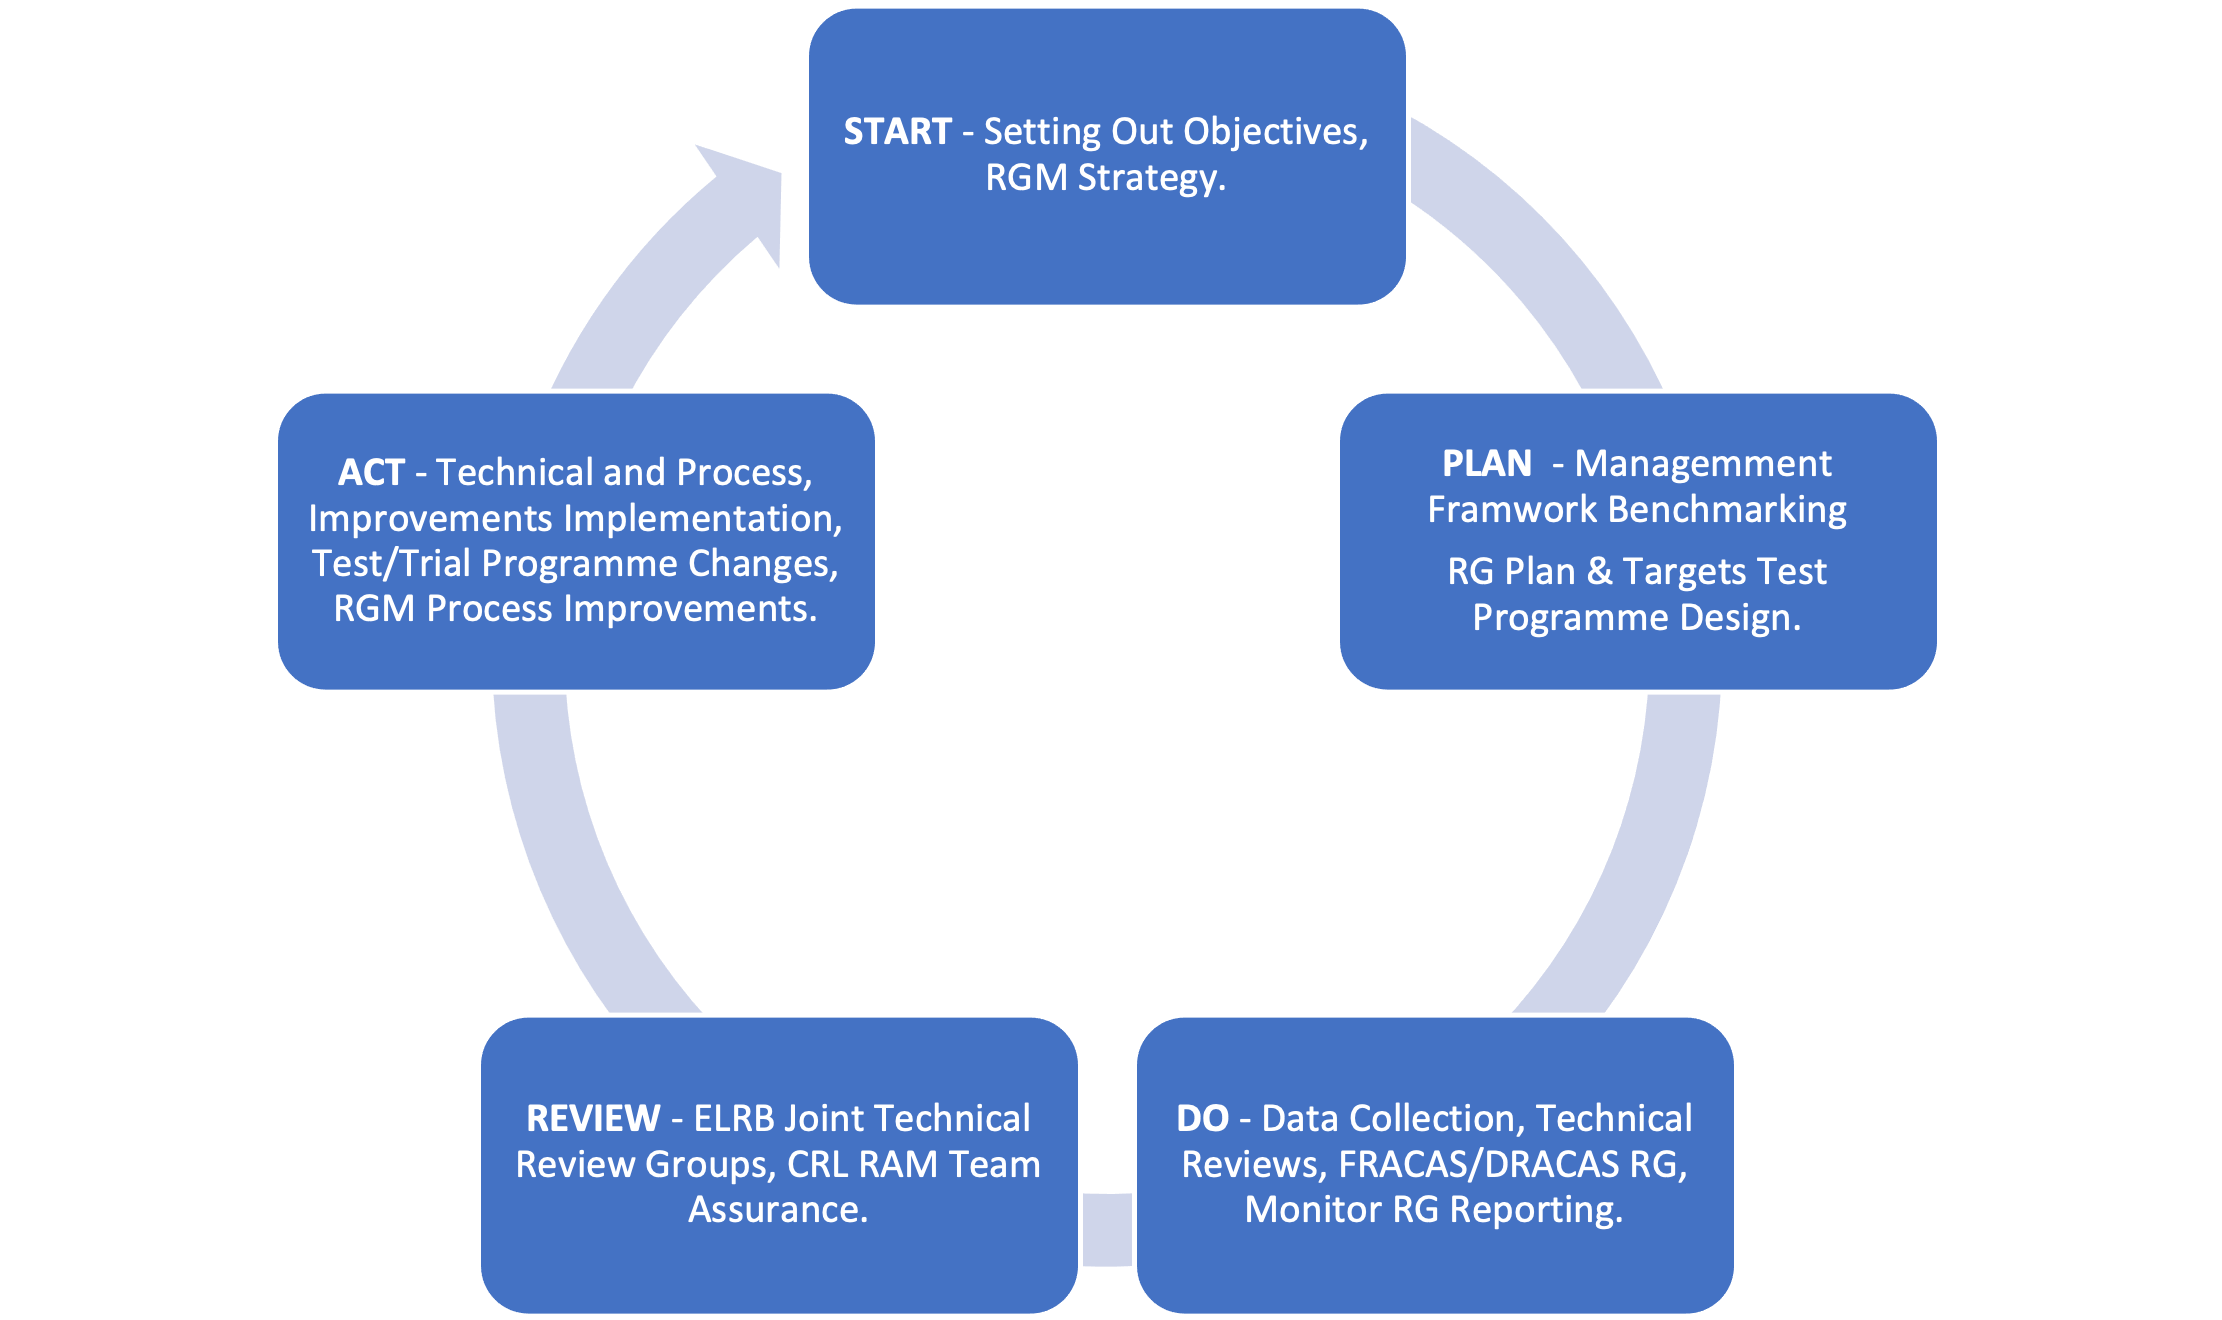
Figure 4. Crossrail Reliability Growth Management Elements
2.2 Reliability Growth Management Strategy (RGMS)
- An RGMS was produced in 2019, promoting current best practice in RGM policies and techniques. The strategy complemented the existing Crossrail (RAM) requirements set out in the works information to the Crossrail suppliers and provided an implementation approach to be used on the Crossrail programme, as the railway moved from initial testing into trials and into passenger service. Key elements of the RGMS included:
3 Organisational Focus on Reliability
3.1 Reliability Management Framework
Effective resolution of technical issues and management of RG by key stakeholders plays a vital role in achieving high levels of reliability in the most timely and cost-efficient way. A strong Reliability Management Framework (RMF) was established early in 2019 in advance of Dynamic Testing (DT) and Systems Integration Dynamic Testing (SIDT). The RMF had to be endorsed by CRL and RfL directors reflecting senior management’s commitment to reliability, ensuring awareness of the importance of reliability issues across all project teams and giving appropriate priority to the resolution of issues against competing programme pressures.
The RMF is illustrated organisationally in Figure 5. The figure illustrates a clear line of sight on reporting on status and issues. Individual project groups carried out RG analysis reporting, which was consolidated and reviewed to provide the main source of input to the most senior level working reliability group e.g., the Elizabeth Line Reliability Board (ELRB).
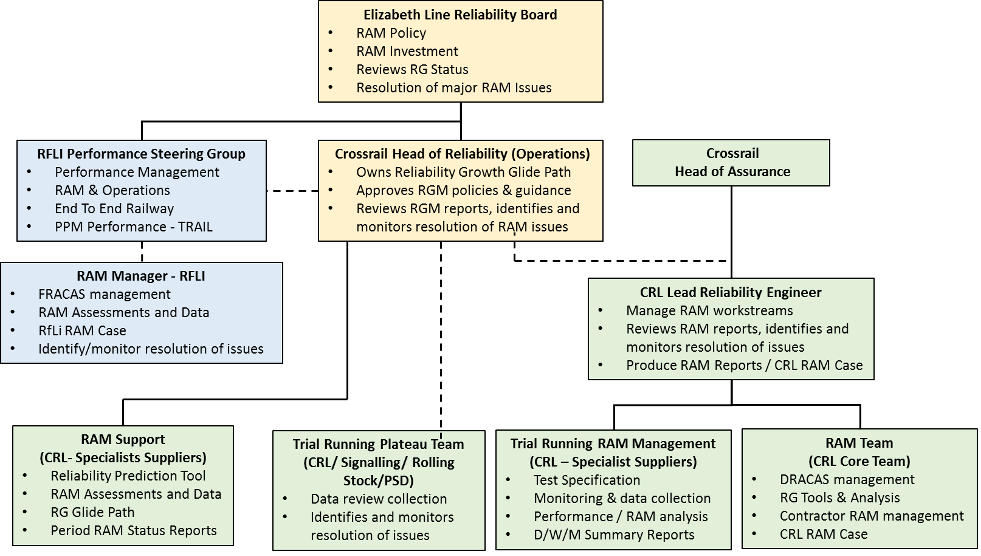
Figure 5. CRL Reliability Management Framework (RMF)
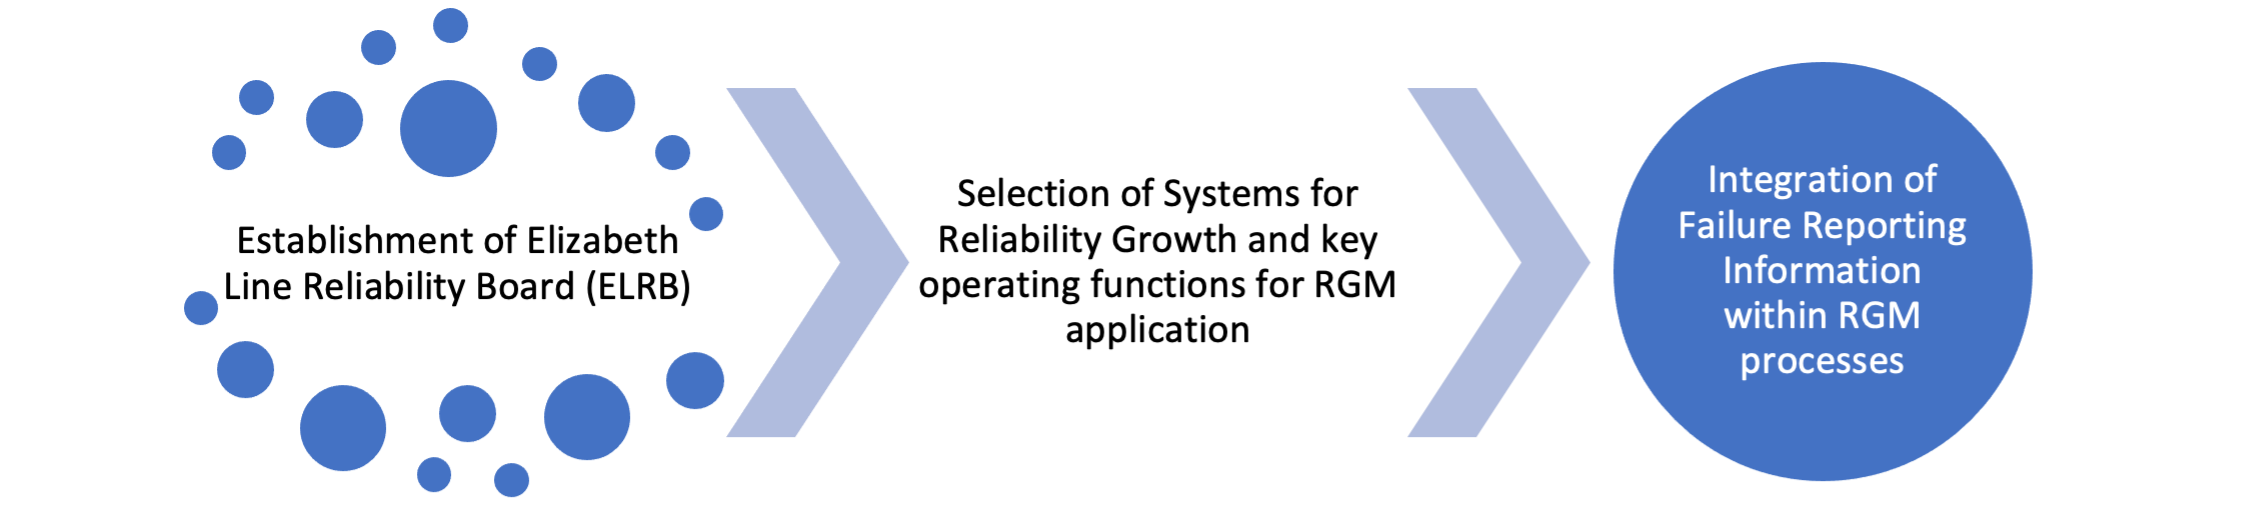
3.2 Elizabeth Line Reliability Board (ELRB)
The Elizabeth Line Reliability Board (ELRB) was established to review the status of the RGM processes. The key terms of reference for the ELRB included;
- Review progress against Sponsor requirements
- Future reliability growth projections
- Identifying issues and opportunities, bringing insight use lessons from other commissioned rail systems
- Directing and advising on risk and risk mitigation
- Report progress on a periodic basis
It was important that the ELRB possessed reliability management, domain competence and appropriate authority to resolve issues and achieve results. The ELRB members and typical agenda of each board meeting is shown below:
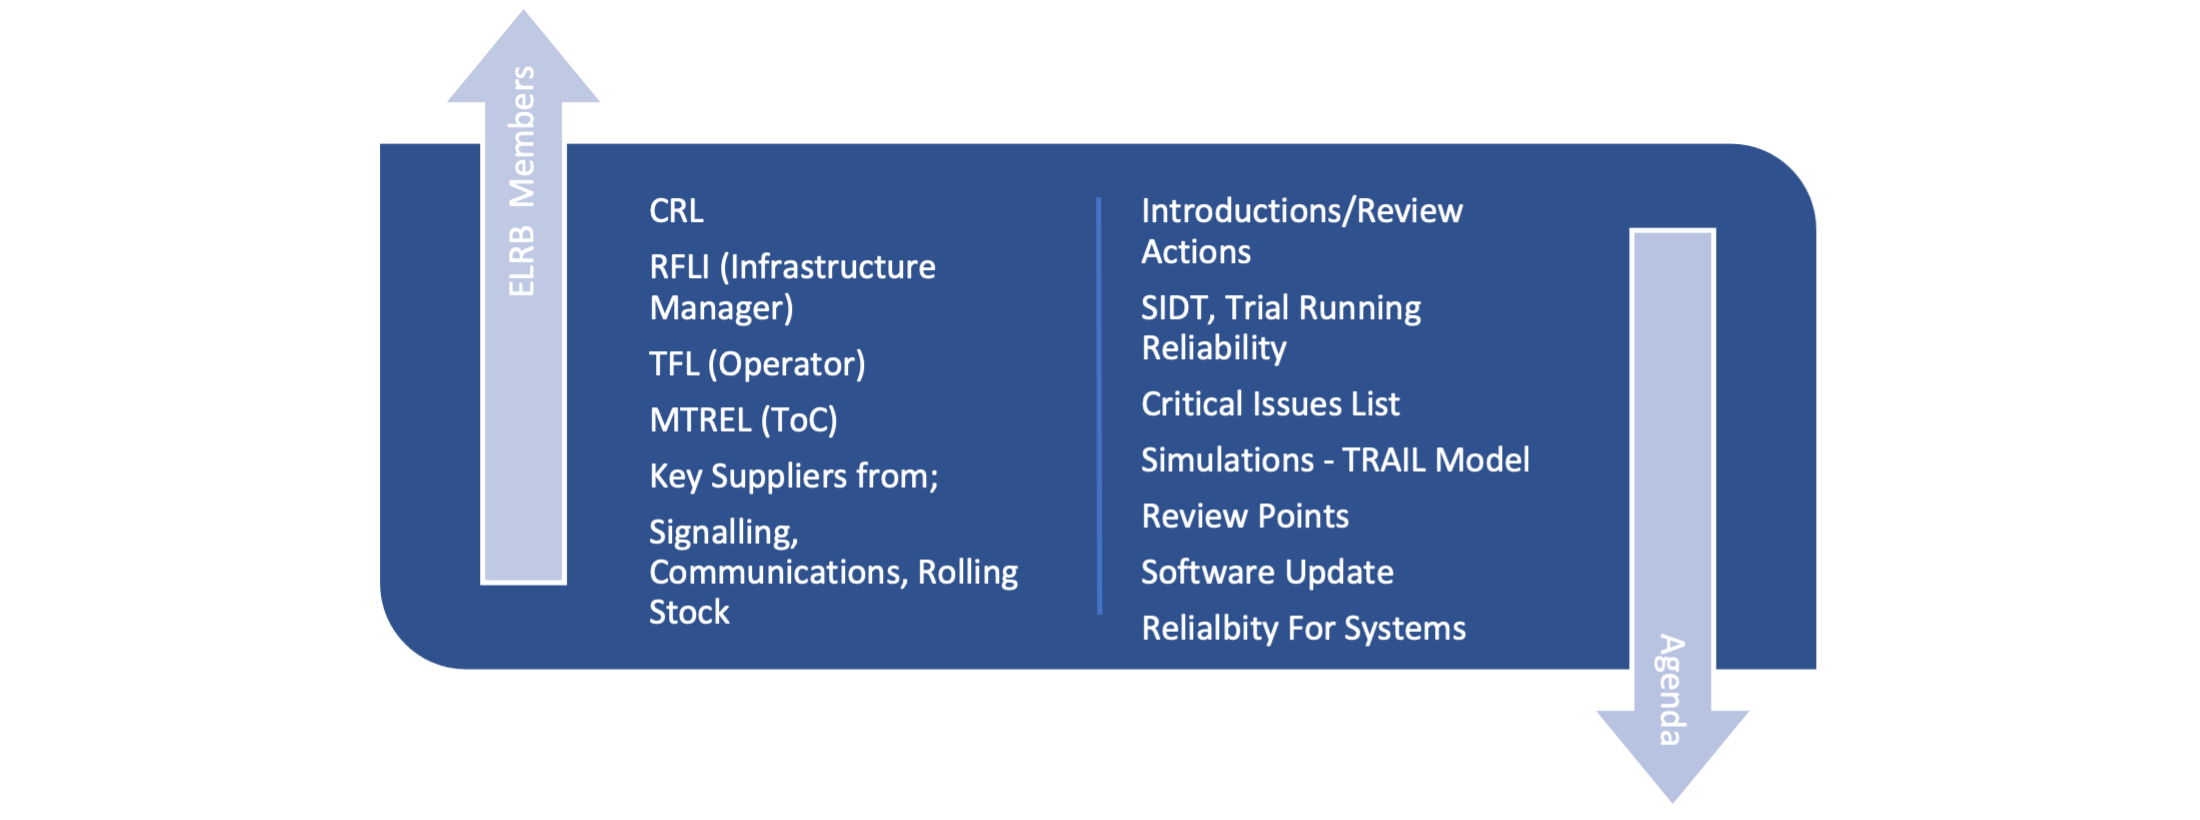
Figure 6. ELRB members and typical agenda
3.3 CRL Reliability Team
During the DT, SIDT and TR, the CRL Reliability team continued to provide supporting RAM management including;
- Management of failure reporting e.g., DRACAS;
- Supplier RAM liaison for assets not handed over under RfLi ROGS control;
- Reliability assessments including periodic RG projections;
- Assurance of RAM deliverables;
- Data Collection from suppliers and project;
- Development of Crossrail RAM Case;
- Management of the ELRB working Group;
- Specialist Support;
- Periodic RG reporting to ELRB;
- Specialist RG tools, e.g., Duane and Reliability Prediction Tool;
- Data Collection from Signalling and Rolling Stock Logs and interpretations e.g., RCC, Trains, Signalling systems.
3.4 Cross-project review groups
A one team approach was needed and the CRL Reliability team provided supporting RAM management services including support to other groups. During intensive test phases, The CRL Reliability Team brought together technical experts, management, operational staff, CRL, suppliers, RfL, MTREL on a regular basis. This was to review and evaluate the previous days testing, agree failure response, and assess operational restrictions required until full functionality is delivered. The Reliability Team worked closely with Systems Integration teams; Plateau 1 addressed train control system interfaces between, Signalling, Rolling Stock, PSD and Tunnel Ventilation Systems and Plateau 2 addressed Stations and communications systems.
3.5 Failure Review Boards
Where issues were not resolved by the above or by working groups and complex issues were apparent Failure Review Boards (FRB) were established. The FRBs were responsible for the detailed day-to-day implementation of an effective DRACAS process, and held to:
- Review failure reports prepared by discipline engineers and suppliers;
- Decide whether more detailed investigation into the cause of particular incident is required and allocate responsibilities for undertaking it;
- Identify and agree corrective actions to modify, design, manufacturing process, software, installation and/or maintenance or operational procedures, so that the occurrence frequency of a specific incident type is reduced;
- Provide a record of decisions taken;
- Decide responsibility and timescale for actions implementation;
- Techniques used included:
- Kepner Tregoe (see Figure 7);
- Route Cause Analysis (RCA),
- Statistical techniques such as Chi Sq.
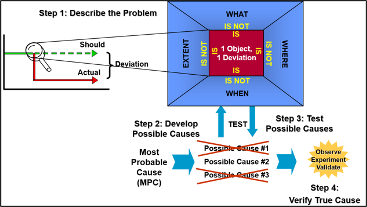
Figure 7. Kepner Tregoe Failure Identification Technique
4 Reliability Growth Planning
4.1 Test Programme Design
RG derives from identification and elimination of system failures and this requires sufficient testing for failure mechanisms to reveal themselves. Higher levels of Mean Time Before Failure (MTBF) require increasing test durations to detect problems and confirm successful removal. Extremely high MTBFs requiring significant test hours to generate failures and may not be practical.
In Dynamic Testing (the programme phase before Trial Running), the prime consideration of the test programme was to verify system performance and functions against contracted specifications and Crossrail functional requirements. By their nature, these tests can be stop-start, may designed to trigger failure conditions or marginal use cases and will often be disruptive as evidence collected or scenarios repeated. Management of Reliability Growth required an different focus, through an integrated approach focused on performance and reliability. To achieve this a series of Operational Simulation Tests (OSTs) were devised and additional sub-phase of testing introduced (System Integrated Dynamic Testing (SIDT). OST ran the system in a test environment with the purpose not to prove a function but to collect data on any ‘naturally’ occurring failures. SIDT was run with a similar purpose but against a specific timetable and with more trains. The use of a timetable enabled quantification of delay and prioritisation of faults against an assessment of potential Service Affecting Failures (SAFs). Both OST and SIDT generated increased levels of train operating miles through the Central Operating Section (COS) and became an important input to the planned reliability growth strategy (as shown in Figure 8). They generated sufficient mileage to discover service impacting problems and assess both service impact and MTBF. Running them within Dynamic Testing gave more time for fix cycle and to address important issues ahead of Trial Running.
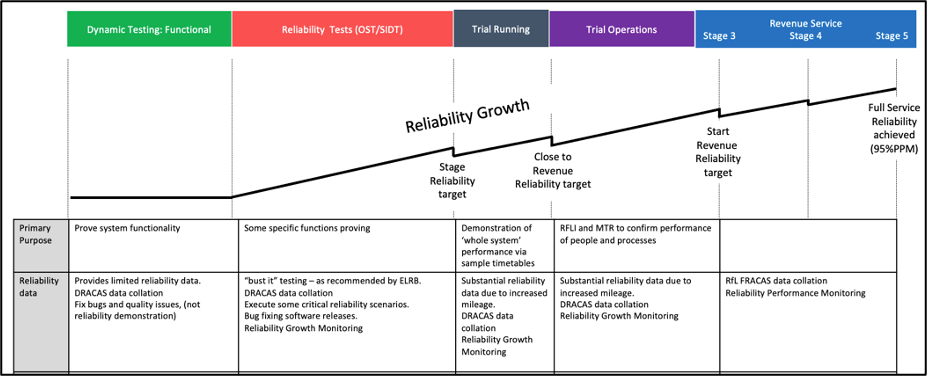
Figure 8. Reliability Growth Stages
4.2 Reliability Growth Models and Plan Concepts
For selected systems Reliability Growth Plans (RGP) were developed. These documents proposed the feasibly of a system achieving a RAM target within a testing environment with a set of assumptions about the rate of improvements needed (known as the growth slope). The growth plans were used to review projected interim targets and to assess the probability of required reliability being achieved by the start of revenue service. They also assist in identifying potential areas where a change in the testing strategy will enhance reliability growth thereby reducing programme delivery risk.
4.2.1 Duane Growth Model
A number of methods have been developed for monitoring reliability growth. However, one of the most widely used across various industries, is the Duane growth model. The method is based on the observation made by James T. Duane that failure rate data plotted against cumulative operating time on a log-log graph is a straight line. NR has adopted the Duane model for monitoring RG of a wide range of asset types as illustrated in the monthly National Infrastructure Reliability Group (NIRG) Report and the Railway Reliability Data Handbook (RRDH). This experience confirms that this model is appropriate for railway infrastructure assets, in a stable environment.
4.2.2 Extrapolated Growth Model
Since reliability growth essentially stems from the successful elimination of observed failure mechanisms, reliability projections of systems are made based on an assessment of each failure mode and the extent to which they will be eliminated from future system operation. This involves assessing the likely realistic impact and efficacy of corrective actions taken against each observed failure mode. This is referred to as ‘Fix Effectiveness’ and typically relies on sound engineering judgement. For instance, if a failure mode was considered to be totally eliminated, then the corrected action efficiency would be regarded as 100% and the failure mode would not be considered in assessing future reliability. Conversely, if no corrective were taken then the corrective action efficiency would be regarded as 0% and the future rate of occurrence would be assessed to remain unchanged. Confidence in software improvements is given fix effectiveness of 70-90%. The approach is referred to as extrapolated reliability and is also part of EN 61014, referenced in the BS EN 50126 the Railway RAM standard applied on Crossrail and many other UK railway projects. It is particularly relevant where systems are undergoing step changes with a number of fixes bundled together – such as software releases in the latter stages of systems being introduced to service.
4.3 Benchmarking
RG benchmarking was carried out using project data from Jubilee Line CBTC and Northern Line Rolling Stock as illustrated in Figure 9. These examples of complex projects highlighted an initial period of low/zero reliability growth (‘region of non-conformity’) where project emphasis was on functional proving. This was followed by strong reliability growth of around 0.4 when the emphasis and supporting practices focussed on reliability.
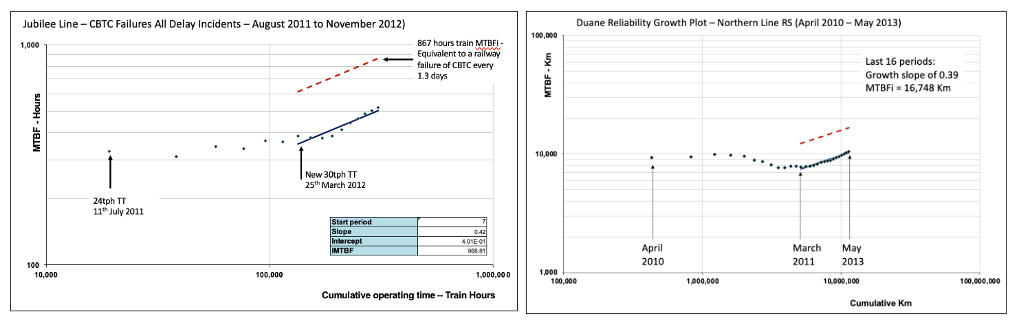
Figure 9. Reliability Growth Benchmarking Data
4.4 Candidate Selection for RGM
Candidate systems for the application of a RGM processes were selected based on a number of factors including:
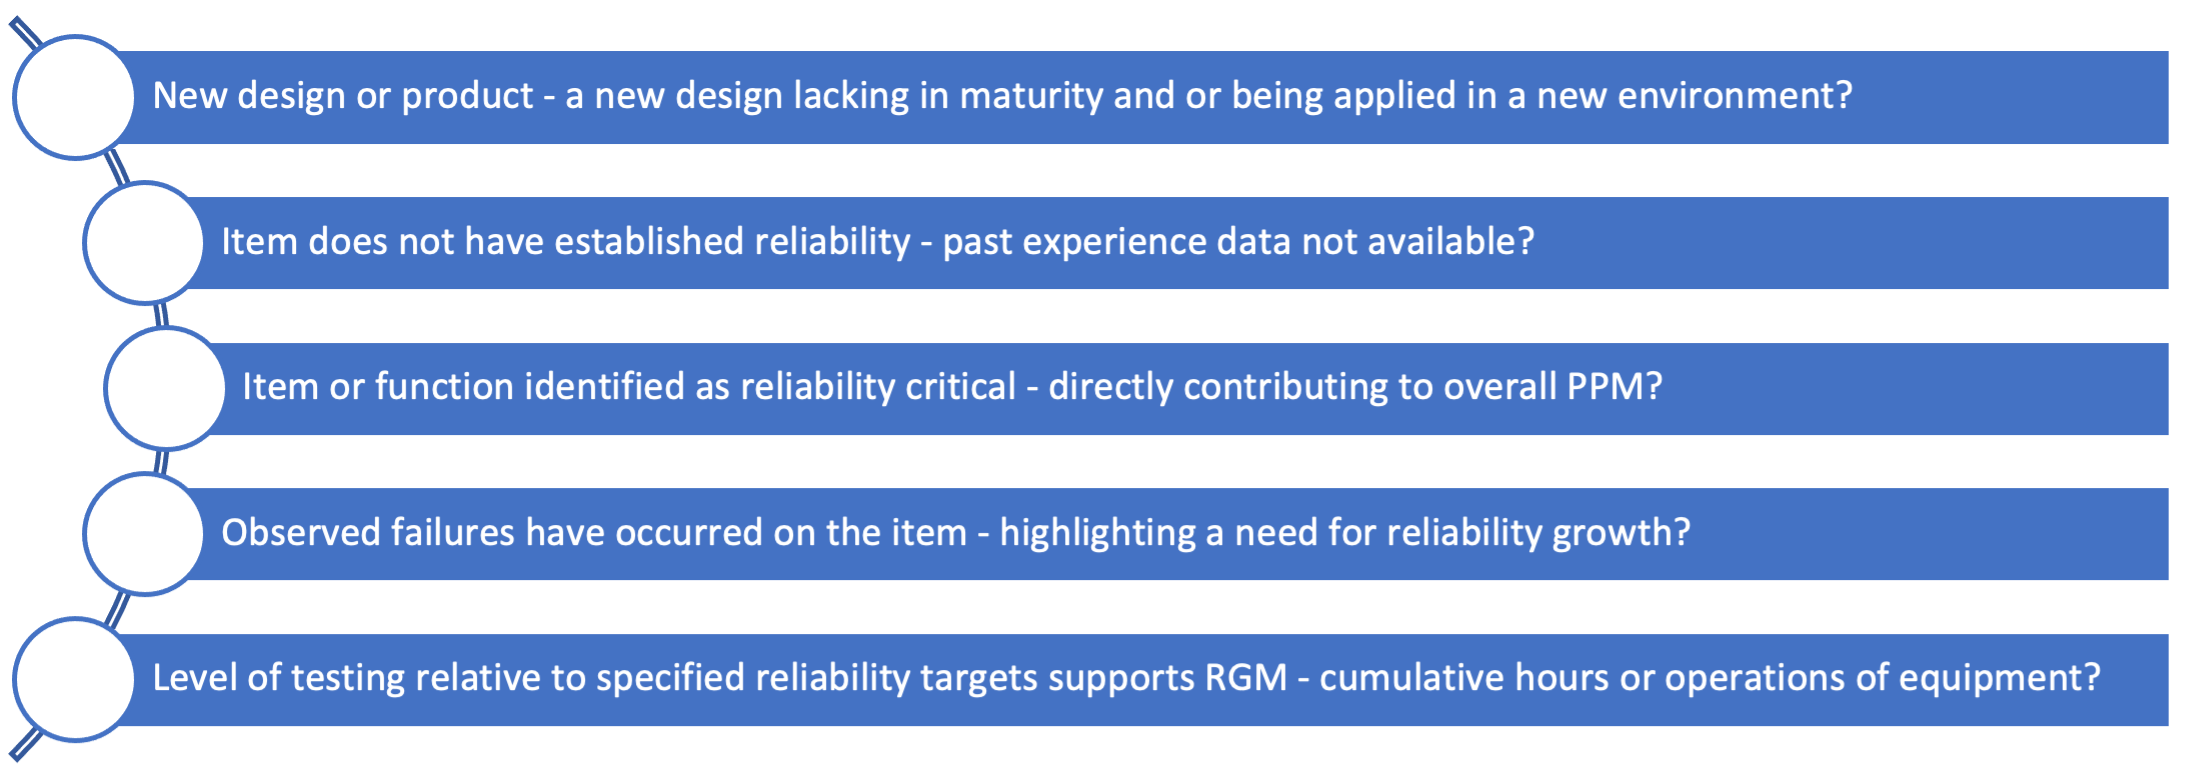
Using these criteria systems and functions were selected for RGM, such as CBTC, PSDs, Points, Communications and Tunnel Ventilation with an emphasis on the potential impact to overall performance (PPM) of the railway. This assessment was done using RfL’s TRAIL model (Transport, Reliability, Availability and Integrated Logistics).
5 Data Collection
5.1 Data Collection in Testing
During Dynamic Testing (DT) the emphasis was on functional proving with observed events managed through the CRL DRACAS. OST and SIDT provided whole-system test involving multiple trains (4 TPH ramping up to 8 TPH) with significantly increased system mileage. The CRL reliability team led OST/SIDT to capture performance data, prioritise failures (working with Systems Integration), and inform ELRB. The primary focus was on those systems with greatest influence on railway performance – signalling, rolling stock and PSDs and the Tunnel Ventilation System.
‘Business as usual’ systems to measure system performance had not been commissioned during Dynamic Testing so processes were set up to track service performance, measure delay minutes, capture detail of any service affecting events analyse data to collate data over multiple days and produce management information in the form most frequent events, and greatest service impact. Working with the wider programme, details for fixes were developed (including expected software releases) and this detail was input to TRAIL model to provide projections of expected operational performance over time. Much of this analysis relied upon collection of data from system and train logs.,. A tool was developed to speed up log analysis, so that potentially suspicious entries could be picked up more easily.
SIDT ran from January 2021 onwards and was also used to give operational experience to staff. As the RCC (control centre) staff (CRL/MTREL/RfLi) got used to running SIDT, improved fault handling and mitigation resulted in improved performance. further improving the value of SIDT to train staff and replicate service running more accurately. These processes continued in Trial Running. The CRL reliability team led the system proving by:
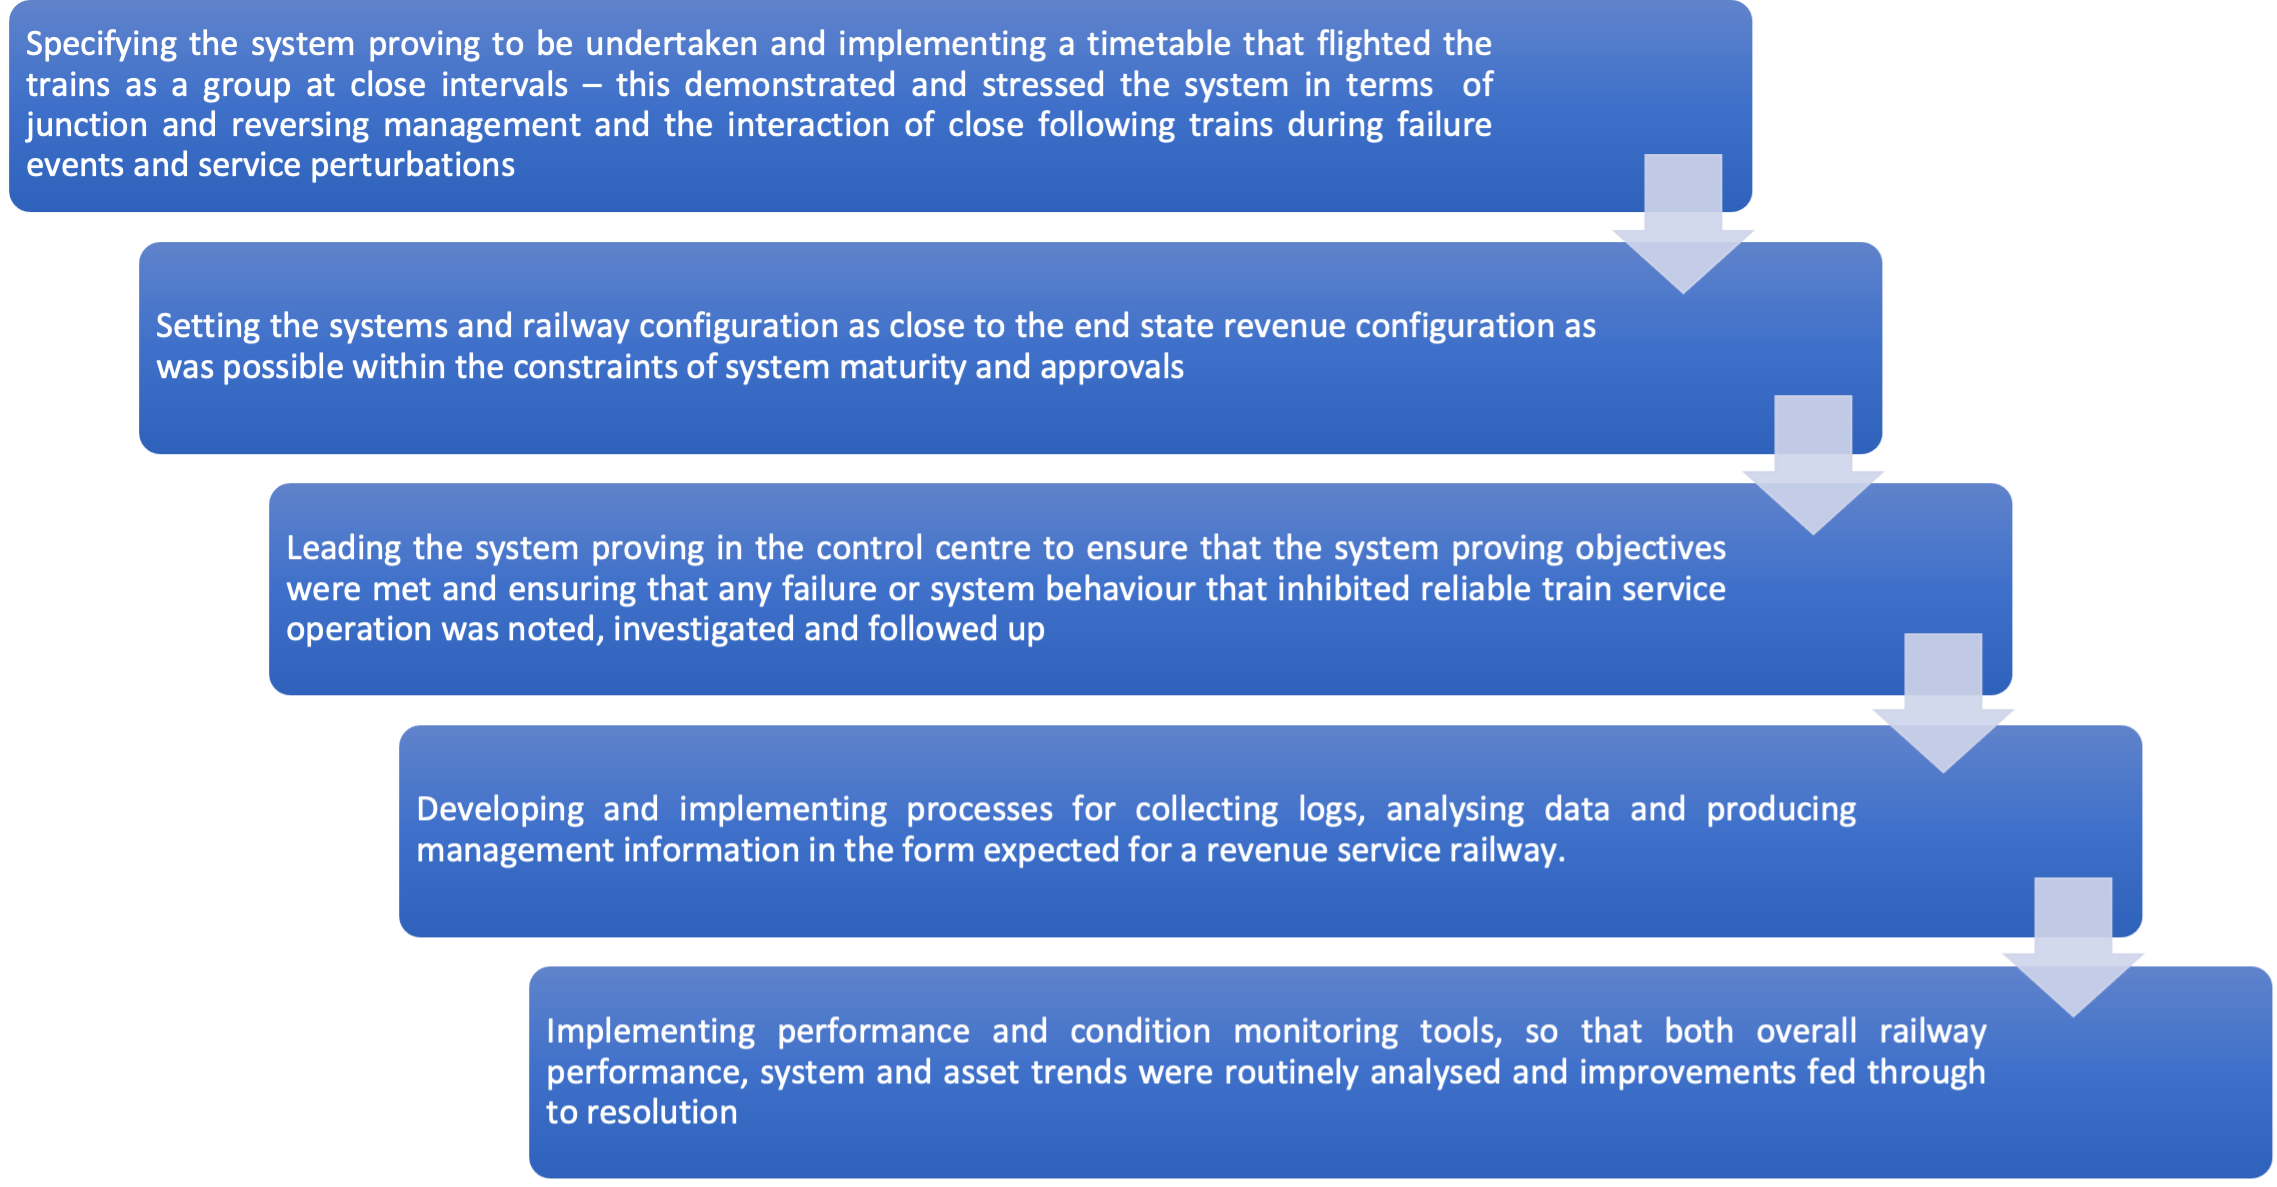
As the RCC staff (CRL/MTREL/RfLI) got used to running SIDT, these lessons on improved fault handling and mitigation resulted in improved performance. SIDT from January 2021 onwards had MTREL staff in the RCC, further improving the value of SIDT to train staff and replicate service running more accurately. These processes continued in Trial Running. As a direct result of System Proving, improvements were identified and progressed to run times, routing, systems and assets that were essential to facilitate successful entry to revenue service.
5.2 DRACAS and FRACAS
A well planned and implemented Data Reporting and Corrective Action System (DRACAS) is fundamental to the achievement of the reliability growth meeting reliability requirements. This was dependent on the delivery of an effective DRACAS processes:
- Commitment of CRL senior management team to DRACAS;
- Allocation of CRL resources to co-ordinate and manage DRACAS;
- Engagement of project staff, management and technical, both by CRL and suppliers to report defects and support their investigations;
- Emphasis on rigorous Root Cause Analysis (RCA);
- Validation of corrective actions ensuring they are implemented as soon as practical;
A Crossrail DRACAS procedure detailed procedures for reporting of failures and ensuring corrective action is implemented. During OST, SIDT, TR and TO testing stages there was a progressive transfer of responsibility of DRACAS from CRL to RFL.
- For systems and assets not handed over, CRL continued the DRACAS process;
- For systems and assets handed over, RFL implemented a FRACAS process and managed the reporting, documentation, investigation and resolution, with CRL supporting as required.
- For Class 345 trains Alstom reported on reliability and resolution of reliability issues using their existing processes.
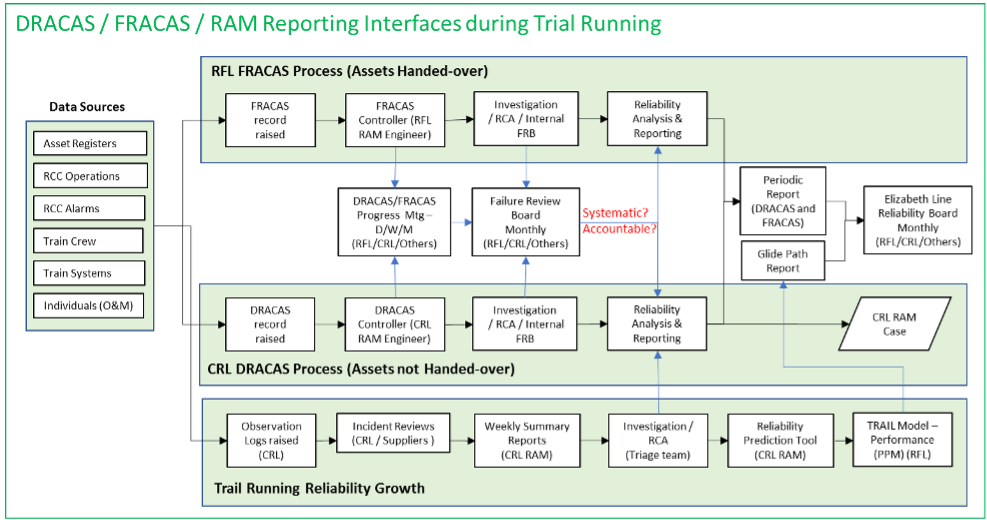
Figure 10. DRACAS/FRACAS and RAM Reporting Interfaces
To provide integration between CRL and RFL processes, RFL established FRACAS meetings. CRL supported this process and enabled agreement on reliability attribution as a basis for reliability assessment. The aim was to ensure consistent reliability reporting against requirements. The co-ordination between CRL and RFL systems is illustrated in Figure 9 showing the complexity of the whole process.
5.3 Root Cause Analysis
Failure Review Boards (FRB) determined when more detailed investigation into the cause of particular issues was required and allocate responsibilities for undertaking it. Root Cause Analysis (RCA) was performed to identify the lowest basic condition that is the direct cause of failure. RCA will be appropriate to the issue being addressed and included techniques such as:
- Data analysis using information from the DRACAS Database and/or Maintenance Records;
- Physical testing and detailed ‘laboratory’ examination of faulty items;
- Problem analysis techniques such as Fishbone Diagrams, Failure Mode Effect and Criticality Analysis (FMECA), Fault Tree Analysis (FTA) and Kepner Tregoe problem analysis;
- Verification activity performed to confirm that the true root cause has been identified.
6 Operating Daily Performance in Testing Phase
6.1 Reliability Daily Reports and Follow Up
6.1.1 Consolidated Daily Reliability Report Front Sheet
The following day after systems proving, a daily report was produced highlighting key issues from the previous day. This was run through with operators and suppliers at an 08:30 call over to ensure all key issues had been accurately captured and for clarity on actions for follow up and close out. In addition, an overall performance report of the main success measures was tabulated with planned and actual service operations, e.g., mileage, trains, trips. Additionally service incidents >1min and >3min. PPM, real time of observed MTBSAF and other metrics were shown consolidated in Figure 11.
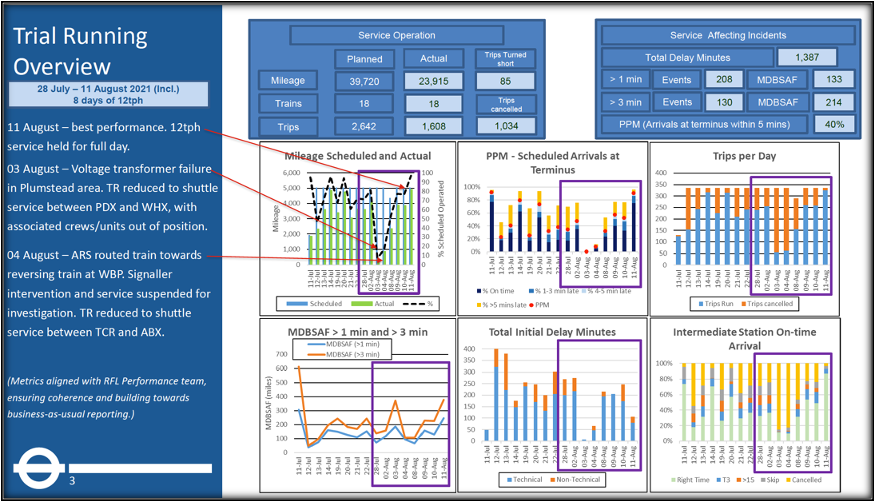
Figure 11. Daily Report Front Cover
6.1.2 Breakdown and Follow up of Events
In addition to the daily follow up sessions, an overall database of events was maintained. This was used to ensure follow up of individual events and also to maintain a prioritized overall breakdown of the events, shown by the delay minutes with the cumulative number of events by type is (Figure 12). The type of the events was individually categorised by their cause and proved very powerful in keeping the improvement process focused on those areas that it was most essential to address to successfully bring the Elizabeth Line into service.
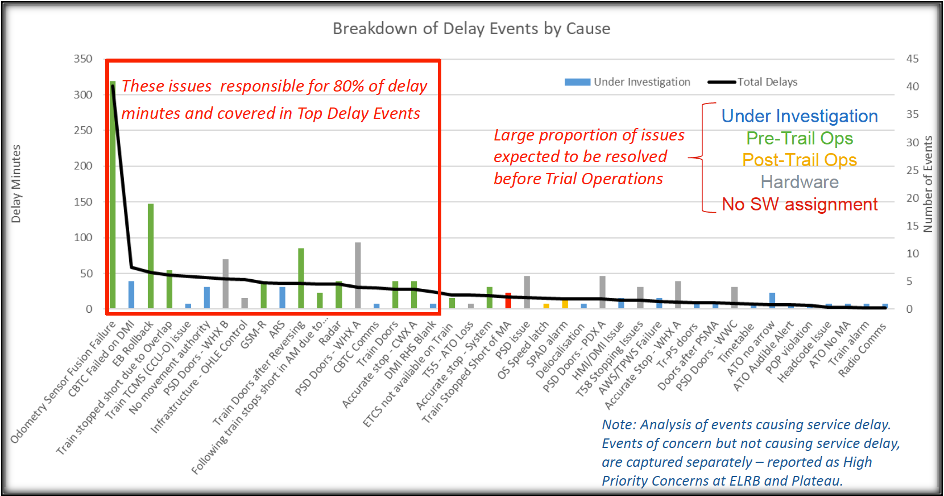
Figure 12. Breakdown of Events by Cause
6.1.3 ELRB Critical Issues List
Not all issues generate service affecting delays. Some impact the operation of the service and affect reliability in other ways. A list of ‘critical issues’ has been created focusing on those issues with operational/reliability impact (not all programme issues). This combines results from OST, SIDT and other sources to create a “single source of the truth” used by different groups. The list is prioritized based on potential impact to TR, TO and Revenue Service based on the criteria as shown in Figure 13 with typical results in Figure 14.
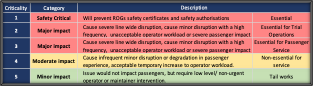
Figure 13. Criticality for Single Critical Issues List
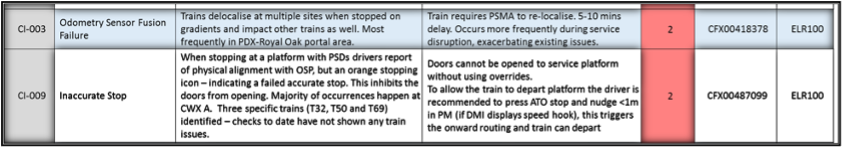
Figure 14. Example of Single Critical Issues List
6.2 CRL Period Reports
Periodic CRL Reliability reports are generated covering four weeks of operation. These reports combined evidence of performance for both handed over assets (RfLI responsibility), and non-handed over assets (CRL responsibility). As part of the overall readiness it is necessary to establish the reliability baseline of the operating railway by way of testing the railway systems when operating as an integrated whole. The reports contained some of these evidences and the process is shown in Figure 15.
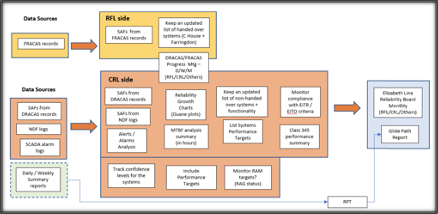
Figure 15. Reliability Period Report Data Flow Process
Rolling Stock has been operational in revenue service in the east and west (GEML and GWML) whilst Dynamic Testing and Trial Running have been ongoing. The reliability performance of train operations in revenue service is reported by the rolling stock provider via RfLI using Business As Usual (BAU) systems including records of train delays, faults and fault attribution. The reliability performance of the other systems is determined by way of recording equipment failures and analysing these to determine the impact of those failures on the reliability performance. A number of sources of failures is available during TR;
- Daily RCC logs, RCC and Routeway Faults Log – which provide the majority of the data for the information shown in sections 6.1.1. and 6.1.2
- RfLI Fault Recording and Corrective Action System (FRACAS) for handed over assets
- CRL Defect Recording and Corrective Action System (DRACAS) for non-handed over assets
The last two data sources provide performance information on station, shaft and portal equipment, which has a less impact on train running. These sources are reviewed on a period-by-period basis to identify the totality of faults reported in a given period. These can then be assessed to determine their impact on reliability performance.
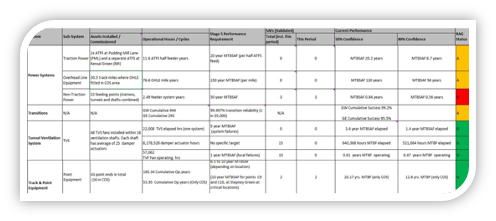
Figure 16. Typical Period Report Performance Summary
6.3 Suppliers Reliability Growth
Before handover of an asset, each supplier provided a statistical analysis of their systems and its operation for RG purposes. Operational hours run or frequency of operations were provided depending on the systems and data available. The operational hours were limited on systems as they were completed at different stages of the project. CRL developed RAM Case guidelines for the suppliers to maintain consistency across the programme.
The SSP had a variety of back of house MEP systems but have less influence on overall system performance but analysis was required for assurance purposes. As statistical RG analysis requires multiple failures on the same systems for accurate confidence CRL selected a confidence level approach using Chi-square technique. Test times from commissioning were collected and showing 50% and 80% confidence levels were utilized with any failures recorded on the CRL DRACAS system. Depending on quantity of evidence, confidence levels attainable were varied. Figure 17 shows an example on MEP systems with RAM targets for elapsed time from final testing, operation duty and calculation the actual confidence levels @50% and 80% in achieving the desired MTBF.
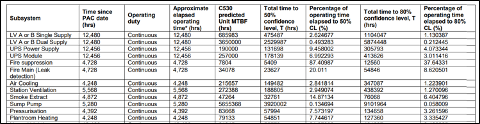
Figure 17. SSP Supplier Confidence Levels
Due to some systems having low operational hrs and high MTBF targets, high confidence levels were difficult to prove before handover. However as installed components selected were mainly COTS which also went through a Materials Compliance Review process (MCR), this offered some assurance that products were quality and could offer good level reliability if installed and commissioned successfully.
Railway systems did provide a similar approach. However, as system characteristics were different more operational data could be sort on the assets depending on the system and used for confidence level proving for reliability. Cumulative type approaches were taken on identical assets improving confidence levels thus allowing higher levels of achieved MTBF to be presented. This can be seen in Figure 18. This was also critical on some systems as progressive assurance was needed due a staged handover process.
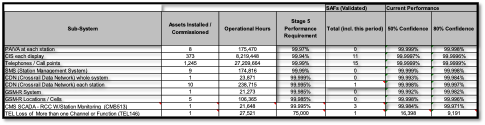 Figure 18. Railway Systems Suppliers Confidence Levels
Figure 19 shows examples suppliers DRACAS summary for failure types (e.g., construction, functional) and where the failures occurred (e.g., track slab or rail). This was crucial during suppliers assurance to show that they reviewed failures adequately which would then help form arguments on failure types in reliably growth purposes.
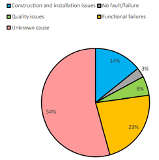
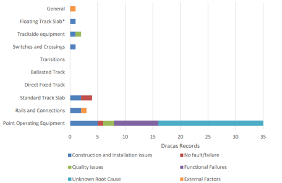
Figure 19. DRACAS Failure Breakdown
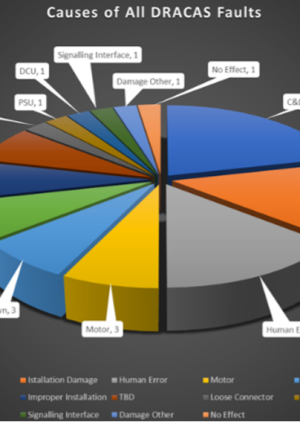
Additionally suppliers had to differentiate between relevant and non-relevant failures, which is crucial for any RG, as only relevant failures are required for RG statistical analysis. The definitions are described below, with an example shown in Figure 20;
- Relevant Failure is a malfunction that prevents the equipment from performing its designated function, or fails to meet its performance criteria, when used and operated under the environmental and operational conditions stated in the specifications.
- Non-Relevant Failure is a malfunction caused by a condition external to the equipment under test, which is neither a functional, environmental, nor a test requirement in this specification and is not expected to be encountered during normal and correct operation of the equipment in revenue service.
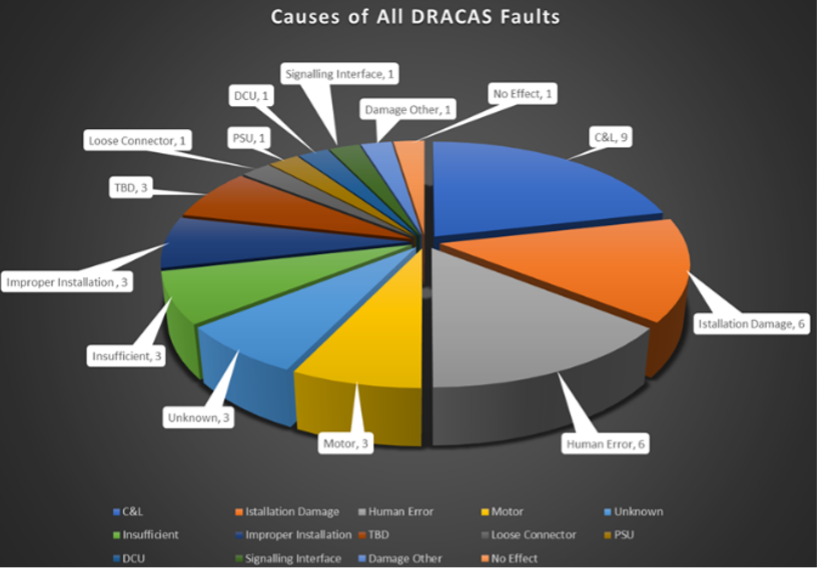
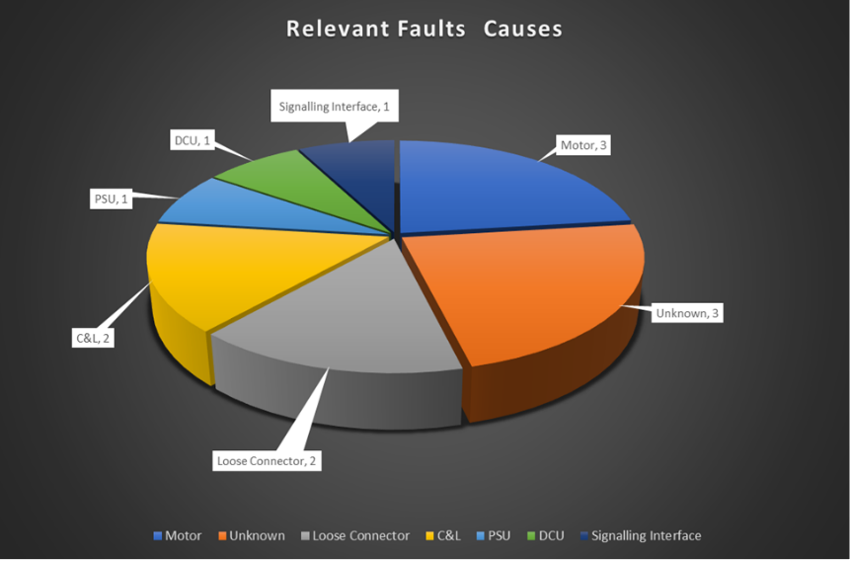
Figure 20. Causes of Faults – All Failures and Relevant Failures
6.4 Crossrail RAM Final Assurance
To consolidate reliability evidence and complete a system RAM argument, CRL provided an overall RAM Case. The case included RG and is a depository to record and structure the evidence, analysis, and arguments for assurance, providing confidence that the integrated railway system met sponsors RAM requirements. Assurance of RAM was achieved through verifying and validating suppliers’ information. The argument process is shown in Figure 21, which shows the road map to the RAM case illustrating evidences required during the final stages of RAM assurance, e.g., Suppliers RAM Demonstration Cases and performance monitoring, Periodic Reporting and RG.
Figure 21. RAM Case – Building the Argument of Complianc
7 Reliability Growth Analysis and Simulation
7.1 Duane Model
Reliability growth plots were provided as part of periodic reporting. As an example, CBTC Duane RG plots is shown in Figure 22.
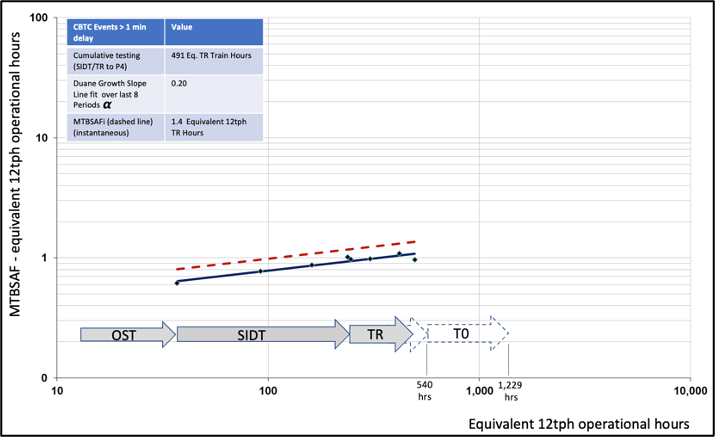
Figure 22. Duane CBTC Reliability Growth Plot
The plot shows CBTC related Service Affecting Failures (SAFs) and is plotted against equivalent 12tph operational hours. In the plot the solid line shows cumulative MTBSAF plotted against cumulative time (equivalent 12tph hrs) with the instantaneous MTBSAF is shown as the dotted line. The data points represent updates following each four-weekly period.
The Duane growth model had limitations during Dynamic Testing and Trial Running as systems were still being commissioned and were not stable. In the example above, the observed Duane growth slope of 0.20 would generally be considered to indicate a poor rate of reliability improvement but reflects the ongoing proving of the system during Dynamic Testing and Trial Running. Original growth plans assumed a higher growth rate of 0.4 where there would be a strong focus on progressive introduction of improvements to eliminate systematic failures. Since the failures are almost entirely software related, fixes have required lengthy validation and are being collectively introduced in next software release that should provide a significant ‘step-wise’ improvement.
7.2 Extrapolated Reliability Growth with Duane
In addition to the use of Duane model the extrapolated reliability approach, based on engineering assessments of FM and fixes was used, particularly for software systems such as CBTC. Software defects in nature are missing, extra or defective lines of code that cause (or can potentially cause) a failure. Most generally a software error is systematic rather than random and the rate of occurrence (or failure rate) is linked to the rate that the particular function is exercised, or specific input conditions exist e.g. a specified tolerance is exceeded.
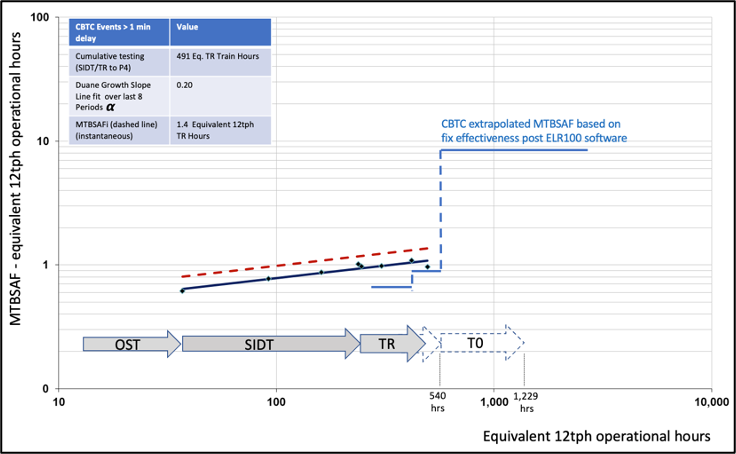
Figure 23. CBTC Duane and Extrapolated Reliability Growth Plot
Using the extrapolated reliability analysis approach above provides a pronounced incremental reliability growth pattern, reflecting several improvements being introduced via one software release, compared with the Duane model which assumes a constant level of reliability improvement. This is illustrated in Figure 23, which overlays the extrapolated reliability over the current Duane plot. The extrapolated growth (blue line) is based on the assigned fix effectiveness against each fault category. In practice some fixes may not resolve or fully resolve the issues and some changes may introduce other new failure modes, suppressing the rate of improvement. On balance, given the reliability improvements planned against the most significant failure modes, a ‘smoothed’ growth rate of between 0.20 and 0.4 appears reasonable and realistic.
The growth rates seen on the Jubilee and Northern line have not been consistently delivered on CRL. This is not surprising as the former involved a new signalling system being introduced on established rolling stock and infrastructure, whereas on Crossrail all systems and software are new and had to be integrated. Fixes have to be co-ordinated between a number of different systems before they could be rolled out, extending the fix cycle and delays from one supplier can hold up the introduction of fixes from another, resulting in periods with no software fixes being introduced.
7.3 Extrapolated using the Reliability Prediction Tool (RPT)
A Reliability Prediction Tool (RPT) spreadsheet was developed to calculate the current reliability and projecting reliability growth, using the technique for extrapolated reliability growth (i.e. collections of fixes within releases). The rate of improvement recorded in the RPT determines:
- the on-going rate at which new failure modes are found;
- the effectiveness and timeliness of the corrective actions (i.e. fix effectiveness), and
- the set of failure modes that are addressed by corrective actions.
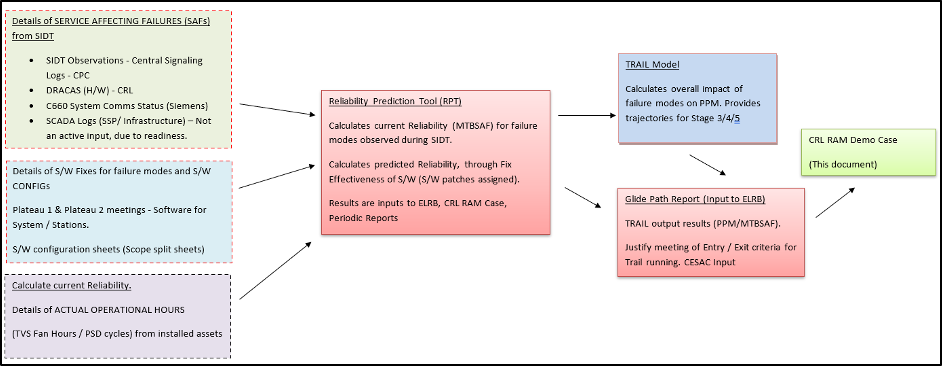
Figure 24. Reliability Prediction Tool (RPT)
The main input data to the RPT includes details of observed failure modes and operational hours in OST, SIDT and Trial Running. This is used to calculate an MTBSAF for each function and system which is then calibrated to provide an agreed MTBSAF, allowing for test conditions and the impact of any prolonged delays associated with learning or new process during testing. These details are then input to TRAIL which calculates expected PPM performance that the system will support at various points in time. This provides a trajectory of RB. A summary flowchart of the RPT is shown in Figure 24.
A Fix Effectiveness Factor (FEF) is the fraction reduction in an initial mode failure rate (or failure probability) of occurrence due to implementation of corrective action. FEFs are commonly assigned via expert engineering judgment. Estimating demonstrated fix effectiveness is also possible. An average FEF of 80% is a common level of fix effectiveness used in reliability growth projection analyses, but is dependent upon a given corrective action. The RPT provides an estimate of the overall system reliability following implementation of corrective actions to known failure modes. Each Software failure mode is assigned an associated fix and the fix effectiveness rate is calculated. The MTBSAF planned improvements tab within the RPT gives the calculation based on this improvement. An example shown from V19 of the RPT is shown in Figures 25 and 26.

Figure 25. Failure Category and Identified Fixes
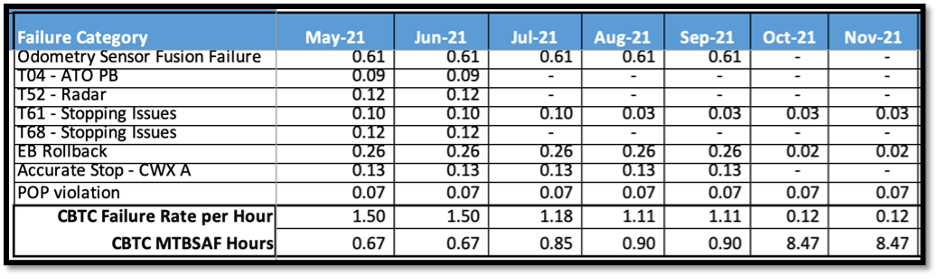
Figure 26. Extrapolated RG V19 RPT
7.4 TRAIL Simulation Model
The TRAIL (Transport, Reliability, Availability and Integrated Logistics) model has been used throughout the Crossrail life cycle for performance modelling simulations at key stages, both for enhancement i.e. On-Network Works (ONW) and to generate requirements e.g., COS Infrastructure. TRAIL uses an iteration process as shown in Figure 27, where the model is run/rerun with various input values from different parts of the project.
Figure 27. TRAIL Simulation Process
The model is used to provide an estimate of performance for a timetable and input assumptions. TRAIL is a discrete event simulator and occupancy model which simulates the movements of services across the network. It is used to output service reliability (journey lateness). The Crossrail model captures service operations within the railway with defined infrastructure, rolling stock and operational Reliability, Availability and Maintainability (RAM) characteristics.
Figure 28. Performance Simulation Modelling on Crossrail
Simulation modelling in TRAIL started at the early stages of the project using a combination of observed asset performance across the NR ONW and asset RAM targets. An overview of the TRAIL model across the Crossrail project is shown in Figure 28. This illustrates different areas of the model that had to be built up, such as the surface works from network rail, and the new areas and assets for the COS. The inputs for the operations and maintenance and Rolling Stock and deports from the various other bodies are also shown. The Crossrail reliability growth programme has provided progressive growth projections for the COS area using iterations of the TRAIL model (with the data flow illustrated in Figure 9).
Since the introduction of OST, the RPT has been used as an input to the TRAIL model to generate representative states of the railway at different stages. An example of the TRAIL trajectory from RPT V19 is shown in Figure 29.
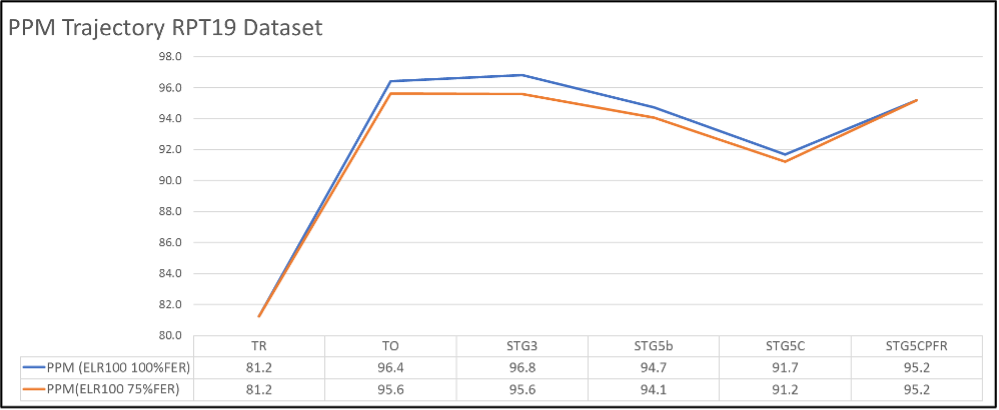
Figure 29. TRAIL Trajectory from RPT V19
8 RGM Implementation Experience and Lessons Learned
8.1 Overview
The Crossrail RGM programme has made a significant contribution in advancing the project towards entry into revenue service. It’s establishment in 2019 required a number of key changes to; Organisation, test strategy, data analysis and presentation processes. Some of the main aspects and benefits and lessons learned are summarised below:
8.2 Reliability Growth Management Strategy
No RGM Strategy 1 The reliability growth strategy document, prepared in 2019, played an important part in gaining programme wide agreement on the required Organisation, potential risks and mitigating measures; with the necessary supporting processes and techniques. 2 Director level endorsement demonstrated CRL commitment to the importance of reliability. 3 The strategy implemented best practice Reliability Growth Management (RGM) policies and techniques as evolved over the last 40 years and across many sectors including aerospace, defense and rail transportation. Some aspects, such as the application of the Duane growth model and Extrapolated reliability, required careful explanation and justification to programme directors and teams. The Duane growth model had limitations during Dynamic Testing and Trial Running as systems were still being commissioned and were not stable. 4 Benchmarking reliability growth from other projects was extremely helpful in confirming planned growth rates and identifying key factors in achieving those growth rates. 5 Sufficient time for testing, to discover defects, and for pre-planned improvements needs to be built into the programme, allowing for the extended periods need to resolve software and integration issues – software releases take a long time from initial fault discovery, especially where several suppliers are involved and where software has to be integrated. 8.3 Management Framework
No Management Framework 1 Whilst the CRL RAM team had successfully managed the reliability programme during the Specification and Design phases, it became clear there needed to be proactive executive involvement in reviewing and guiding the programme through the technically challenging Train Testing phases. ELRB has been held every four weeks since 2019 ( the past two and half years) using its decision-making authority to drive up levels of reliability where required. 2 Establishing ELRB also ensured the supporting technical review groups and data collection & presentation aspects were fit-for-purpose. 8.4 Test Programme Design
No Test Programme Design 1 The original system test strategy for the integrated Signaling & Control System (Train and Infrastructure) was based on three major phases – Dynamic Testing, Trial Running and Trial Operations. Respectively, these phases were oriented towards: proving functions and achievement of supplier specifications (including integration); demonstration of system level performance; exercise of operational processes and readiness. 2 Towards the end of Dynamic Testing it was recognised that additional testing would be required during Dynamic Testing, providing more focus on reliability and the ability to measure ‘service delay’. This testing would make earlier use of multiple train running (in close headway), increase mileage and use representative timetable conditions to identify and resolve reliability issues (beyond function proving). This led to additional Operational Simulation Test (OST) and System Integrated Dynamic Test (SIDT) phases being introduced. 3 The CRL RAM Team has a central role in the formulation of the specifications for OST and SIDT, to ensure maximum value could be extracted from the tests for reliability analysis. 4 Additional processes and tools were needed to measure reliability performance during OST and SIDT – often using logs because ‘business as usual’ systems had not been commissioned. 5 The vast majority of reliability issues identified were software related with fixes taking a period of time to go through the V&V process, with fixes ‘bundled’ together into new S/W configuration release ready for installation. This meant the same issues were observed over several months before correction resulting in a pronounced ‘step-wise’ growth pattern rather than a smooth growth pattern. 6 Taking note of the above, future software intensive projects, should give greater consideration to early discovery and introduction of important S/W fixes; to accelerate reliability growth and reduce risk of late identification of other faults being introduced. 2.5 DRACAS
No DRACAS 1 The Data Reporting and Corrective Action System (DRACAS) is a valuable reliability management measure that can be applied to projects. It is vital that the DRACAS process results in timely changes to correct substandard performance and reliability. 2 The importance of DRACAS was recognised by CRL and a unified process and database implemented by all projects and managed centrally by the CRL RAM Team. 3 Future application of DRACAS operation should improve focus on:
· Criteria for ‘Open’ and ‘Closed’ assignments to incidents
· Operation of Failure Review Boards
· Application of structured Root Cause Analysis techniques
8.6 Data Collection & Presentation
No Data Collection & Presentation 1 As observed on other complex projects, data collection of Operating and Reliability data is a significant activity and often requires allocation of dedicated resources. 2 During the OST, SIDT and continuing into Trial Running & Operations members of the CRL RAM Team have acted as floor walkers in the Route Control Centre to understand events first- hand and ensure accurate recording. 3 A central log of all train events was maintained capturing all causes – technical and process related. This single data source, together with operating data, has been used to generate summary reports (daily and weekly) of system reliability. Significant effort was applied to ensuring the data presentation was of a high standard; with reports being widely circulated from the CRL Chief Executive Officer downwards. 4 The ability to capture and analyse logs and discard the “noise” of alarms associated with systems not yet fully integrated, is vital to understand true failures and where to direct effort. 5
Changes of responsibility as assets were handed over from Crossrail, the “builder”, to the Infrastructure Manager, complicated failure reporting processes as new reporting systems were set up. References
[1] Crossrail RAM Case
[2] Crossrail Reliability Growth Management Strategy
[3] Crossrail Daily Reliability Report
[4] Crossrail Period Reliability Reports
[5] CRL Suppliers Reliability Reports
Appendix – Duane Reliability Growth Model Concept
Fundamentals
The Duane growth model stipulates that the expected number of failures divided by the cumulative operating time, C(t), varies with the operating time as:

where l is a constant and a is the model growth parameter. The inverse of C(t), known as the cumulative Mean Time Between Failures (MTBFC), can be written

The equation above is a linear relationship in the log-log domain and can be represented on log-log paper to determine the model parameters, l and a. The current value of the MTBF at any moment in time, also known as the instantaneous MTBF, can be estimated as:

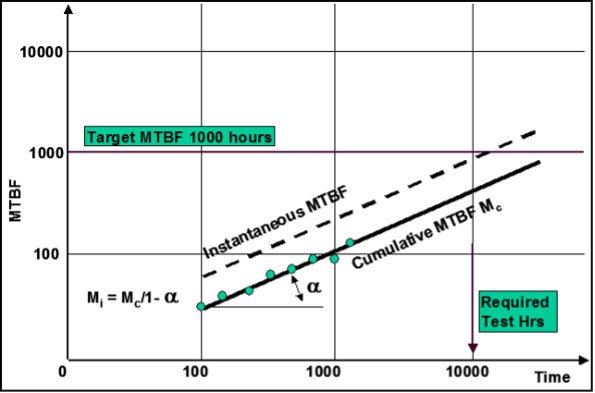
Figure A1. Duane Plot Example
Values
Typically, the values of the growth parameter, a, lie between 0.1 and 0.6:
- A growth parameter value below 0.2 indicates a poor rate of reliability improvement,
- Values above 0.4 indicate highly effective improvement activities; where there is a strong focus on failure investigation and elimination.
- Typical values observed in the railway industry are between 0.2 and 0.4.
- If the growth parameter is close to 0, there is no trend in the reliability performance and it can be assumed that the failure rate is constant, i.e. no reliability growth, this would be expected once a steady state operating regime has been reached.
- A negative value of the growth parameter indicates reliability decay, i.e. deterioration of the equipment performance.
Construction Parameters
In order to construct a Reliability Growth a number of key parameters need to be assigned based on either specified parameters (such as reliability targets and test durations) or assumed parameters based on a combination of previous experience, conventional practice and engineering judgement. These are described below.
Target Reliability – The target MTBF is a fixed value taken from the reliability data sheets. Test hours – Fixed values for each integration stage taken from the individual test plans.
Reliability growth parameter – a range of growth parameter α (alpha) is inputted; the following ranges were used:
Growth Parameter (α) Range Comment 0.2 to 0.3 (Poor) Modest improvement effort applied with average DRACAS effort and some project focus on reliability 0.3 to 0.4 (Good) Good improvement effort applied with significant DRACAS effort and strong project focus on reliability 0.4 to 0.5 (Outstanding) Excellent improvement effort applied with very significant DRACAS effort and major project focus on reliability Start MTBF – starting MTBF, stated as a percentage of the target MTBF value, have been used within the following ranges:
Start MTBF Range Comment 10 – 20%
(Poor)
Indicates a substantially immature core system without previously established reliability; and with significant potential for system integration, interface or unique application reliability issues.
Several assets introduced into Network Rail over the last fifteen years (e.g. Axle Counters / HPSS / Hydrive / GSM-R / ERTMS) were observed to start in this range or below.
20 – 30%
(Good)
Indicates a reasonably mature core system with some previous reliability evidence; and with some potential for system integration, interface or unique application reliability issues. 40 – 50%
(Excellent)
Indicates a substantially mature system with previous established reliability; and with limited potential for system integration, interface or unique application reliability issues. Region of Non-Conformity (RNC) – On high technology systems it is often observed that there is an initial period where data does not fit the Duane Model. During this period there is often zero growth whilst solutions to difficult system problems are explored. Within the growth plans an RNC of either 100 hours or 500 hours is often assumed. Application Phase Drop (‘D’) – Where reliability growth is planned to span several system integration levels and/or different applications there is a likelihood that new problems will be encountered at each application. The following application phase MTBF drop parameter ‘D’ are used to reflect this characteristic.
Application phase drop Parameter (D) Comment 80% to 90% (Poor) Potential 10% to 20% drop in instantaneous MTBF at start of next application. Significant risk of new problems. 90% to 95% (Good) Potential 5% to 10% drop in instantaneous MTBF at start of next application. Low risk of new problems. Definitions & Abbreviations
CBTC Communication Based Train Control CCTV Closed Circuit Television CIS Customer Information System COS Central Operating Section CPFR Crossrail Performance Functional Requirements CRL Crossrail Ltd DRACAS Data Recording and Corrective Action System DT Dynamic Testing DOO Driver Operated EiTR Entry into Trial Running EiTO Entry into Trial Operations EiRS Entry into Revenue Service ELRB Elizabeth line Reliability Board ETRMS European Rail Traffic Management System FRACAS Fault Reporting, Analysis, and Corrective Action System FRB Failure Review Board GSM-R Global System for Mobile Communications IM Infrastructure Manager LCC Life Cycle Cost MEP Mechanical, Electrical and Public Heath MTBF Mean Time Before Failure MTBSAF Mean Time Before Service Affecting Failure MTR EL MTR Elizabeth line NIRG National Infrastructure Reliability Group NR Network Rail O&M Operations and Maintenance OHLE Over Head Line Equipment ONW On Network Works (Surface Works) OST Operational Scenario Testing PPM Public Performance Measure PSD Platform Screen Doors PSG Performance Steering Group RAM Reliability, Availability and Maintainability RCC Route Control Centre RCA Root Cause Analysis RfL Rail for London RFLI Rail for London Infrastructure RG Reliability Growth RGP Reliability Growth Plan RGM Reliability Growth Management RGMS Reliability Growth Management Strategy ROGS Railways and Other Guided Transport Systems S&C Signalling and Control SAF Service Affecting Failure SCADA Supervisory Control and Data Acquisition System SE Systems Engineering SIDT Systems Integration Dynamic Testing SoS System of Systems SSP Stations/Shafts/Portals TfL Transport for London TLP Thames Link Programme TO Trial Operations TOC Train Operating Company TPH Trains Per Hour (tph) TR Trial Running TRAIL Transport Reliability Availability Integrated Logistics -
Authors

Richard Consterdine MIMechE MIAM - Crossrail Ltd
Richard has been working on the Crossrail project since 2013, as Crossrail’s Maintenance Planning Engineer. Richard is responsible for ensuring that Crossrail delivers via its contractors; a railway that can be safely and efficiently maintained and that it meets the demanding RAM requirements. This provides vital assurance to the eventual infrastructure maintainers and the Train Operating Company that the railway can be accepted at handover.
Richard has been in the Railway Industry since 1987, previously working on London Underground and the Docklands Light Railway. Roles have included projects, engineering, access planning, contract management and the maintenance of train fleets and infrastructure.

Jonathan King FIET - Crossrail Ltd
Jonathan has been working on the Crossrail project from 2006, firstly as a Crossrail supplier MDC, and FDC and more recently for Crossrail as an Engineering Manager and Engineering Safety Manager. Jonathan’s responsibility has mainly covered systems design, delivery, construction, and safety engineering aspects.
Jonathan has been in the Railway Industry for nearly two decades, working on projects such as CTRL section 2, Thames Link and SSL 4LM. Jonathan is also undertaking research on the Crossrail project under a programme affiliated with the University of Birmingham (UOB) for Reliability, Availability, and Safety (RAMS) and Integration.