Taking the strain, coping with pressure or shooting targets? An objective comparison between monitoring solutions within sprayed concrete lined tunnels at Crossrail Farringdon Station, London
Document
type: Technical Paper
Author:
Petr Salak Eur Ing, MSc, CEng MICE, Angelos Gakis Dr. Dipl-Ing, MSc DIC, CEng MICE, Adrian St.John, BEng (Hons) Eur Ing FICE CEng, ICE Publishing
Publication
Date: 31/08/2016
-
Read the full document
Notation
BFK BAM Ferrovial Kier Joint Venture, the main contractor
DSP Dr. Sauer & Partners, BFK’s specialist SCL designer
ETH Eastern Ticket Hall
FBG Fibre Bragg Grating (fibre optic strain monitoring)
FEA Finite Element Analysis
LSB Lindsey Street Bridge
MOS Monitor Optics Systems, the specialist fibre optic monitoring subcontractor
PCC Precast concrete
PM the Client’s Project Manager
SCL Sprayed concrete lining
SRG Shift review group
TBM Tunnel boring machine
TM Tunnel metresIntroduction
Crossrail will provide London and the South East with a world class, high-capacity railway to ease congestion on London’s public transport system and enable better access between business, residential and entertainment districts. At the heart of this £14.8bn scheme lies Farringdon Station, which will form a major interchange between Crossrail, Thameslink and London Underground. When Crossrail opens, it is expected to carry 200 million passengers per year.
The £400m Farringdon Crossrail station was awarded to a joint venture of BAM Ferrovial Kier (BFK) in 2011, and comprises two ticket halls, two platform tunnels, connecting cross passages, concourse tunnels, two escalator inclines, escape and ventilation adits, all constructed using open face sprayed concrete linings (SCL). BFK appointed Dr. Sauer & Partners (DSP) as their specialist SCL designer.
As the main contractor for both C300/C410, the Western Running Tunnels and Station Caverns, and also for C435 Farringdon Station, BFK were in a unique position to develop strategies to reduce cost, time and risk for the Client. One such innovation involved the continuation of the TBM drives for the running tunnels right through the length of the new Farringdon platform caverns. This created large diameter precast concrete pilot tunnels for the subsequent platform enlargement using SCL. The benefits of such an approach are described in detail by St.John et al (2015) [9].
BFK also introduced another alternative strategy to reduce cost, time and risk, by proposing to abandon the TBMs in the ground permanently rather than recovering them through the ticket hall shafts. This de-risked the programme, enabling critical ticket hall construction to proceed unhindered. However, one consequence of this revised strategy was an area of increased underground congestion, with two SCL tunnels and a bored tunnel (complete with abandoned TBM) in close proximity to a ticket hall excavation and a sensitive, listed railway structure.
Faced with this complex geometry, and combined with challenging geotechnical conditions[2], the BFK / DSP team chose to install enhanced monitoring to study the behaviour of tunnel RTE2 and ensure that it was performing as predicted. Applying advanced 3D numerical modelling and taking into account the residual tensile strength of the SCL helped avoid unnecessary reinforcement installation in primary lining and/or early installation of a secondary lining in RTE2 prior to ES2 construction.
Methods of monitoring structural behaviour of tunnels during construction traditionally rely on in-tunnel absolute displacement monitoring and, at this location, DSP were also prescribing to install additional monitoring such as pressure cells to complement the absolute displacement monitoring. However, there was a degree of scepticism and opposition from a number of parties regarding the effectiveness of pressure cells within SCL tunnels.
The advent of fibre optic strain technology (using Fibre Bragg Gratings) has offered the tunnelling industry an alternative method of monitoring tunnel behaviour. BFK and Monitor Optic Systems had previously carried out pioneering work at Bond Street Station where the viability of installing fibre optic cables within sprayed concrete lined tunnels was demonstrated[8].
CRL, DSP and BFK therefore agreed to install parallel arrays of all three systems within tunnel RTE2, with a view to the following:
- Obtaining traditional absolute displacement monitoring. This data was acquired manually, reported through the SRG and compared with green, amber and red pre-defined trigger levels.
- Recording pressure cell data for reference
- Obtaining real-time strain data for reference
- Although no trigger levels were defined for the pressure cells or strain monitoring, this could provide additional insight into lining behaviour and performance in the event of an absolute displacement trigger
- Offer the design team with a better understanding of soil/structure interaction, and to validate their complex 3D finite element
- Providing the industry with a unique and objective comparison between the different types of
This paper discusses outcome of the monitoring results and the relative performance of each system in relation to ease of installation and use, cost, safety and speed of installation, robustness and reliability of the system, and the precision and accuracy of the data.
Context and background
The reference design assumed that the C300/C410 TBMs would traverse through Farringdon Station and be extracted via the Eastern Ticket Hall (ETH). BFK’s alternative Value Engineering proposal involved the TBMs being driven off-line near the ETH and buried permanently. This “Turn and Bury” alternative offered significant cost, benefit and risk benefits to the overall project, not least in respect of the interface with the construction of the ETH.
However, one consequence of the “Turn and Bury” solution was that tunnel RTE2 would no longer be constructed by the Westbound C300/C410 TBM. Instead, this short length of tunnel needed to be constructed using a sprayed concrete primary lining, and part of the tunnel advanced through foam concrete backfilled TBM tunnel (see Figure 1).
Once the westbound TBM had been stripped, decommissioned and the part east of PL4 was backfilled with foam concrete, tunnel RTE2 was constructed. This had an external diameter of 7850mm with a 350mm thick primary sprayed concrete lining, and extended from the PL4 headwall to the ETH shaft. The excavation sequence for RTE2 followed a standard top heading, bench and invert division through a mix of natural ground and the foam concrete.
The geometry in this area was further complicated by concourse tunnel CH2, which was constructed after RTE2. This tunnel started with a pilot tunnel (accessed via CP6) and was advanced towards the future escalator tunnel ES2 and the ETH Shaft. The CH2 pilot tunnel was roughly circular, with an internal diameter of 5.0m and a 250mm primary lining thickness. Following construction of the pilot tunnel, CH2 was subsequently enlarged to full size, 10.4m wide by 10.0m high, with a 350mm sprayed concrete primary lining. The CH2 enlargement ended at a temporary headwall only 25mm from the extrados of tunnel RTE2. Tunnel ES2 was subsequently driven downhill to meet the CH2 headwall.
Tunnel ES2 commenced with a break-out from the ETH Shaft and was excavated downwards, using a top heading (with temporary invert) which was subsequently enlarged with bench and invert to form the full permanent works profile. The final profile of ES2 was 7.95m high by 8.15m wide, with a primary lining thickness of 300mm. ES2 passed extremely close to tunnel RTE2 below, with both sprayed concrete linings almost touching each other.
To mitigate settlements induced by the tunnelling operations described above, compensation grouting was prescribed in this area, and an associated compensation grouting shaft was also constructed above RTE2 tunnel.
The situation was made even more complex by the presence of a Listed railway structure, Lindsey Street Bridge (LSB), directly above ES2 and with limited cover. LSB was located immediately to the west of the ETH. Historic drawings indicated that the structure originally comprised brick jack arches supported on wrought iron beams, spanning between cast iron columns and brick abutments. This jack arch and wrought iron beam construction was later underpinned by masonry arches supported on brick piers. The bridge structure was supported on mass concrete spread footings founded in London Clay. A continuous reinforced concrete raft slab which principally spanned between the bridge piers was introduced to more evenly distribute imposed loads from the bridge structure above the proposed ES2 route. These were augmented by a complex jacking arrangement which could be deployed by BFK in the event of undue movement.
Furthermore, the Farringdon Crossrail station was located in an area with 5 major geological faults with a throw of up to 7m [2]. The SCL tunnels were constructed predominantly within the Lambeth Group, with a high likelihood of encountering pressurised water-bearing sand lenses. The geotechnical complexities, risks and hazards of undertaking open face SCL works in such an environment have been described in detail elsewhere [3].
In order to produce safe and economical SCL design, a 3D Finite Element Analysis (FEA) was utilized to model this complex arrangement of geology, geometry and sequencing. This method provided an opportunity to consider the 3D effects of tunnelling in the course of construction, ground-structure interaction and face stability, giving information regarding volume loss, ground movement and the expected stresses and displacement in the shotcrete shell.
In order to provide an additional level of assurance that the tunnels were behaving within expected parameters, the DSP design team were keen to deploy additional instrumentation and monitoring at this critical location, close to where RTE2 and ES2 almost touched each other. There was some concern that, given the complexity of the tunnels and the amount of disturbed ground, that the secondary lining of RTE2 should be constructed prior to ES2 being mined. However, this would have caused a major issue with the Contractor’s programme and was thus far from ideal. Installation of additional instrumentation provided the designers with the required additional level of assurance in respect of this risk.
Whilst manual monitoring of lining displacement could normally be performed with a sufficient degree of frequency and accuracy, a more precise and direct method of monitoring lining stress was sought. However, previous experience of stress monitoring in the shotcrete shell has proven to be a more challenging undertaking. Hydraulic concrete stress cells have been used previously to measure direct stress, but these require particular installation and reading processes that are not always successfully performed in the field [4], [5], [6], [7]. Their installation can be fraught with difficulty, and there was considerable opposition from some parties as to whether such an installation would be worthwhile.
Based on the work carried out by BFK and Monitor Optics Systems (MOS) at Bond Street station, a compromise was therefore agreed, involving the parallel installation of concrete stress cells and fibre optic strain measurement arrays, in conjunction with the traditional in- tunnel 3D optical monitoring. The main advantages of the fibre optic strain measurements were the ease and speed of installation and the ability to undertake very accurate, real-time remote readings of strain within the lining. The correlation between the direct stress measurements using concrete stress cells and the strain measurements using fibre optics was investigated in a section of RTE2 at Farringdon Station, and the results are presented and discussed below. The aim of this innovative approach was to develop a measurement method that provides frequent, reliable and remote read-outs.
The designer’s desire to measure the stress or strain in as-installed SCL lining was in order to:
- validate the design (assumptions, and the accuracy of modelling)
- better understand the behaviour and performance of the SCL linings
- better understand soil-structure interaction
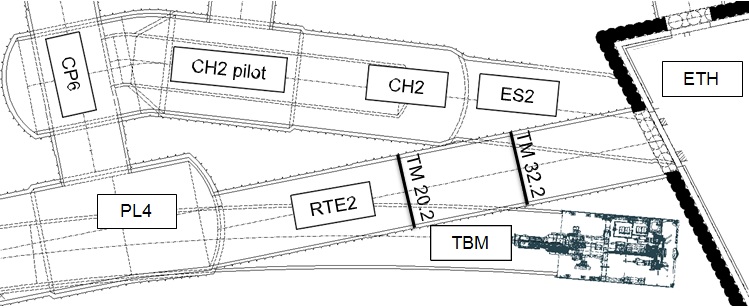
Figure 1 – Plan view showing RTE2 and the subsequently excavated CH2 and ES2. Description of monitoring methods
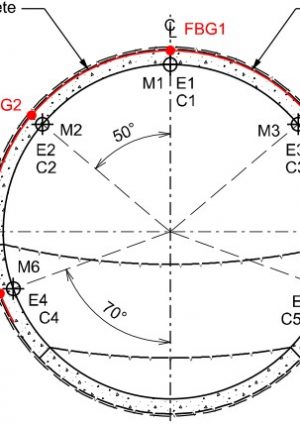
Convergence monitoring has traditionally been carried out using tape extensometers and, in more recent years, high precision total stations capable of measuring three-dimensional co- ordinate positions of reflector targets drilled into the tunnel lining. These target positions are nowadays reported in absolute terms, rather than as relative convergence. These targets are manually drilled into the SCL primary lining as soon as safe access is available (i.e. once the exclusion zone has been lifted following spraying of the primary lining) (see Figure 2). They are quick and simple to drill and fix into the lining, and are typically installed by the mining gangs, shift engineer or surveyor working from a mobile access platform. The targets are arranged in an array (see Figure 3) with discrete monitoring points around the crown from knee to knee, typically at 10m centres. Monitoring is then carried out manually by surveyors working within the tunnel, usually on a daily basis if within the zone of influence of any live tunnel face, and relies upon line of sight from the total station setup to each target. The total station also needs to be benchmarked against a static point within the tunnel, thus requiring a traverse back to an area unaffected by live tunnelling operations.
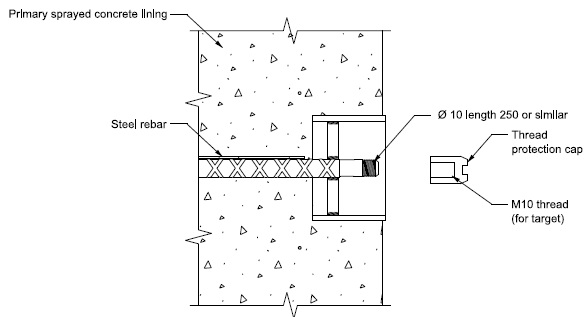
Figure 2 – Standard bolt-on optical monitoring target. Fibre Bragg Grating (FBG) fibre optic strain monitoring is a recent innovation in SCL tunnelling and was first trialled successfully at Bond Street Crossrail station (C300/C410) by BFK and MOS. Published paper [8] describes the technology and installation method in detail. At Farringdon Station, BFK and MOS installed two FBG arrays 10m apart, to coincide with the convergence monitoring and pressure cells. Although MOS provided an installer to execute the fibre installation at the face, and interrogator unit, laptop and IT connections on the surface, the majority of the work was carried out by BFK (e.g. mobile access platform operator, electrician, etc). The FBG arrays are manufactured to suit the specific tunnel geometry (as shown in Figure 3) such that the continuous fibre optic cable has an FBG within it at the correct clock position around the top heading. Immediately after the application of the initial sealing layer and the lifting of her exclusion zone (typically 45minutes and when 0.5MPa early concrete strength is reached), the cable is pinned to the intrados of the initial sealing layer using steel staples or “U” nails. The primary lining can then be sprayed, thus fully encapsulating the cable, except for the outgoing signal cable linked to the interrogator unit at the pit top. The signal cable is temporarily fixed to the tunnel lining, and sends continuous data back to the interrogator unit and laptop. The data is available in real time via a website using the DaMiNS user interface. The frequency of the readings can be configured to suit project needs, but once per 15 minutes was selected by BFK. The system can also be configured to send automated alerts should the readings cease for any reason.
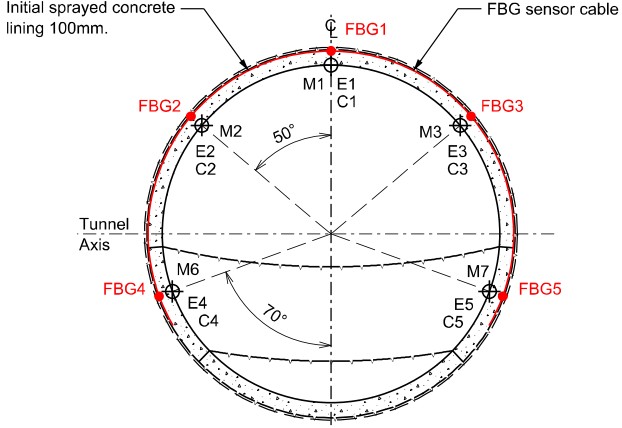
Figure 3 – Fully instrumented monitoring sections in RTE2 showing the position of the prisms (M1 to M7), the fibre Bragg gratings (FBG1 to FBG5) and the earth and concrete stress cells (E1 to E5 and C1 to C5 respectively). Oil filled pressure cells were deployed within RTE2 at locations to match the other monitoring systems. These were arranged as shown in Figure 3 with a data logger located nearby in the tunnel. Once sprayed into the primary lining (detail shown in Figure 4), the cells were pressurised in accordance with the manufacturer’s instructions using a crimping device. The pressure cells were installed by BFK surveyors who had had previous experience of installing such devices on previous projects. It was therefore felt that the BFK experience was adequate to install such cells properly. There are documented examples of pressure cells providing useful data within SCL tunnels [4], [5], [6], [7] but, based on numerous discussions with a wide range of people within the SCL fraternity, the examples which yielded useful results are irregular.
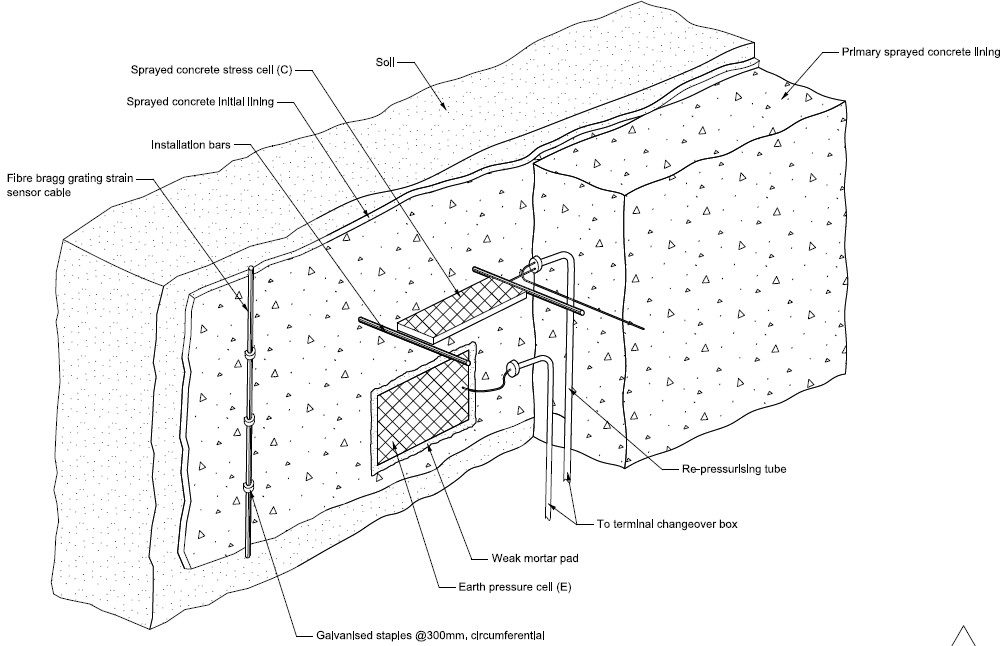
Figure 4 – Detail of pressure cell installation within the sprayed concrete lining. 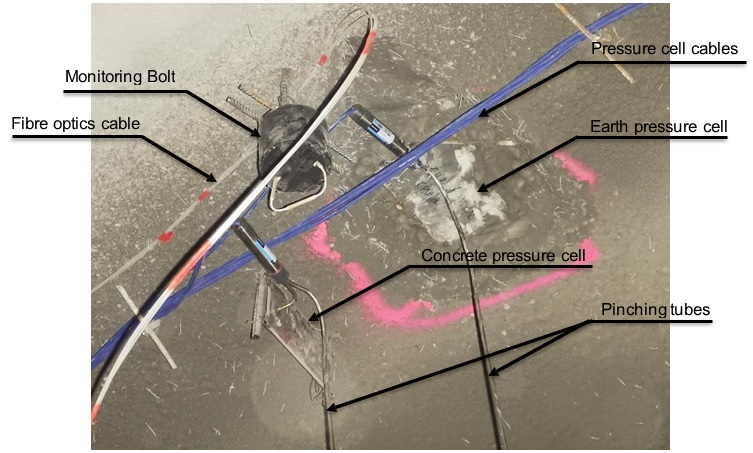
Figure 5 – Photograph showing the parallel installation of three monitoring systems within RTE2. Interpretation of the data obtained
In order to interpret the results of the in-tunnel monitoring efficiently, three different aspects are presented: firstly, the accuracy of each system as assessed through the observations, secondly the anticipated behaviour of the lining in terms of stress, strain and deformation based on the results of a 3D finite element analysis (3D FEA) and finally the actual results in the various characteristic time periods.
Observed accuracy of each system
The accuracy of each monitoring scheme has been determined through observations during periods without any ongoing activities that could result in stress/strain changes in the tunnel.
The 3D optical monitoring revealed an overall precision of ±1 to 2mm as expected. More consistent results were acquired in the vertical direction (±1mm) as compared to the transverse and longitudinal (±2mm). This difference is attributed to trigonometric considerations during the measurements and is not to be analysed further as part of the scope of this paper.
In the case of the fibre optics, the accuracy in RTE2 was in the range of ±20 to 30 micro strains (με). This is a very high standard performance if we can consider the following simplistic example: for a circular tunnel, 10 metres in diameter, a 1με diametrical strain would equal to 1×10-6×10=10-5m or 0.01mm of change in the diametrical direction. As such, 1mm of elongation or shortening would equal 100με, 10mm to 1000με and so on. This may not be explicitly compatible with the circumferential strains measured in the fibre optics, but still provides an idea of the order of magnitude of the precision of this technology.
Finally, in the pressure cells, the lack of consistent, reliable data did not allow the quantification of the errors. In general, a ±50kPa stress accuracy has been implied by the cells that provided the most reliable data.
Expected behaviour
The design analysis was performed with the use of the finite element software Abaqus [1]. The structures of the east end of Farringdon were included in the model as shown in Figure 6. The purpose of this very detailed simulation was to obtain a understanding of the three dimensional interaction between the structures. Since the scope of this paper is to evaluate the monitoring strategies, more details on the modelling campaign are not provided
Through the examination of the results, it was clear that RTE2 would be significantly affected during the CH2 and ES2 construction works described above.
In the area in RTE2 where significant stress concentrations were to be anticipated based on the results of the model, it was decided to apply an increased thickness of lining (350mm instead of 300mm). In total, four standard monitoring sections were prescribed in RTE2 to measure absolute displacements only, at approximately 10m centres. Additionally, to ensure that the lining would perform as expected, an enhanced monitoring strategy was implemented at TM 20.2 and 32.2, to also measure pressure and strain.
The results of the 3D FEA are summarised in Table 1 to Table 3 below. Points M1 and M2 were chosen as more representative as they were, as expected, affected most by the nearby tunnelling activities. For these points, the vertical and transverse displacements (Table 1 and Table 2) and the radial strains (Table 3) as calculated in the model are presented for the end of CH2 and ES2 excavation.
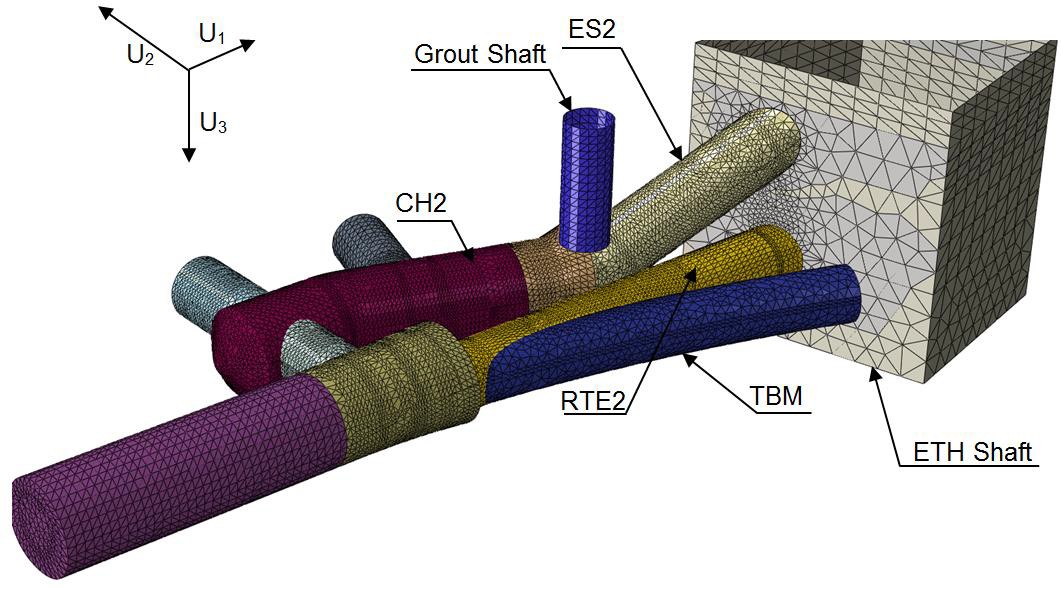
Figure 6 – Structures included in the 3D FE model. 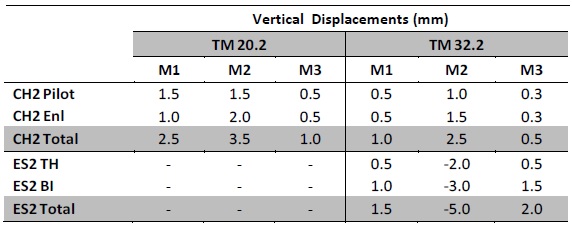
Table 1 – Calculated incremental vertical displacements in the 3D FE model during the various construction stages. 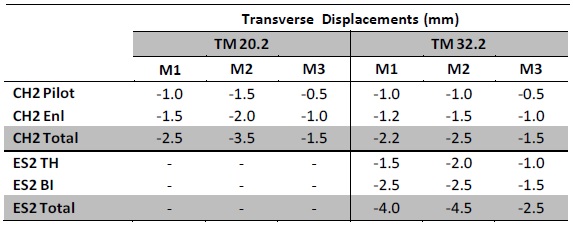
Table 2 – Calculated incremental transverse displacements in the 3D FE model during the various construction stages. 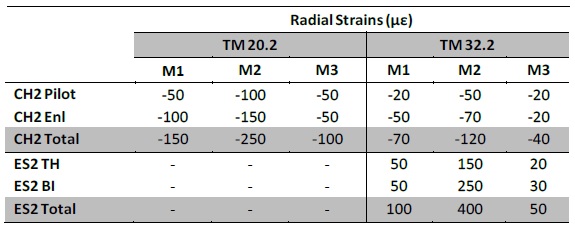
Table 3 – Calculated incremental radial strains in the 3D FE model during the various construction stages. Observations
In general the displacement readings were in line with the FBG strain readings. The combined readings are indicatively shown for point M2 of TM 32.2 in Figure 7. This point was chosen as it exhibited the highest stress-strain changes during the CH2 and ES2 excavations. The various construction stages of CH2 and ES2, as outlined in the previous section, are also shown in the graphs. The discontinuities in the FBG data sets refer to specific periods when the cables could not be measured either for technical reasons or because of conflicting construction activities in the tunnel.
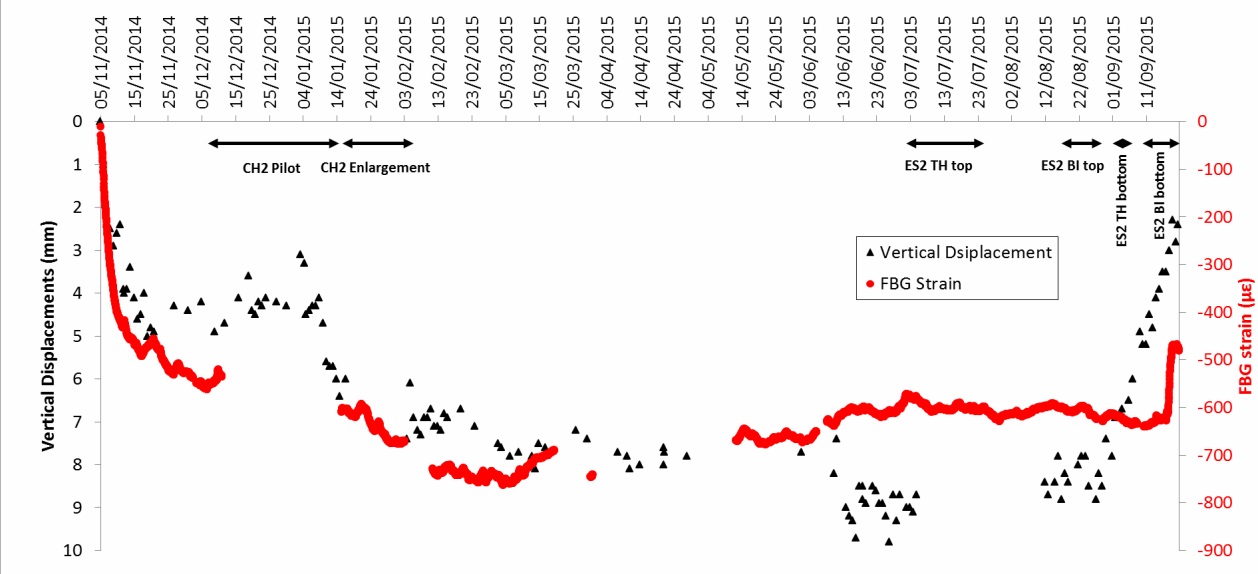
Figure 7 – Vertical displacement readings and FBG strain readings for point M2 of TM 32.2. As regards to the pressure cells, in most of the cases they were not able to capture the stress changes in the soil or the concrete in a reliable way. An example where they seem to have worked in line with the expectations is presented in Figure 8, where the stress, strain and displacement readings are plotted for the initial stage at point M2 of TM 32.2 (i.e. between the first reading and the establishment of steady conditions). A small vertical displacement of 5mm and a subsequent compressive strain of 500με were measured. The compressive stress in the concrete cells followed a similar increasing trend and stabilised at 2.5 MPa which is slightly higher than the design maximum expected value (1.5 MPa).
Figure 9 and Figure 10 present the FBG strain results for the crown points (M1, M2 and M3) of TM 20.2 and 32.2. Through the examination of the results, the following conclusions can be drawn:
- There is clear compression during the initial stage. This is translated to strains in the range of 400 to 700με. According to the design, a maximum strain of 1000με was expected at the end of the initial
- During the CH2 pilot construction, additional compressive strains were measured with a maximum of 100με, similar in TM 20.2 and 2.
- During the CH2 enlargement, additional compressive strains were measured with a maximum of 120με, similar in TM 20.2 and 2.
- During the construction of the top part of ES2 (ES2 TH top and ES2 BI top), minor strain changes were measured, within the accuracy
- During the construction of the bottom part of ES2 (ES2 TH bottom and ES2 BI bottom), the crown points in TM 20.2 exhibited some minor compressive strains. In TM 32.2, point M1 exhibited tensile strains of 60με and point M2, tensile strains of 160με. Point M3 exhibited minor compressive
The detailed results are presented in Table 4 to Table 6. Through comparison with Table 1 to Table 3, it can be assessed that a good correlation was exhibited between the anticipated displacements/strains from the results of the 3D FEA and the measurements of the prisms and the fibre optics.
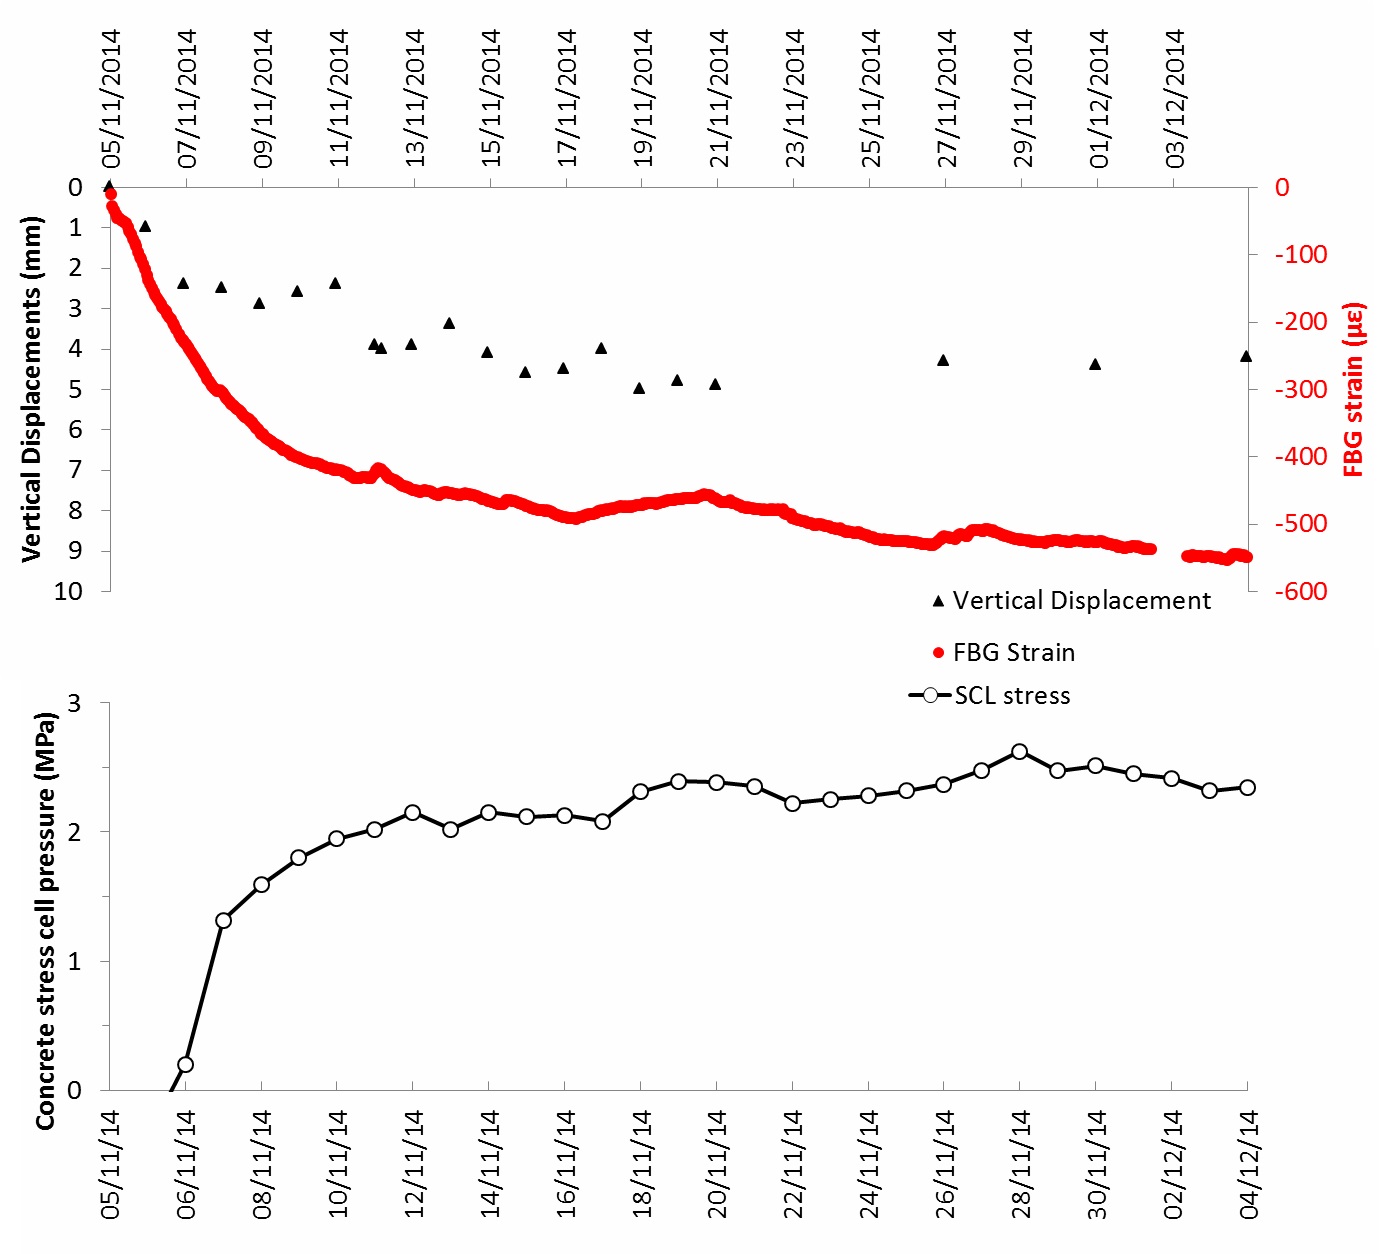
Figure 8 – Vertical displacements, FBG strains and concrete stress for the initial stage in point M2 of TM 32.2. 
Figure 9 – FBG strain readings for points M1, M2 and M3 of TM 20.2. 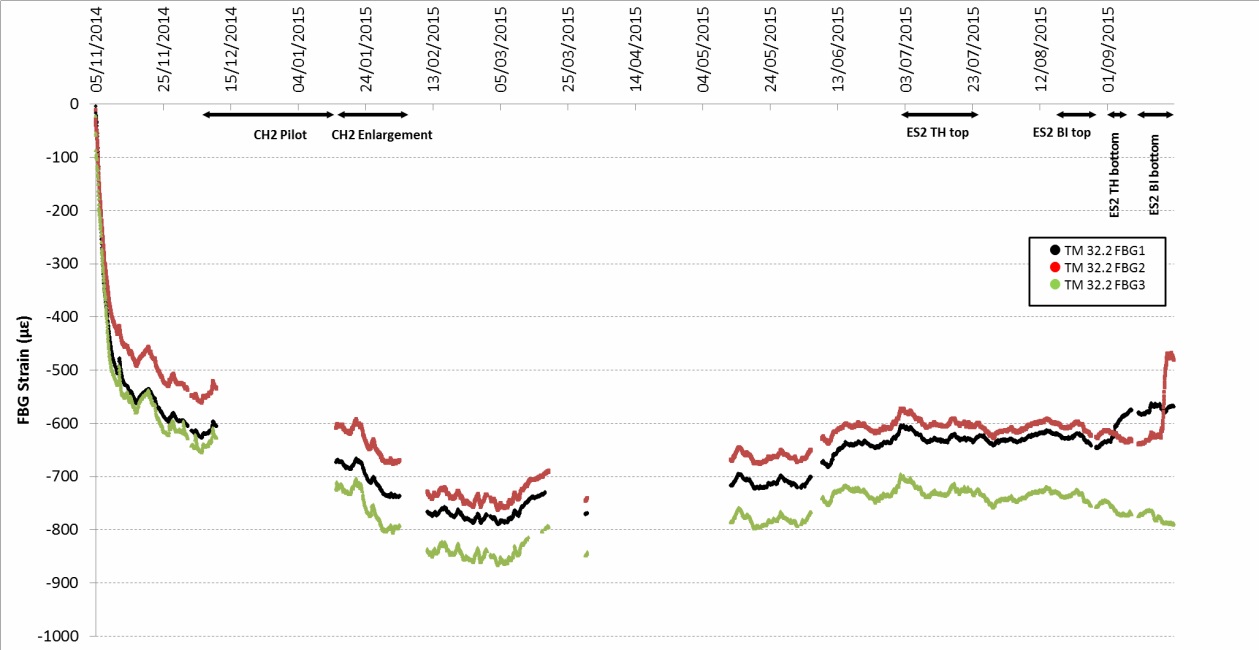
Figure 10 – FBG strain readings for points M1, M2 and M3 of TM 32.2. 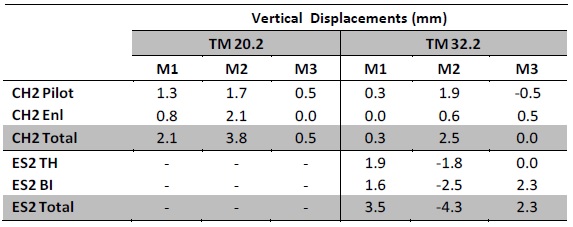
Table 4 – Measured incremental vertical displacements during the various construction stages. 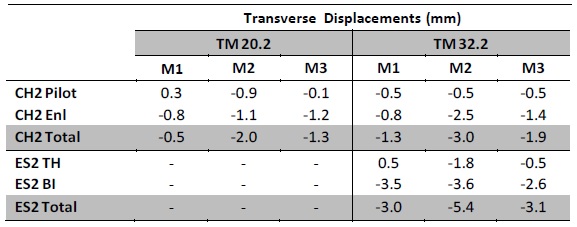
Table 5 – Measured incremental transverse displacements during the various construction stages. 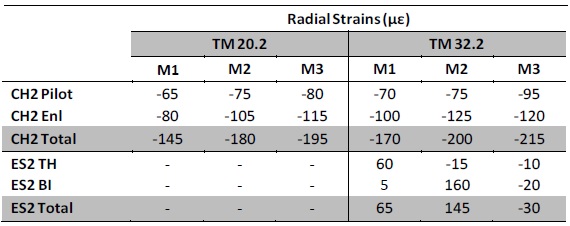
Table 6 – Measured incremental radial strains during the various construction stages. Comparison between the methods
The original design requirement for RTE2 was for absolute displacement measurement and pressure measurement, but the possibility to enhance this to also install strain fibre optics was agreed between all parties to test this innovative monitoring system and to provide additional assurance to this complex area of multiple tunnel activity. This provided a unique opportunity to directly compare three different monitoring systems in the same location. A comparison of these methods is given in Table 7 below.
Prisms Pressure Cells Fibre Optics Cost £
Total station is standard tunnelling kit. Prisms cheap. Labour to install and take readings.
££
Circa £15k including datalogger but no remote connection. Manual readings.
£££
Circa £25k for two arrays including signal cable and interrogator hire. Automated once installed, but damaged signal cable is costly (add £20k).
Ease of installation ++
Simple to install, drill and fix, limited work at height
–
Crimping (pressurisation) extremely difficult to get right by non-specialist contractor. Requires precision and care by highly experienced personnel. Achieving good contact with earth (mortar pad) can be difficult. Work at height. Can cause shadowing. Requires delicate re- pressurisation.
+
Pin cable to initial sealing layer, work at height.
Safety during installation ++
Working under protection of previous advance.
–
Requires manual breakout, exposing ground for earth pressure cells (risk to personnel).
+
Working under protection of previous advance.
Speed of installation ++
Installed within mining cycle, but first results typically 2 hours after installing primary lining.
–
Slow and cumbersome to install correctly.
Crimping.
+
Within mining cycle (minimal delay). Instant data acquisition (during spraying).
Durability –
Targets get dirty, require cleaning.
++
No moving parts.
++
No moving parts. Cable embedded into concrete.
Robustness –
Easily damaged but individual prisms easily replaced and re-baselined.
Frequent damage to prisms near face.
++
Arrays bulletproof (embedded in concrete) but frailty with signal cable.
++
Arrays bulletproof (embedded in concrete) but frailty with signal cable.
Reparability ++
–
+
Maintain stock of signal cable on site.
User- friendliness +
Manual manipulation of data.
– (++)
Complicated conversion formulae (calibration factors and temperature corrections) to obtain usable data. (This can be overcome by the right software).
++
DaMiNS web-based software powerful and easy to use.
Maintenance +
Targets get dirty, require cleaning.
+
Once installed correctly, no maintenance needed but crimping.
+
Once installed correctly, no maintenance needed. Signal cable is the weak link (need to hold spares, and set automated alerts in case signal lost due to cable damage). Test signal cable before first use.
Accuracy –
Typically +/-1mm V and +/-2mm H. Can be affected by creep of benchmarks if not far enough from zone of influence of live tunnelling.
++
Typically +/-50kPa, provided that the cell is installed, commissioned and maintained correctly.
+++
Typically +/-30με.
Reliability ++
But relies upon line of sight (obstructions), and triangulation back to static benchmark. Restrictions in setup position(s) may adversely affect accuracy.
– (+)
(Only after high effort during installation)
++
Reliable real-time, believable data which correlated with convergence results. Clear steps in data were readily identifiable and correctable.
Ease of data extraction –
Manual in-tunnel readings, manual uploading and submission to SRG. Labour intensive.
Estimation of strain can be manually estimated based on the results.
– (++)
Manual in-tunnel readings. Complicated formulae to convert to usable data -temperature corrections, etc. (Can be automated by software and logger)
++
Automated, real- time remote monitoring
Table 7 – Comparison between three monitoring systems
The absolute displacement measurement system used a set of prisms and a total station. The prisms are inexpensive to buy and they are simply drilled and fixed into the SCL primary lining. Although occasionally damaged by tunnelling plant, each individual prism is cheap and easy to replace, and does not affect the other targets within the array. If damaged, installation and re-baselining of a new replacement prism can be done quickly and easily without loss of data. The total station is a sensitive and expensive device, but surveyors or shift engineers are well used to maintaining, caring for and protecting the device without significant problems. Although cheap and simple, this system is limited by line of sight, which typically may include ventilation ducts, services, scaffold and shutters within a restricted and busy tunnel construction environment. Furthermore, results greatly depend on the accuracy of levelling from control points, particularly the ability to work from static benchmarks unaffected by tunnelling works. The main advantages of this system are the simplicity, price and reliability, albeit that the monitoring is carried out predominately manually. At Farringdon Station, all installation, maintenance and data extraction was carried out by the in-house BFK surveying team.
In regards to pressure cells, there are concerns within the tunnelling industry that the current technology is difficult to install and maintain properly, particularly in relation to the crimping (pressurisation) process. Significant efforts were therefore made to avoid such problems at RTE2. The pressure cells were installed by the BFK in-house surveyors who had had previous experience of installing such instrumentation. Unfortunately this still resulted in problems in obtaining reliable data, particularly in relation to re-crimping (re-pressurisation) of some of the cells. As a result, a significant number of pressure cells did not yield any reliable or credible data. Reasonable data were acquired during the initial stage after the installation in some of them. In summary, advances would need to be made to pressure cell installation to improve its reliability and suitability to the demanding SCL tunnelling environment.
Nylon reinforced strain & temperature sensing cables based on optical sensing technology were installed in the top heading and the bench of two sections of RTE2 under the protection of 100mm of initial sprayed concrete sealing layer. In each section five FBGs were installed so results were available in five distinct locations. The system was installed, maintained and also data acquisition & processing was done by the specialised subcontractor Monitor Optics Systems. The overall cost was higher than the pressure cells, but the web-based DaMiNS system was powerful, flexible yet extremely easy to use, and provided high precision real- time remote data in the office. Also, all 10 sensors remained functional at all times and provided precise and believable real-time strain data for the tunnel. The main weakness of the system was the relative fragility of the signal cables in a tunnel environment which connected the arrays back to the interrogation equipment and dedicated control computer installed in the site office. Cables were damaged on a few occasions, but their replacement followed promptly.
Recommendations
Since installation, maintenance and reading of prisms and displacement measurements by total station is relatively easy, most competent tunnel contractors would have no difficulty in self-delivering such monitoring works. However, this method is labour-intensive, and has a limited accuracy (typically +/- 1 to 2mm), and does not provide a direct measurement of either true strain or stress in the lining.
For special cases such as at RTE2, designers may wish to specify more precise, real-time monitoring to gain a better understanding of lining behaviour. Hydraulic pressure cells and FBG fibre optic strain monitoring offers such a capability, although the use of former within SCL tunnels appears to be fraught with difficulties which may render much of the data of questionable value. An automated data acquisition system would always be beneficial.
After the experience from Farringdon station authors would recommend the appointing of specialized instrumentation & monitoring company to install, maintain and provide the data in an agreed format, and provide technical support and assurance of the whole system.
There are a number of areas which, on the basis of the experience at Farringdon, would benefit from future work:
- Convergence monitoring: Automated methods of calculating true convergence, thus eliminating possible survey error from a creeping
- Stress measurement: The development and use of fibre optic pressure cells, which are currently being trialled by Monitor Optics
- Fibre optic strain monitoring:
- Deployment of the interrogator and laptop near the tunnel face, connected via underground WiFi network to transmit data to the surface. This could, in part, mitigate one of the key frailties in this system, namely the long signal cable which, despite best endeavours, seems prone to regular damage. In the interim, this weakness can best be overcome by installing the signal cable in short lengths of pre-jointed cable (say 25m, 50m long each) with a stock of spare cables held on site. The system can be configured to send out alerts in the event that the signal is lost (e.g. due to cable breakage).
- Designers to calculate and specify trigger levels in terms of
- Installation of additional Fibre Bragg Gratings within the cable to obtain more measurement points around the arc of the
- Installation of double FBGs, in the near and far face, could provide a better understanding of the stress/strain development in the
Pressure cells and/or FBG strain monitoring could be used for long term remote monitoring of primary and secondary linings to ascertain the degree of load sharing between double shell or composite SCL linings. This would also require waterproofing penetration details to be developed for the cables.
Conclusions
The amount of instrumentation and monitoring needs to reflect the complexity, nature of the design and associated hazards and level of risk. This was the reason why Dr. Sauer & Partners prescribed the use of the absolute displacement monitoring together with measurements of pressure. The opportunity to monitor also strains with fibre optics was seen as highly beneficial by all involved parties and provided a unique and direct comparison with two established systems – pressure cells and absolute displacements.
The particular location selected (tunnel RTE2) was within a Compensation Grouting zone, and in close proximity to the westbound TBM and the ETH shaft, and was subsequently subjected to stress changes due to the proximity of CH2 and ES2 construction. The enhanced instrumentation ensured the validity of the design of RTE2, which successfully utilised a steel fibre reinforced SCL without any reinforcement, and without the necessity for a secondary lining to withstand these additional stresses.
This paper in detail compared and reviewed available data from all three monitoring systems and concluded that there were inherent frailties in all methods. Fibre optics proved to be a strong competitor to pressure cells and authors would not hesitate to specify and use them in the future for critical areas where traditional manual absolute displacement measurements are considered insufficient.
References
[1] Dassault Systemes Simulia 2011. ABAQUS Analysis User’s Manual-V6.12.
[2] Gakis, A., Cabrero, P., Entwisle, D., Kessler, H. (2015). 3D geological model of the completed Farringdon underground railway station. Crossrail technical papers competition 2015.
[3] Gakis, A., Salak, P., St.John, A. (2015). “Geotechnical Risk Management for Sprayed Concrete Lining Tunnels in Farringdon Crossrail Station”. Thomas Telford and Crossrail pp 349. ISBN 978-0-7277-6078-4.
[4] Jones, B.D. (2005) “Measurements of ground pressure on sprayed concrete tunnel linings using radial pressure cells”. Proc. Underground Construction 2005, London, UK, on CD-ROM (eds. K. Bowers and D. Court). Brintex, 2005.[5] Jones, B.D. (2007) “Design of SCL tunnels in soft ground using Eurocodes”. ECCOMAS Thematic Conference on Computational Methods in Tunnelling (EURO:TUN 2007) J. Eberhardsteiner et.al. (eds.) Vienna, Austria, August 27-29, 2007.
[6] Jones, B.D., Clayton, C. R. I., Thomas, A.H. (2004). “Interpretation of pressure cells in sprayed concrete tunnel linings”. Rock Engineering Theory and Practice, Proc. Of the ISRM Regional Symp. Eurock 2004 & 53rd Geomechanics Colloquy (ed. Schubert), Salzburg, Austria, pp.233-236. Essen: Verlag Glückauf GmbH.
[7] Jones, B.D., Stärk, A. & Thomas, A.H. (2005). “The importance of stress measurement in a holistic sprayed concrete tunnel design process”. In Proc. Int. Cong. Tunnelling for a Sustainable Europe, Chambéry. Lyon: Spécifique JLP.
[8] O’Donnell, J., Nonsenzo, G., Preston, J., Sturman, T. (2015). “Installation of Optical Fibre based sensors within sprayed concrete lined tunnels to measure strain and temperature”. Thomas Telford and Crossrail pp 489. ISBN 978-0-7277-6078-4.
[9] St.John, A., Potts, V., Perkins, O., Balogh, Zs. (2015). Use of TBM pilots for large diameter SCL caverns: Crossrail C300/C410. WTC / ITA proceedings pp734, Promoting Tunnelling in SEE Region 2015. ISBN 978-953-55728-5-5.
-
Authors

Petr Salak Eur Ing, MSc, CEng MICE - Dr Sauer & Partners Ltd
Design Manager, Dr. Sauer & Partners Ltd
Angelos Gakis Dr. Dipl-Ing, MSc DIC, CEng MICE - Dr Sauer & Partners Ltd
Chief Geotechnical Engineer, Crossrail Farringdon Station

Adrian St.John, BEng (Hons) Eur Ing FICE CEng - BAM Ferrovial Kier
Adrian St.John is a Fellow of the Institution of Civil Engineers and a Supervising Civil Engineer. He has spent most of his 24 year career working on major infrastructure and tunnelling projects in the UK and overseas, including the Brighton Stormwater tunnel and High Speed 1 at St Pancras. He spent 6 years as Chief Engineer for BFK Joint Venture who were the main contractor on Crossrail contracts C300, C410 and C435, and is the Design Director for Carillion Eiffage Kier (CEK) Joint Venture bidding for the forthcoming HS2 main civil works.
