The Protection of the 400kV Cables at Pudding Mill Lane
Document
type: Technical Paper
Author:
Alex Evans, IEng MICE, ICE Publishing
Publication
Date: 03/11/2014
-
Abstract
The ground movement assessment and associated mitigation measures for the National Grid Electric 400kV power cables at Pudding Mill Lane, has been the subject of extensive debate and analysis since the commencement of the Crossrail project.
These power cables are very sensitive to ground movement and hence elaborate schemes were developed for asset protection. A refined ground movement assessment was undertaken to ascertain the risk to the cables. This assessment concludes that ground improvement works alone, would be sufficient to protect the cables. The settlement predictions where undertaken by standard Empirical assessment, modifications to the Empirical method (accounting for ground treatment stiffness) and Finite Element Modelling. The report details the good correlation of maximum settlement between the modified Gaussian method and the Finite Element Modelling, in the order of 25mm.
The observed movement shows that the most critical period for the cables were during the ground treatment phase, where a narrow heaved profile was observed. Analysis was undertaken at this point to ascertain the strain on the cables during depressurisation and tunnelling. This analysis summarised that the tunnel excavation would provide a relaxation in strain that could have built up in the cables during ground treatment.
The Eastbound TBM excavation was undertaken with minimal surface settlement (10mm), equating to a volume loss of 0.5%. The observed movement showed two distinct settlement profiles either side of the TBM, due to the extent of the ground treatment works.
-
Read the full document
Introduction
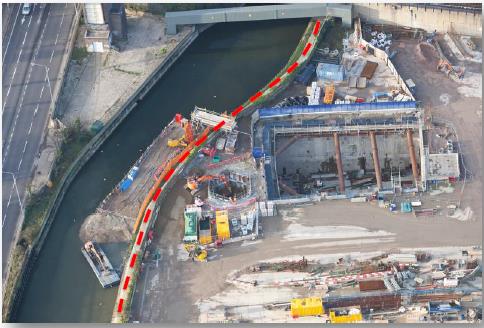
The launch of tunnel boring machines from portals can be problematic, due to shallow cover which is usually accompanied with poor ground conditions. In the case of the Crossrail Drive Z bored tunnels this was further exasperated with the close proximity of six sensitive 400kV cables. These cables are a strategic power supply for Central London providing a key route for power throughout Greater London, protecting these cables was critical to the Crossrail project. The asset owners, National Grid, were consulted about the works that would be undertaken adjacent to their asset throughout the project.
Figure 1 – Location of the National Grid Power Cables.
The power cables are located in a rudimental cable trough positioned in the tow path of the River Lea. It is understood to be continuous and of the same construction along the whole length of the interface at Pudding Mill Lane. The oil cooled cables are highly sensitive to ground movements, any rupture of the outer sheaths would result in the oil draining, if unmanaged, the cables would overheat and subsequently this would be followed by ultimate state failure. The critical factor to protect these cables is at joint bays where an extension in length of the cable could result in the cables pulling apart. This creates a risk of large pull out forces that would hinder any reconnection.
During the Parliamentary Undertakings stage of the project a protection scheme was outlined and subsequently developed during the proceeding detailed design stage. This complex scheme involved physical intervention to the cables, to divert them onto a piled protection bridge. This intervention would expose the cables to a significant level of risk.
During the detail design stage, a further ground movement assessment was undertaken to establish the magnitude of movement to the cables to quantify appropriate mitigation. This paper will discuss the design of ground movement mitigation measures and will review the observed movement against that predicted.
Ground Treatment
The design philosophy of the ground treatment was to reduce the settlement of the cables through creating a block of improved ground. This stiffened ground would form an arch above the bored tunnels across the cone of settlement above the TBM, hence reducing the surface settlement. The analysis was undertaken as an arch, as opposed to a beam, due to the low tensile capacity of ground treatment, hence utilising the arch length when in compression.
The ground treatment specification, for asset protection purposes, required the ground treatment to provide a grouted block of 2m depth with a UCS of 300kPa. This was based on calculations that analysed the arch geometry (height and length) that could be formed within the grouted RTD above the tunnels.
Ground Conditions
The geology of the area to the west of Pudding Mill Lane portal comprises the Lambeth Group overlaid progressively by Harwich Formation, London Clay, River Terrace Deposits, Alluvium and Made Ground. Table 1 details the ground stratigraphy, taken from local borehole information.
Top of Stratum Approximate Level (mATD) Made Ground (Ground Level) 104.6 Alluvium 102.2 River Terrace Deposits 100.6 London Clay 98.5 Harwich Formation 94.6 Lambeth Group 92.7 Table 1 – Summary of ground stratigraphy.
The intent of the grouting was to modify the engineering properties of the River Terrace Deposits. In the terms of settlement predictions, the tunnel settlement would have a wider settlement trough. A gravel material would utilise a k value less than 0.5, with the intent of the grouting to increase this to very stiff clay, at least 0.5 or greater.
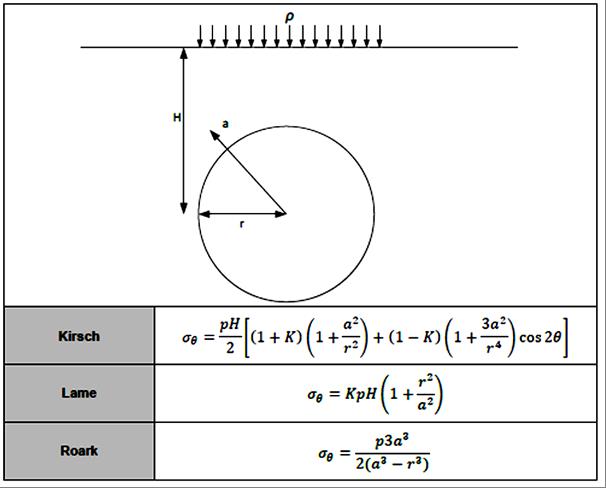
The arch length was utilised to establish a reduction factor for settlement. The grouted block was checked to ascertain the elastic-plastic deformation that would occur around the tunnel. This was undertaken using three approaches based on the theory of thick walled cylinders.
Table 2 – Formulae for stress around circular tunnels.
The Kirsch and Lame formulae provide an upper and lower bound envelope for stress around the tunnel respectively. This was used to ensure that the UCS specified was sufficient to ensure that the ground treatment would not be over stressed and deform into its plastic state. Therefore ensuring the ground treatment would provide suitable support to the increased stress around the tunnels and be able to reduce ground settlement.
Ground Treatment Verification
The design of the ground treatment to achieve the minimum requirements was undertaken by the Contractor and therefore this will only be briefly outlined in this paper.
The methodology treating the area beneath the 400kV cable involved installing horizontal TAMs, where the first two phases used a cementatous mix to provide an increased strength to the ground. This was then followed by two phases using a silicate mix to fill the remaining voids.
Insitu cone penetration tests (CPT) where undertaken in the ground treatment zone to verify the unconfined compressive strength of the ground treatment. The results demonstrate that the 300kPa UCS design requirement was generally achieved across the required ground treatment zone.
Ground Movement Analysis
The assessment was initially undertaken with a TBM volume loss of 0.5%, as the Drive Z tunnels where to be received at the portal. This was subsequently modified to 1% volume loss, as the TBMs would be launched from the portal.
The analysis undertaken assumes that no slip occurs between the ground, cable trough, cable surround and the cables. In reality there would be some slip between these surfaces, however it is difficult to quantify and would require the cables to be exposed. This level of analytical detail would not provide any substantial benefit to the protection of the cables. This paper assumes Greenfield settlement prediction and that the observed movement is also Greenfield, i.e. observed ground movement of the cable trough has been directly transpired to the cable. Reality is that the movement of the cables would be less than observed movement as they are protected from Greenfield movement by the concrete trough.
The empirical Gaussian method for ground movement prediction does not provide a sufficient mechanism to account for the improved characteristics of the ground. The ground movement assessment was undertaken in a phased approach, starting with the Gaussian method, then a modification factor and finally finite element analysis. This approach ensured a level of confidence in the prediction of settlement, due to the unique nature of the improved geology.
Standard Gaussian Method
The empirical surface settlement equation utilises a k factor to crudely represent the geology, influencing the shape of the settlement trough. Whilst this factor provides suitable predictions for Greenfield movement for well tunnelled materials in London, applying a k factor to the modified geology at the commencement of the Drive Z tunnels, would be too conservative and provide an unrealistic prediction.
For London Clay a k of 0.5 is usually the most suitable, for a gravel material like that above the tunnels at the
400kV cable (River Terrace Deposits), lower k values may be more realistic. This would provide a steeper trough and a greater magnitude of settlement. However in the case of the treated River Terrace Deposits they where thought to behave in a stiff manor, therefore the k value could be 0.5 or above. The minimum aim of the grouted River Terrace Deposits was to provide London Clay geology or better.
Modified Gaussian Method
A simplified approach was initially undertaken to quantify the reduction in settlement, from the ground improvement. As discussed previously the basis of the ground treatment design involved establishing the length of arch formed within the grouted block. For the minimum specified ground treatment parameters (2m deep with 300kPa UCS), an arch length of 6m was calculated. This was used to establish a reduction in surface settlement from a theoretical bridging of the subsurface settlement trough, at the underside of the ground treatment.
The arch was assumed to bridge 3m either side of the peak settlement (Smax) at the point of origin of the arch (S1 and S2) the settlement was obtained and used to establish a ratio against the peak surface settlement. This ratio was then used to reduce the surface settlement, accounting for the benefit from the ground treatment works.
Figure 2 – Reduction Factor Equation for Ground Treatment Arch.
During the ground treatment works the geological conditions where found to be slightly different. It showed that the RTD varied in depth (2m at portal to 1.5m beneath cables). Therefore the depth of grout block that could be successfully achieved was 1.5m under the cables, providing a ground treatment arch length of 5m. The analysis showed that a 1.5m deep grout block would provide a 16% settlement reduction in maximum settlement to that calculated with the Gaussian method.
Subsequently the design requirements, for asset protection, where changed so that the River Terrace Deposits alone would be treated. This decision was cognisant of the movement generated during the grouting works (Section 4.1).
Finite Element Analysis
A finite element analysis was undertaken to provide the client and asset owner with greater confidence in the predicted settlement performance of the ground treatment. In addition, it was used to model a cofferdam excavation to avoid the corner effect issue in software packages developed for settlement analysis. The modelling was undertaken in a staged approach, the ground treatment influence was only modelled for the TBM excavation stages.
The Made Ground, Alluvium and River Terrace Deposits were modelled using an elastic-plastic Mohr- Coulomb analysis. The London Clay and Lambeth Group where modelled using the BRICK model. The ground treatment was modelled using stiffness (Eu) to compressive strength (Cu) ratio of 1000:1. The FEM analysis, without the ground treatment, was calibrated against the Greenfield Gaussian curve.
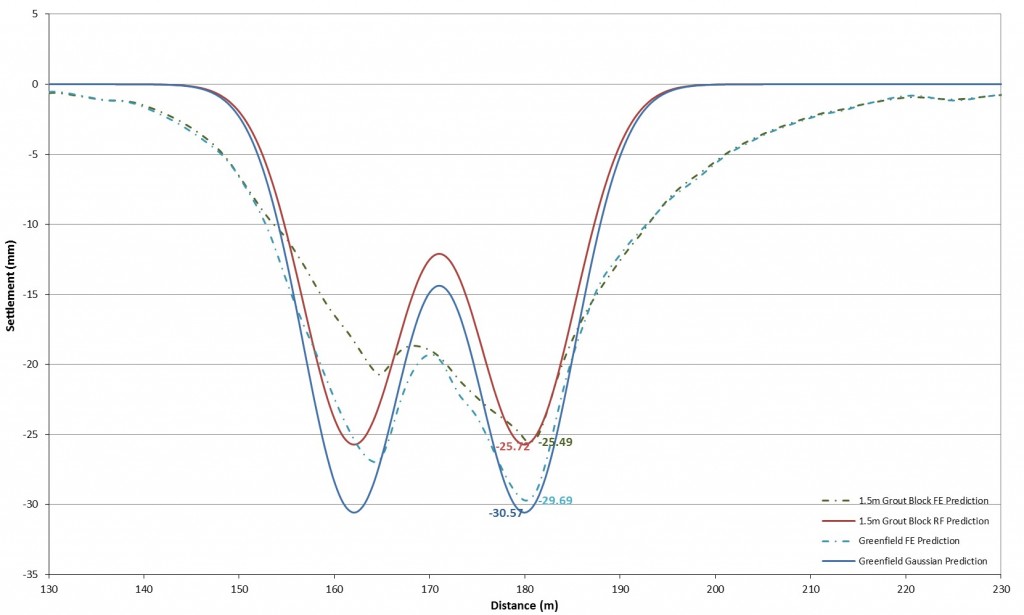
The FEM results found that for a 2m deep ground treatment block the maximum final stage settlement was 22mm (with RF method Smax 24mm). The reduction factor method and FEM gave comparable results. Further FEM analysis was undertaken for the reduced depth of ground treatment (1.5m). Again there was excellent correlation of peak settlement, with both predicting a final stage Smax of around 25mm.
Figure 3 –Settlement Predictions for 1.5m Deep Grout Block.
The FEM analysis, taking account of the ground treatment, predicted a wider settlement trough than the Gaussian settlement. This prediction is inline with the previously discussed hypothesis that the grouting would act in a stiffer clay like manor, with a k value greater than 0.5.
Observed Ground Movement
To monitor the movement subjected to the cable precise ground levelling points where installed on the surface (studs on cable trough) and subsurface (1.5m deep studs) adjacent to the cable trough. The observed movement during the ground treatment phase showed heave, this was mainly attributed to the hydrofracture grouting in the Alluvium which was subsequently halted. The grouting parameters where also modified to control the heave. The most influential change to the works was the implementation of additional monitoring that involved reading levelling points, locally above the grouted TAM. Alert values were established to stop works, causing excessive movement to the cables. This provided real time control of heave during the ground treatment works.
Implications of Heaved Ground
The lifted profile of the ground would have theoretically caused strain in the cables, the profile that was observed (Figure 4) was of similar shape to an inverted Gaussian settlement trough. A back analysis of the data using the Gaussian method was undertaken to establish the theoretical strain in the cables.
Figure 4 – Calculated Strain From Ground Treatment.
The tension and compression zones remain positioned either side of the point of inflection as described in the Gaussian function; the compression zone is the central area of the settlement trough. The rationale was based on the beam bending theory, using the extreme fibre at ground level replicating the theoretical state of strain (tension or compression) within the cable.
Whilst the magnitude of the movement was within the vertical trigger, the heaved shape was steeper than calculated for the TBM settlement where a k=0.5 and VL=1% where used. The regression analysis for the heave prolife found a k=0.45 and VL=1.28%. With these Gaussian curve parameters the calculated axial strain was greater than predicted. During this period the cables remained operational and critically the oil level remained stable.
Updated Assessment for Tunnelling
As the tunnels are excavated a Gaussian settlement trough would develop. However, the lifted profile caused a unique scenario where the post tunnelling settlement profile would not be in the Gaussian function.
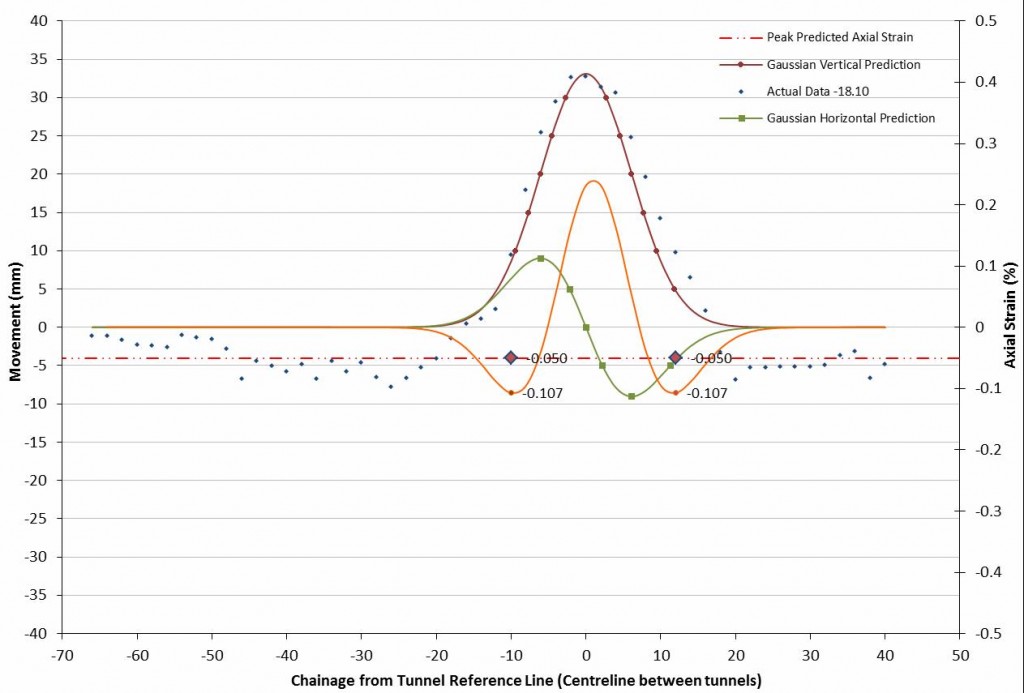
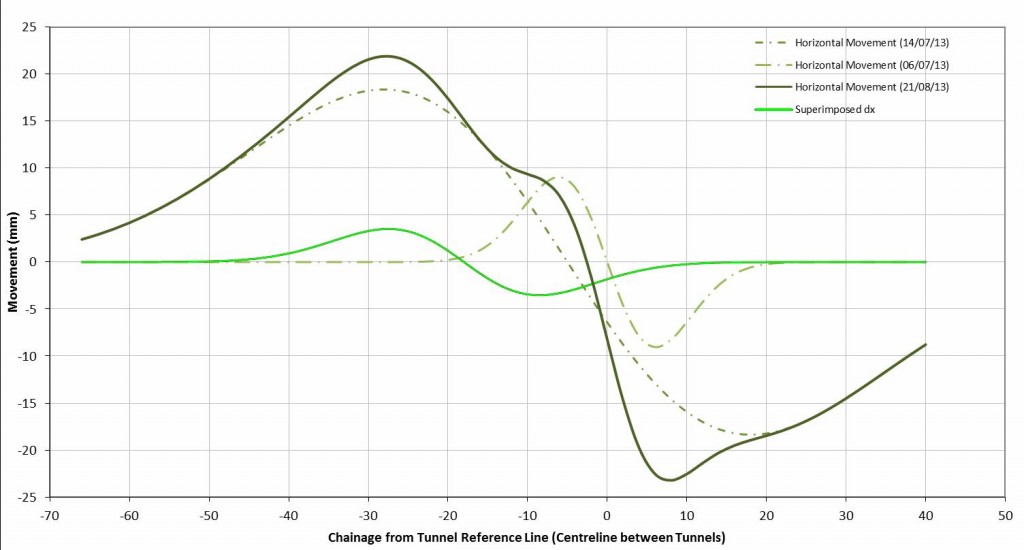
To quantify the strain along the cables imposed during tunnelling, the horizontal movement prediction was superimposed over the theoretical horizontal displacement from observed movement (Figure 5). A direct axial strain calculation was then undertaken.
Figure 5 – Superimposition of Horizontal Movement.
A horizontal superimposition method was undertaken, as opposed to vertical superimposition and calculating the horizontal movement. This was because the vertical profile created after the TBM excavation was not a Gaussian function and therefore, in this instance, the empirical horizontal formulae was not an appropriate methodology.
To ascertain the total predicted settlement on the asset, the vertical settlement prediction for each TBM, was superimposed against the observed movement. The settlement prediction for the eastbound tunnel was 18mm and for the westbound tunnel 20mm, with the predicted final stage TBM settlement of 25mm.
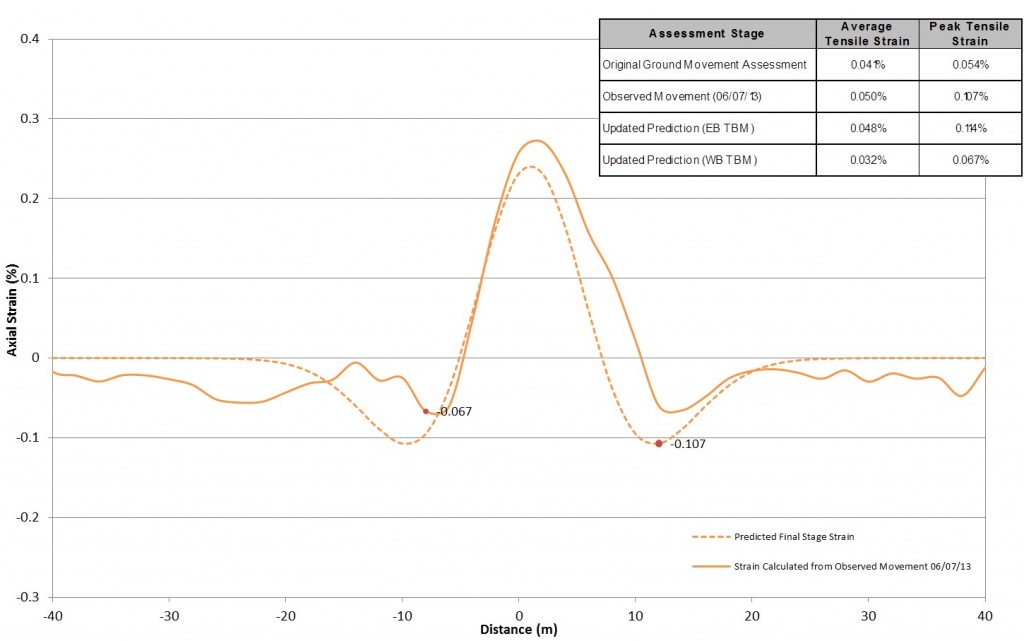
The associated theoretical strain was calculated for the passage for each TBM, incorporating strain from the observed ground treatment movement. The analysis showed that for the EB tunnel excavation, the theoretical average strain (0.048%) is comparable to the average axial strain originally calculated (0.041%). The calculated peak strain would slightly increase from its current value, to a peak strain of 0.114% during EB excavation. Immediately after the peak heave was observed, some consolidation was observed therefore the predicted increase in strain for the EB excavation, would not actually be evident this is discussed in greater detail in Section 4.3.
For the excavation of the WB tunnel, the TBM influence zone reduces the magnitude of change in settlement along the trough and hence reduces the axial strain (i.e. the TBM settlement trough smooth’s out the settlement profile). The final stage average strain prediction is 0.032%, with the peak final stage strain predicted to reduce to 0.067%. The theoretical strain from the observed movement and predictions is summarised in Figure 6.
Figure 6 – Observed Strain (06/07/13) and Final Stage Prediction.
The lifted position of the cable provided a unique scenario. The mitigation intended to protect the cables during tunnel excavation actually required the TBM to provide strain mitigation.
Tunnelling Preparation
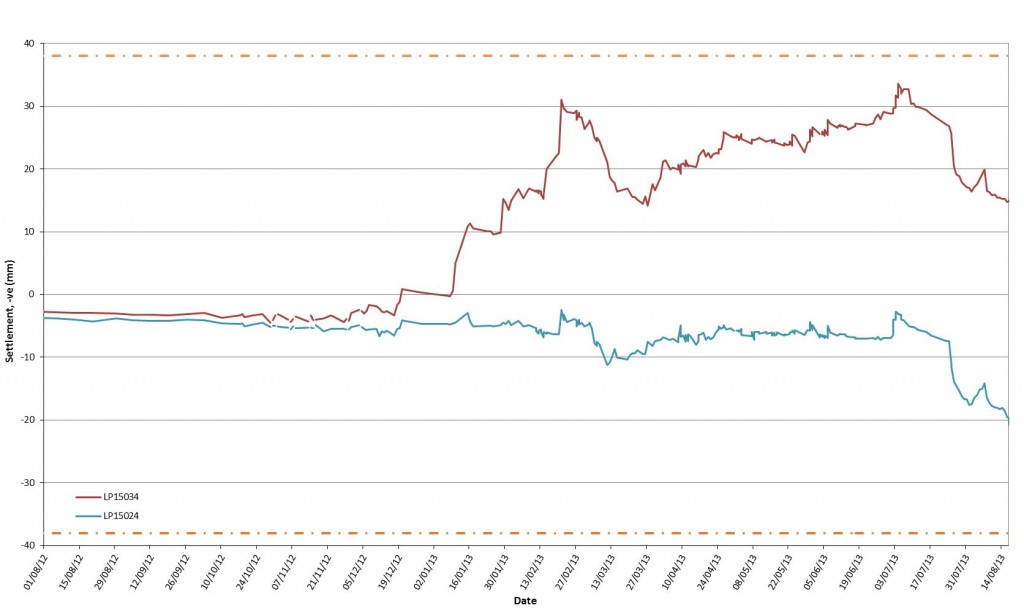
Following the observed peak heave, gradual consolidation settlement was noted. This is believed to be the increased pore water pressures, created during the ground treatment, naturally draining. This consolidation settlement was exasperated when the depressurisation works commenced. The depressurisation movement can be seen in Figure 7, from July 2013 to August 2013.
Although the depressurisation scheme was for the lower aquifer, it is believe that there was connectivity with the upper aquifer. This hypothesis has been drawn from the observed water level before depressurisation and the manner in which the cables settled post ground treatment. There are four clear trends in the movement of the cable trough;
1. Initially a gradual settlement (3mm / day) from the natural consolidation of the ground;
2. Followed by an increased settlement response (2.3mm / day) when the depressurisation commences,
3. Thirdly a slower settlement (0.6mm / day) once the depressurisation is in operation, and
4. Finally observed swelling (0.7mm / day) of the ground when the depressurisation is temporarily stopped.Figure 7 – Vertical Movement of Cable Trough, range of observed data.
Tunnelling Settlement
At the time of writing this paper only the Eastbound TBM had passed beneath the 400kV power cables. The second machine will be launched at a later date.
A depressurisation scheme for the Harwich Formation was implemented to improve ground stability. The intent was to increase the proficiency of the TBM to balance face pressure, with the aim of improving surface settlement control. The FEM analysis was undertaken for undrained conditions, as the ground was now in a drained condition, the FEM assessment would theoretically predict less than 18mm for tunnelling. However, this would be offset by the additional settlement generated during depressurisation works. This sensitivity analysis was not undertaken, as it was deemed to be very convoluted and would have no material benefit to the ground movement assessment and impact to the 400kV cables.
The horizontal monitoring recorded negligible movement (less than 1mm extension) during depressurisation and tunnelling. When compared to the vertical movement during the same period (14mm), the horizontal stiffening influence of the cable trough can be clearly identified. The Gaussian horizontal movement for this magnitude of vertical movement predicts a horizontal extension in the order of 4mm. It was known that the cable trough would provide a stiffening effect, although it was thought that a greater change in horizontal movement would be observed.
This hypothesis also provides a view that the theoretical strain in the cable trough, during the ground treatment heave, may not have developed. The explanation for this is that slip has occurred between the cable trough and the surrounding ground. As the cable trough is very long, acting as a very deep beam in the horizontal plane, the stiffening effect is much larger than in the vertical plane. Therefore the cable trough has a greater tendency to follow the deformed ground profile in the vertical direction.
Observed Movement of Cable Trough
During the passage of the Eastbound TBM the settlement observed ahead of the TBM face was 10mm, slightly more than half the predicted value (18mm). This was reflected in the TBM excavated material volume balance, where there was very good correlation of observed excavated material volume to theoretical excavated volume.
There was minimal movement observed from convergence of the ground onto the TBM shield. This was attributed to the depressurised Harwich Formation below axis, the presence of London Clay above axis and bentonite support around the TBM shield.
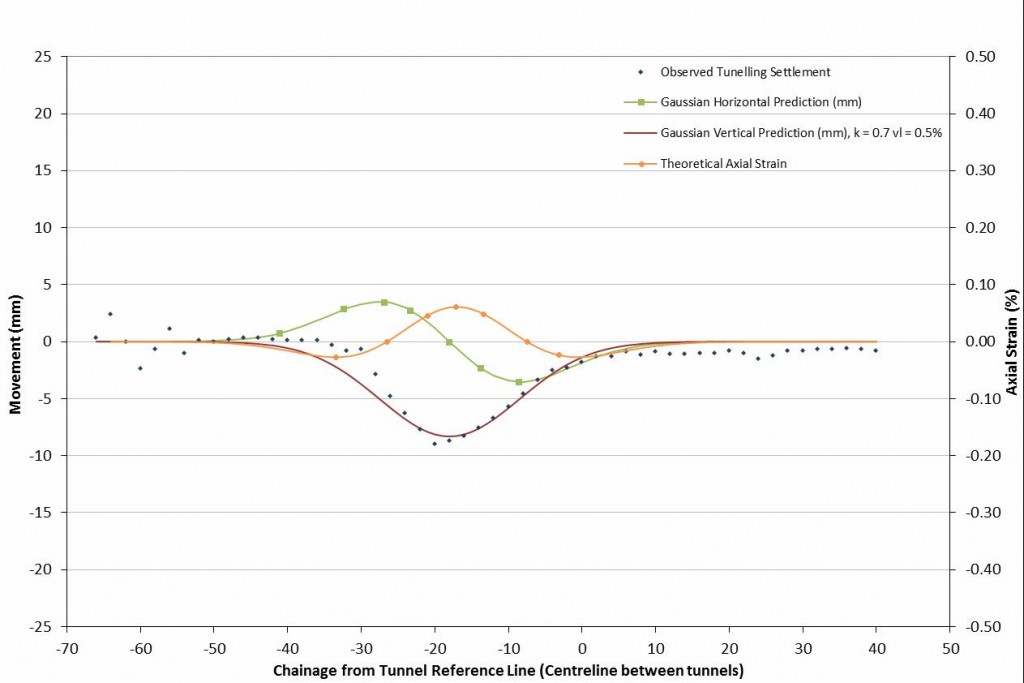
Figure 8 – Regression Analysis for Observed Tunnel Movement.
During the build stage of the first ring beneath the cable (Ring #11) slight heave was observed (2mm). This was attributed to the tail skin grouting around the ring. In this location the cover is reduced, so it is believed that this caused heave of the cable trough. This hypothesis is enforced by the observations of heave during the grouting works, and more saliently, the heave during depressurisation recharge.
Following the passage of the TBM it was observed that for the second and third permanent rings built under the cable (Ring #12 and Ring #13) no heave was recorded. These rings were passed the River Lea retaining wall and therefore the influence of the grouting pressure is not evident at the surface, due to the sheet pile retaining wall providing protection.
A regression analysis for the movement of the EB tunnel shows that a volume loss of 0.5% was achieved with a k factor of 0.7. This is in agreement with the theory discussed earlier in the paper, where the intent of the ground treatment was to stiffen the ground and hence increase the k value.
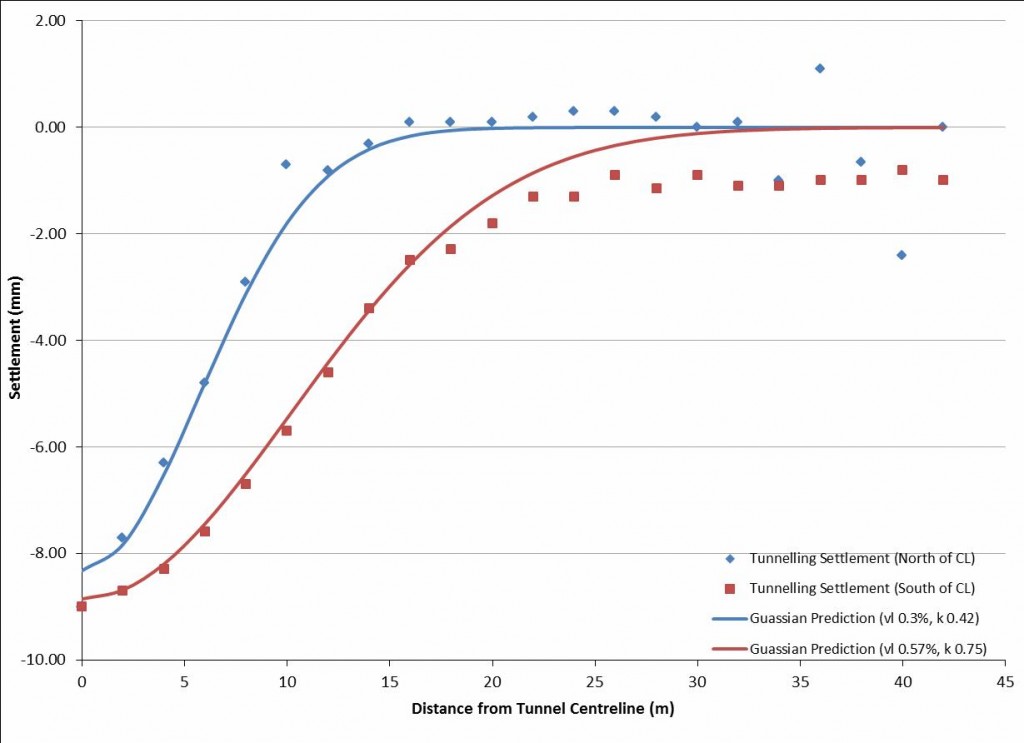
The observed movement shows two distinct trends (Figure 9), a steeper trough for the monitoring points to the north of the tunnel centreline and a more graduated settlement profile to the south. This provides an indication of the influence of the grouting works. The ground treatment has a shorter extend to the north of the EB tunnel than to the south. If separate regression analysis is undertaken either side of the tunnel centreline, the k value and volume loss are significantly different.
Figure 9 – Separate Regression Analysis either side of Tunnel.
The observed movement to the north of the tunnel (blue) shows a gravel ground movement response, hence a lower k (0.42). The results to the south of the tunnel (red) show a very stiff clay response with a higher k (0.75). The observations are in agreement with the hypothesis of how the ground would move and the intent of the ground treatment for asset protection.
To the south of the tunnel the ground treatment has a much larger extent and the grouting TAMs are at closer spacing. Therefore the ground treatment, along with the reinforcement influence of the steel TAMs, has resulted in a more global ground response. This is inline with the wider settlement trough predicted in the FEM analysis (Figure 3).
When comparing the observed movement to the FEM prediction, the prediction of the FEM was reduced to correlate with the observed data, so that a TBM face loss accounting for ground treatment could be ascertained. Based on this a TBM face loss of 0.60% was achieved (discounting heave during ring build), therefore a 20% settlement reduction could be ascertained from the benefit of the ground treatment and stiffening effect of the cable trough.
Observed Sub-Surface Movement
To further verify the benefit of the ground treatment, discounting the stiffening effect of the trough, the observed movement of the cable trough can be compared to the observed data of the adjacent 1.5m deep points. This monitoring array also recorded negligible movement from convergence onto the TBM shield. The settlement ahead of the TBM was recorded at around 15mm, using the Gaussian parameters used for the observed data of the cable trough (k=0.7 VL=0.5 ). The theoretical movement at 1.5m below ground is 12mm, this is less that the observed settlement (15mm).
To match the sub-surface settlement against the observed, a regression analysis used a volume loss of 0.60%, the k parameter remained unchanged. The difference between the observed movement of the 1.5m deep monitoring and the equivalent cable trough movement (3mm) can be attributed to the stiffening influence of the cable trough.
TBM Performance
The ground settlement performance of the TBM must be cognisant of the settlement caused by depressurisation. The lower than predicted settlement must in part be attributed to the improved ground stability created by the depressurisation. It is not possible to accurately quantify how much benefit this provided. A comparison can be drawn from the observed movements on the Drive Y tunnels.
In similar geology on Drive Y, where neither depressurisation nor ground treatment was undertaken, the TBM performance was around 1% volume loss. In this location the TBM volume balance was similar to that for the Drive Z TBM. However the observed data on Drive Y shows a 20-80% distribution between settlement ahead of the TBM to that across the shield and ring annulus. Therefore it can be concluded the depressurisation provide significant benefit to prevent convergence of the ground onto the TBM shield and built ring.
Conclusion
The analysis and observations made in this paper provide an insight into the art of ground treatment. There are many variables and unknowns when undertaking ground improvement. The analysis works shows that ground settlement analysis using 3D FEM provides value in assessing the influence to third party assets. It can be further expanded to incorporate and quantify the reduction of ground movement that can be achieved from improvement techniques. To fully validate the reduction factor method further analysis work is required, with different types of ground treatment schemes.
Throughout the works to date the 400kV cables remained stable and where not adversely affected by the works. The most critical part is joint bays which were well outside the zone of influence of the Crossrail works. Should the joint bay within the influence zone of the Crossrail works, then it is very likely that a different protection scheme would be undertaken. Any future works around cable joint bays must be fully aware of their critical nature, which is vastly different to the nature of the cable discussed in this paper.
The ground surface movement during tunnelling are low for a TBM being launched at shallow cover. However the movement during ground treatment works was much larger than anticipated. The most efficient way to control the movement is to provide a thorough real time monitoring regime. Whilst the pressure and volumes for the ground treatment can be limited to reduce movements, monitoring was found to be the most successful method to reduce impact to the cables. As the ground treatment changes the characteristics of ground, particularly reducing the void ration of the RTD, the theoretical grouting pressure and volume take also reduce. At this point the rheological properties of the grout mix must be changed along with the grouting pressure and volume. If possible the movement should be calibrated against the grouting parameters and modified to limit heave.
Additional work should focus on the thick wall cylinder methodology to provide a prediction of radial displacements around the tunnel and surface settlement. These methodologies take account of the Young’s Modulus and Poissions ratio of the ground treatment. The analysis should calibrate the maximum settlement for the Gaussian function against the radial displacement at surface. This can then be used to determine the reduce settlement, once the ground has been treated by modifying the Young’s Modulus and Poissions ratio.
References
Mair, R J (1993) Subsurface settlement profiles above tunnels. Geotechnique 43, No. 2, 315 – 320.
Burland, J B (1997) Assessment of risk of damage to buildings due to tunnelling and excavation, Earthquake Geotechnical Engineering 1997 Rotterdam 1189-1201.
Brady, B H G & Brown, E T (2005) Rock Mechanics For Underground Mining, Springer Science, USA. Terzaghi, K (1943) Theoretical Soil Mechanics John Wiley and Sons, inc. USA.
Young W C, Budynas R G (2002) Roark’s Formulas for Stress and Strain McGraw-Hill, USA.Notations
UCS is the unconfined compressive strength of the ground
CPT is a cone penetration test
K0 is the total stress coefficient of earth pressure
VL is the volume loss from tunnelling
k is the settlement trough width parameter
r is the radius of excavation
a is the distance from excavation centre to position of circumferential stress
H is the depth to tunnel axis
ρ is surface surcharge
MD is Made Ground
AL is Alluvium
RTD is River Terrace Deposits
LC is London Clay
TBM is tunnel boring machine
Eu is the Elastic Modulus of the ground
Cu is the Compressive Strength of the ground
Smax is the maximum surface settlement
S1, S2 is predicted sub-settlement beneath the ground treatment
RF is the surface settlement reduction factor
FEM is finite element modelling
TAM is a tubular machete
σθ is the circumferential stress around an excavation
EB is the eastbound tunnel
WB is the westbound tunnel -
Authors
Alex Evans, IEng MICE
Atkins UK, Ground Engineering
