Tunnelling induced strains and deformations at Central Line
Document
type: Technical Paper
Author:
Jessica Yu BE MSc DIC MICE, Jamie R Standing BEng DIC MSc PhD CEng MICE, Robert Vollum MSc PhD DIC CEng MIStructE, David Potts PhD DSc FREng CEng FICE FCGI, ICE Publishing
Publication
Date: 03/11/2014
-
Read the full document
Introduction
In October and November 2012, Imperial College installed electrical resistance strain gauges, potentiometric displacement transducers and tape extensometer eye bolts at selected locations in the Central Line eastbound running tunnel between Lancaster Gate and Marble Arch. The instrumentation was installed shortly before the first of the Crossrail tunnel boring machines (TBM) passed below the Central Line tunnel at this interface.
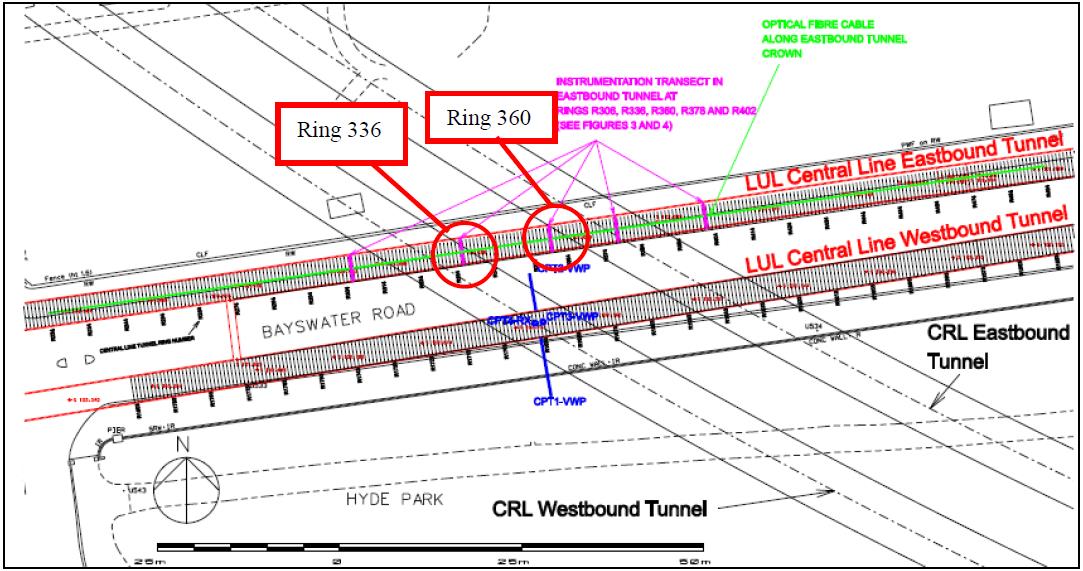
The Crossrail twin tunnels begin at Royal Oak Portal in Westbourne Park, West London, and traverse westwards towards Farringdon. The Crossrail tunnels had a clearance of 4.2m to 4.9m under the Central Line twin tunnels east of Lancaster Gate station running at approximately 40 degrees skew (Figure 1). The Crossrail westbound tunnel passed under the Central Line eastbound tunnel at Crossrail chainage 2085m. The Crossrail eastbound tunnel passed under the Central Line eastbound tunnel at Crossrail chainage 2111m.
According to the daily progress update provided by Crossrail, the westbound tunnel TBM (TBM1) cutter head passed under Central Line eastbound tunnel at around 2:00pm on the 19th November, 2012. The cutter head of the eastbound tunnel TBM, (TBM2), passed under Central Line eastbound tunnel at around 19:30pm on the 5th February, 2013.
Continuous measurements of the strain in selected tunnel segments were made before, during and after the passage of the TBM at this interface. Similarly, continuous measurements were made of any opening and/or closing of horizontal joints of the tunnel rings before, during and after the passage of the TBM at this interface. Finally, manual measurements were made of tunnel convergence and diameter/chord length changes at several rings of the eastbound Central Line tunnel before, during and after the passage of the TBM at this interface.
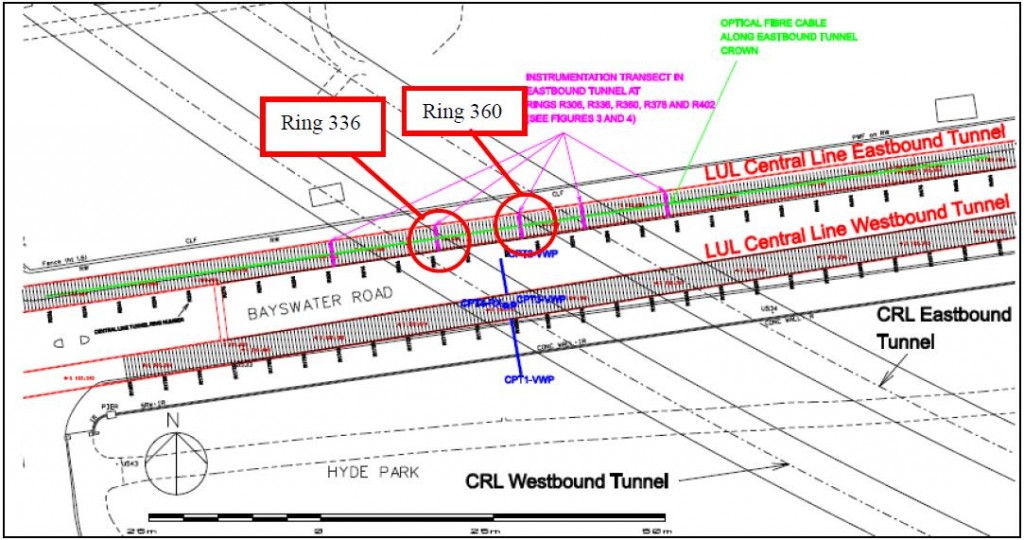
Figure 1, Plan view of Crossrail interface with Central Line east of Lancaster Gate Station
As-built locations
Table 1 summarises the locations of the instrumentation installed by Imperial College in the Central Line eastbound running tunnel.
Instrument Location Five no. strain gauges per segment Axis, and two shoulder segments on R336 and R360 Displacement transducers at 3 horizontal joints At the crown and at two shoulder level joints on R336 and R360 Seven no. temperature sensors R336 and R360 – within each datalogger unit in the tunnel Tape extensometer eye bolts at shoulder and knee levels. R305, R336, R360, R378 and R402 Table 1. Location of installed instrumentation.
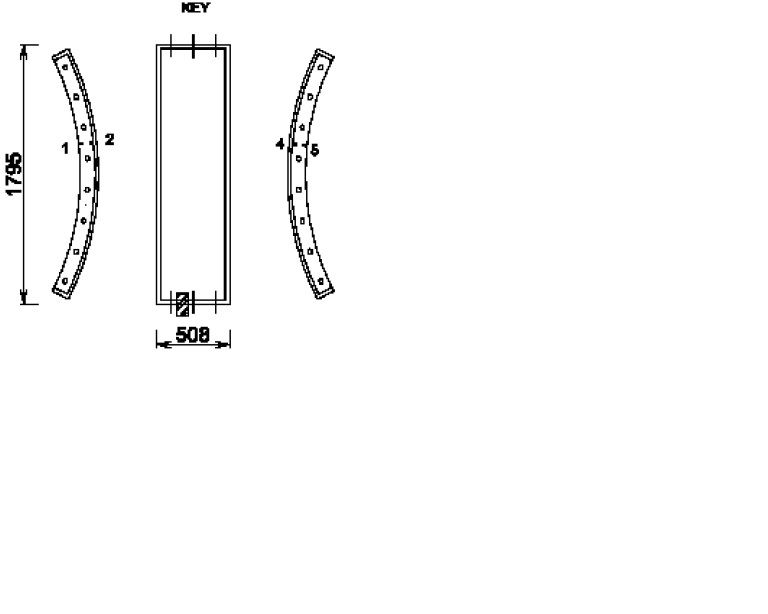
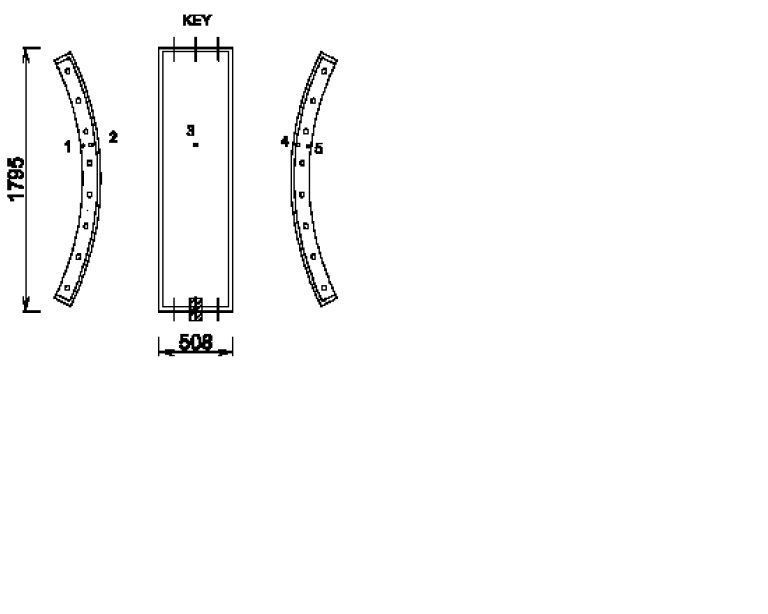
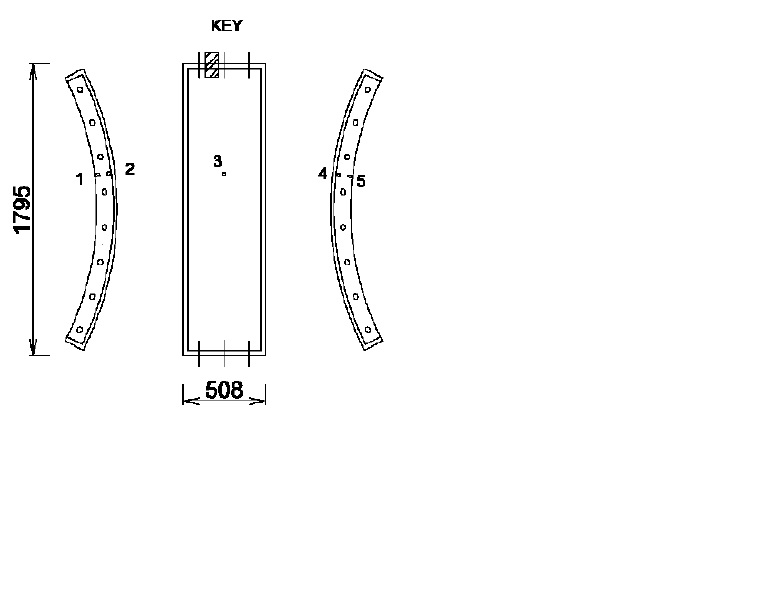
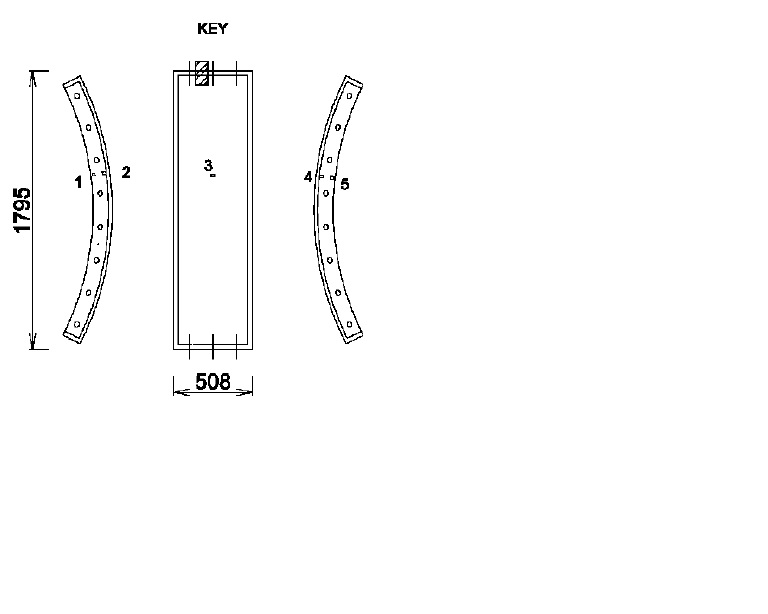
Figure 1 shows the locations of the instrumented tunnel rings in plan. Figure 2 shows the location of the instrumented segments and joints. Figure 3 shows the locations of the strain gauges on Rings 336 and 360.
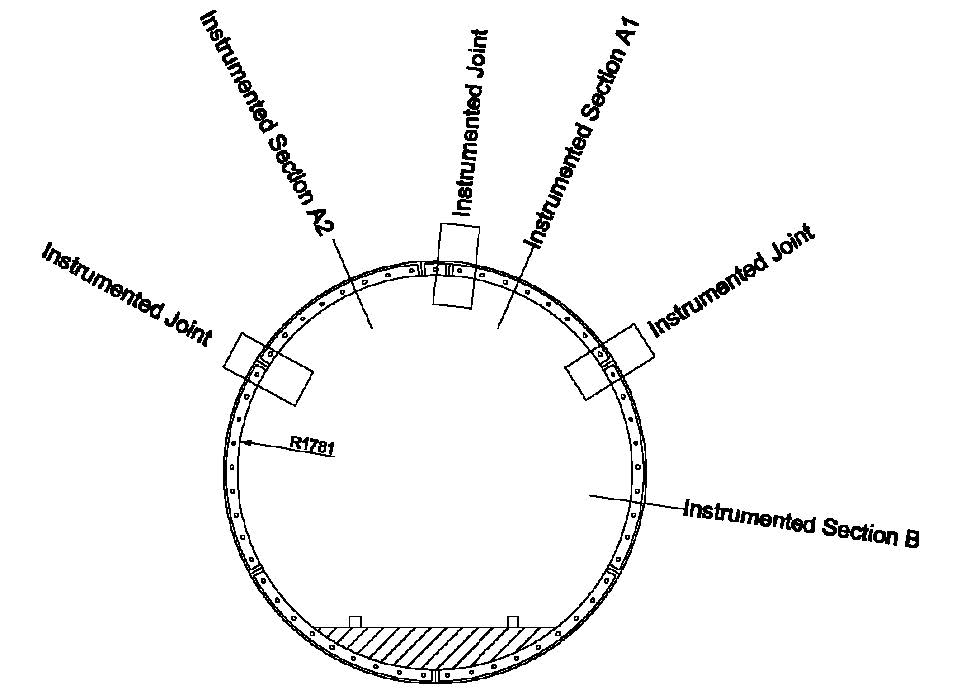
Figure 2. Location of instrumented segments and joints on ring 336 and 360
Segment A2 Ring 336
Distance from Intrados:
Gauge 1 = 13 mm
Gauge 2 = 73 mm
Gauge 4 = 73 mm
Gauge 5 = 12 mm
Ring 360
Distance from Intrados:
Gauge 1 = 12 mm
Gauge 2 = 72 mm
Gauge 4 = 76 mm
Gauge 5 = 11 mm
Segment A1 Ring 336
Distance from Intrados:
Gauge 1 = 14 mm
Gauge 2 = 73 mm
Gauge 4 = 75 mm
Gauge 5 = 15 mm
Ring 360
Distance from Intrados:
Gauge 1 = 15 mm
Gauge 2 = 75 mm
Gauge 4 = 73 mm
Gauge 5 = 14 mm
Segment B Ring 336
Distance from Intrados:
Gauge 1 = 12 mm
Gauge 2 = 75 mm
Gauge 4 = 74 mm
Gauge 5 = 15 mm
Ring 360
Distance from Intrados:
Gauge 1 = 15 mm
Gauge 2 = 75 mm
Gauge 4 = 73 mm
Gauge 5 = 15 mm
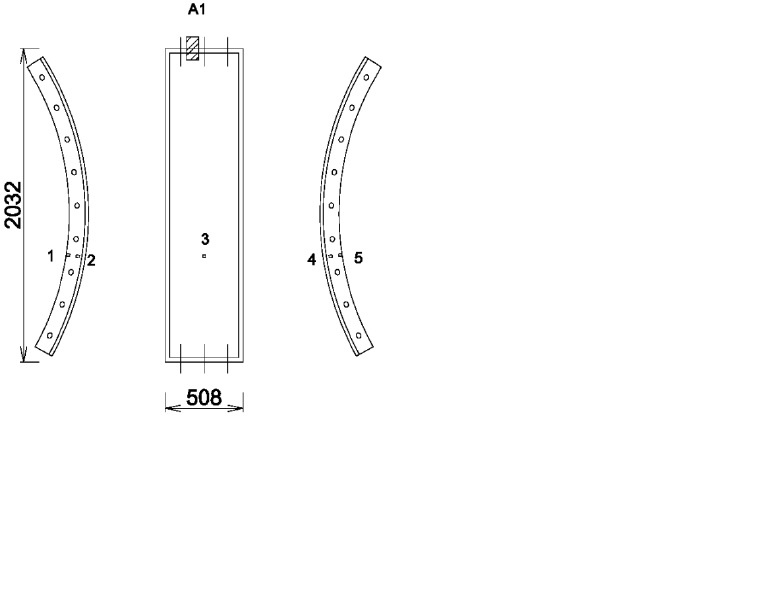
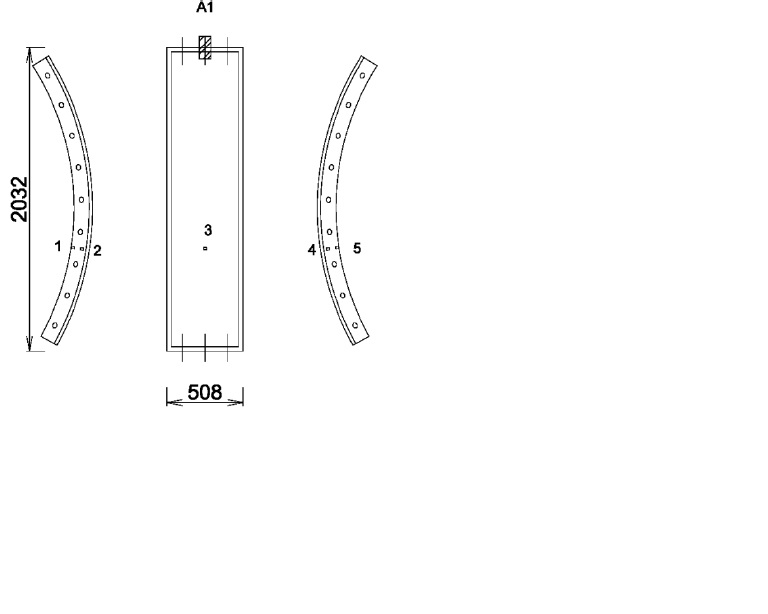
Figure 3. Location of strain gauges and displacement transducers on Ring 336 and Ring 360
The Instrumentation
Electrical resistance strain gauges
Universal general-purpose strain gauges consisting of large three-element 45° single-plane rosettes were used. Each gauge has a resistance of 350Ω ±0.4% and a strain range of ±5%. The Self-Temperature-Compensation (STC) of the gauges was 06 (in ppm/0F) to match the thermal expansion coefficient of grey cast iron which is around 10 to 12 ppm/K, i.e., 5.5 to 6.6 ppm/0F (Gilbert, 1977). The rosette matrix dimension is 16.5 by 20.3 mm.
Each gauge in the rosette was pre-wired with a 330-DFV leadwire. The leadwire was a flat cable of tinned stranded copper, and insulated with vinyl.
Displacement transducers
Potentiometric displacement transducers were used to measure any opening/closing of the horizontal joints. The transducers were supplied by Construction Monitoring Control Systems Ltd (CMCS) who were also responsible for the installation of the displacement transducers.
Temperature gauges
There was one temperature sensor placed within each datalogger unit in the tunnel. There were seven temperature sensors in total and the temperature was logged continuously.
Tape extensometer
An Ealey tape extensometer was used for taking manual measurements. The digital extensometer was able to provide a tenth of a millimetre accuracy. All the readings were taken by the same operative to ensure consistency.
The digital extensometer was hooked into eyebolts secured to the tunnel using the U-clamp system to measure the distance between two eyebolts. This allowed the tunnel convergence and diameter/chord length changes to be monitored. The tension sensor ensured the same tension was applied to the tape each time.
When the correct tension was reached, a green light switched on, and a red light indicated too much tension was applied.
Datalogger for strain gauge, displacement transducer and temperature gauge
The downloading unit on the platform consists of a power supply and an RS485 to RS232 converter through which the data from the in-tunnel loggers is transmitted.
The installation
Electrical resistance strain gauges
For the installation of the rosette type electrical resistance strain gauges, the surface of the cast iron was prepared by using a grinder to remove the ‘black crust’ until a relatively polished surface was obtained. The area to be gauged was then degreased with Isopropyl Alcohol and further polished by emery paper.
The strain gauges were bonded directly onto the cast iron surface using cyanoacrylate.
A coating consisting of butyl, rubber and foil tape was used to protect the gauges.
The leadwires were bundled together and brought down to the dataloggers by running the bundles through cable ties which were looped around and anchor glued onto the circumferential bolts.
A total of 29 rosettes, i.e. 87 strain gauges, were installed.
Displacement transducers
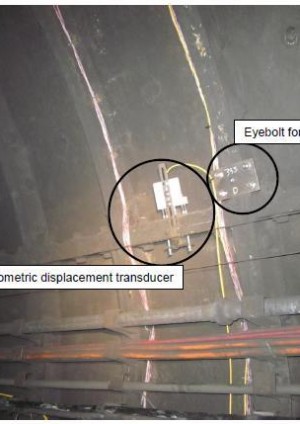
The displacement transducers were clamped onto the segments. The clamping bracket weighed about 1kg. A total of 4 springs was used to hold the bracket in place. Each spring could apply 2.1N/mm of force giving a total range of 100N-150N for all 4 springs. These springs pushed pointed rods onto the flange to hold it in place securely. The installation was done by CMCS. Figure 4 shows the installation by CMCS for Imperial College in Central Line.
The cable for each displacement transducer was brought down to the dataloggers by running the cables though cable ties which were looped around and anchor glued onto the circumferential bolts.
A total of six displacement transducers were installed.
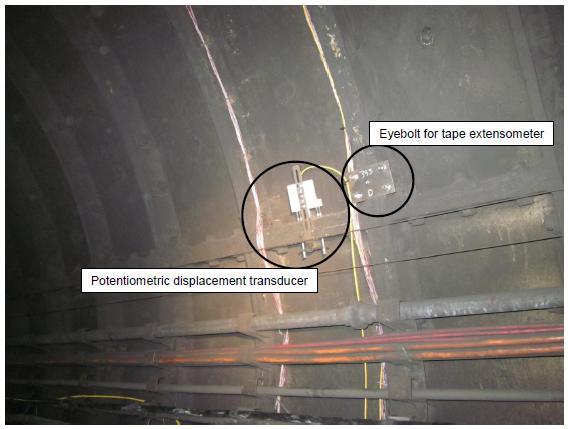
Figure 4. Photo of potentiometric displacement transducer installation by CMCS and tape extensometer eyebolt installation by Imperial College in Central Line.
Dataloggers
Datalogging units for the strain gauges, displacement transducers and temperature gauges were secured onto rings 336, 337 and rings 360, 361. The units were fixed to the segment using a bracket as shown in Figure 5. The logger box had counter sunk screws fed through the back and M6 nuts were used to secure the box on to the bracket. The weight of the logger with batteries is 3.93kg.
Initially the dataloggers were powered via two wires in a six core cable. However, because of the distance between the power supply and the dataloggers, there was significant voltage drop and resulted in data corruption. Therefore batteries were placed in the dataloggers to provide a stable power supply during the passage of the first TBM. Subsequently, a second power cable was installed to power the loggers via six wires, thus reducing the voltage drop. The batteries were no longer necessary and were removed. The voltage requirement for the loggers is 9V.
An additional datalogger unit was secured onto the headwall at the east end of the eastbound platform at Lancaster Gate (Figure 6). This unit allowed the readings stored on the in-tunnel dataloggers to be downloaded onto a laptop during non-engineering hours.
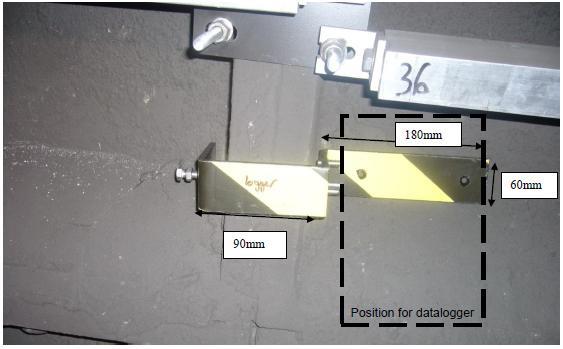
Figure 5. Bracket for securing dataloggers to tunnel segments
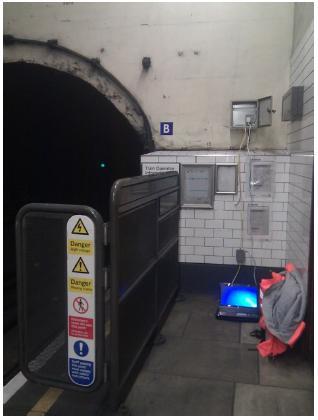
Figure 6. Additional datalogging unit on the eastbound platform headwall.
Measurements and calculations
Electrical resistance strain gauge
Prior to the arrival of TBM1, 24 hours of stable baseline monitoring was obtained for all but five gauges. The data are presented as change in strain since the 18th November 2010 after 0100 hours in Figure 7. The measurements were initially unstable due to inadequate power supply. This was corrected by installing batteries at around 1am on the 18th November.
The vertical lines on the graphs mark the time when the cutting face of the TBM was directly beneath the Central Line tunnel. For subsequent discussions and calculations, the change in strain between the initial baseline and the final stabilised readings will be termed ‘final change’.
Figure 7 gives an example of each of the three responses that was captured by the strain gauges. The title on the graph gives the location of the strain gauge. R336 or R360 refer to Central Line ring number 336 or 360. A1, A2 and B refer to the location of the segment in the ring as specified in Figure 2. ‘Outer flange’ refers to the strain gauge located near the intrados of the circumferential flange and ‘Inner flange’ refers to the strain gauge located near the extrados of the circumferential flange. R1, R2 and R3 refer to the strain gauge locations 1, 2 or 3 in the rosette (as seen in the inset in Figure 7). Finally, the ‘E’ or ‘W’ for the series on each graph indicates whether the gauge is on the west circumferential flange or the east circumferential flange of the tunnel ring.
The top graph in Figure 7 gives an example of the gauges on the east and west flanges measuring the same ‘mode’ of change, i.e. gauges at the same location but on opposite circumferential flanges would both measure either a tensile change or a compressive change.
The middle graph in Figure 7 gives an example of the gauges on the east and west flanges measuring opposite ‘modes’ of change. Three pairs of gauges displayed this behaviour. The bottom graph in Figure 7 gives an example of erratic measurement from a strain gauge (L341W). The unstable gauges are located on Ring 336 and their results are not processed further.
Figure 7 also shows that the strain gauges were detecting changes in strain in the segments prior to the TBM cutter face being directly below Central Line.
Figure 8 gives an example of the strain measurement over the period when TBM2 passed under Central Line. Unfortunately the power supply to the dataloggers was accidentally switched off for approximately 24 hours, resulting in no data when the TBM was passing under the Central Line. However, using the 48 hours of data prior to the power outage and the stabilised data collected after the TBM had passed; a ‘final change’ in strain in the segments as a result of TBM2 could still be obtained.
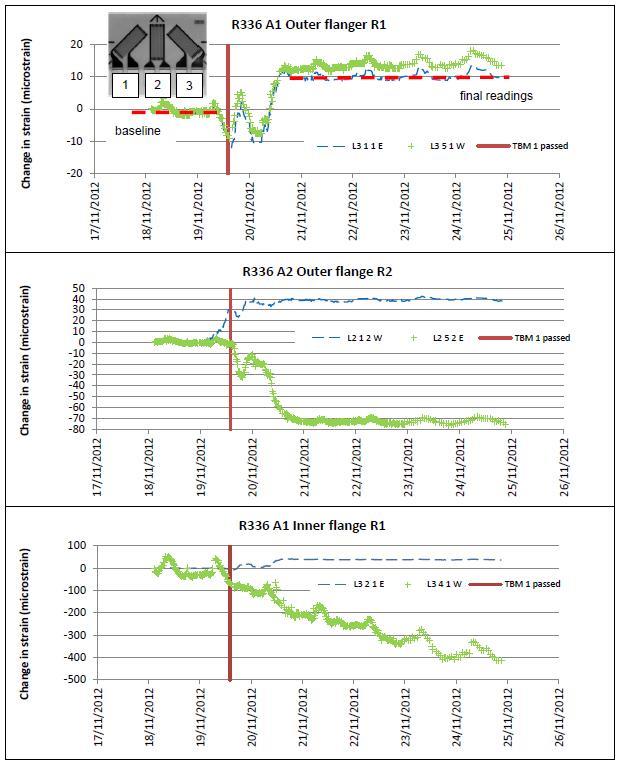
Figure 7. Typical strain gauge response for TBM1 passage showing segment bending (top), segment twisting (middle), and erratic gauge readings (bottom)
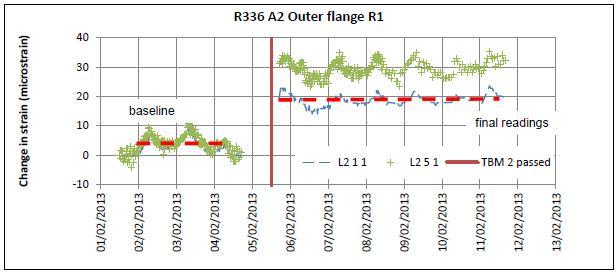
Figure 8. Typical strain gauge responses for TBM2 passage
Using the ‘final change’ strain measurements from each strain gauge in a rosette, the principal major and minor strains and the principal strain directions were calculated for each rosette location. The calculations included corrections for strain gauge thermal output and gauge factor variation with temperature. Due to the erratic gauges described above, it was not possible to calculate the principal strains at several locations on Ring 336. These locations are listed in Table 2.
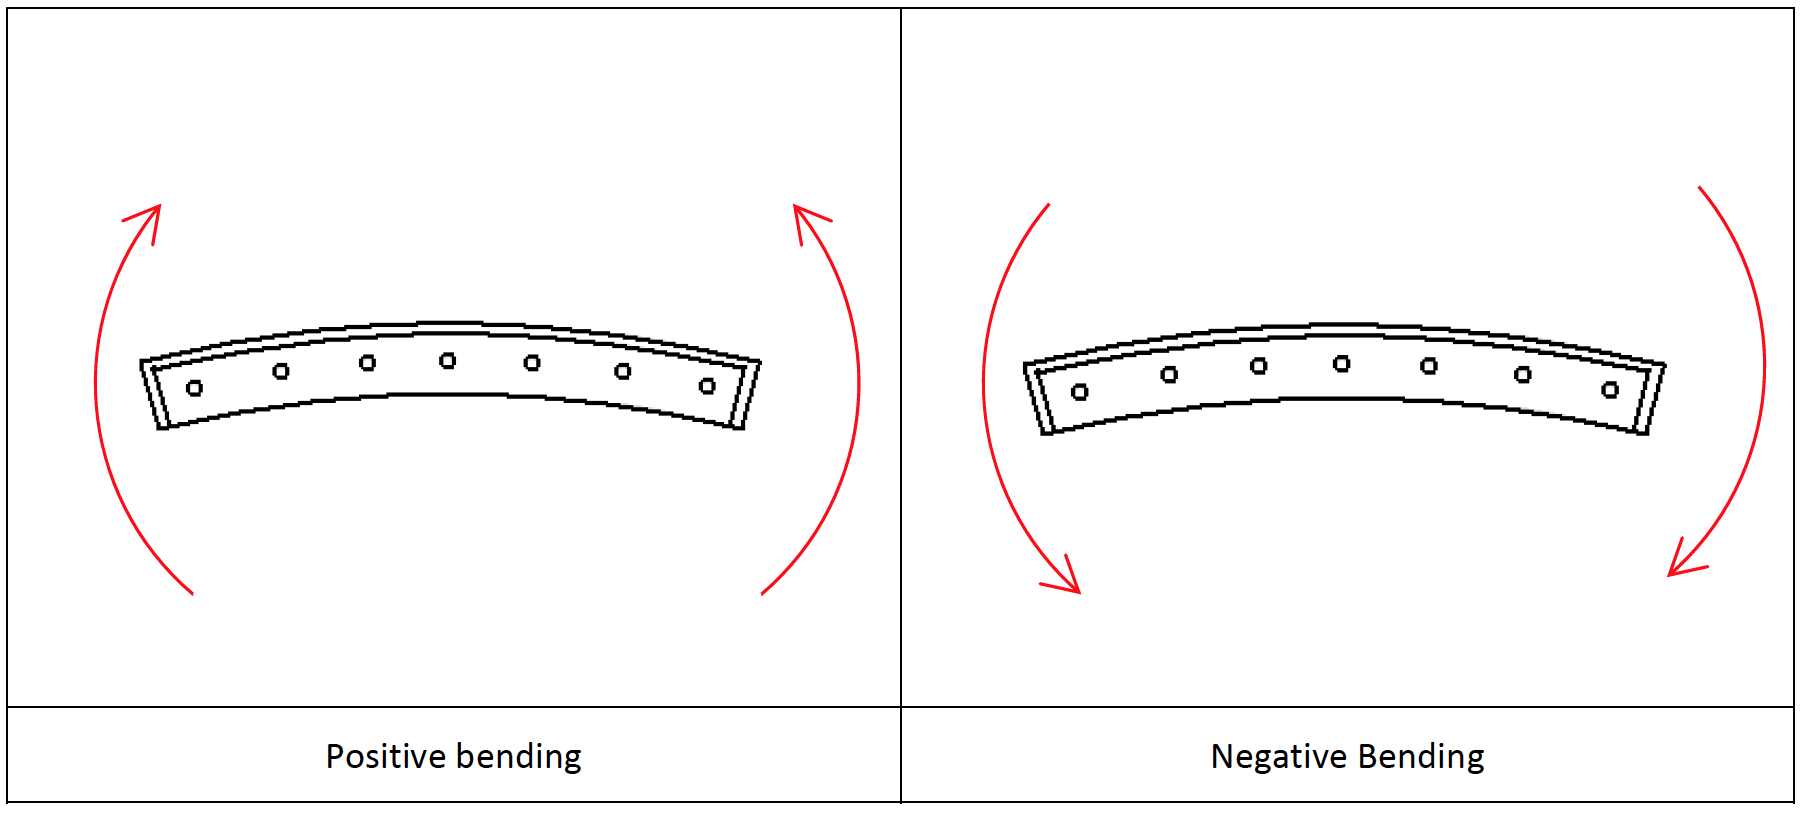
Refer to Figure 3 for the locations of the rosettes. Circumferential strain and longitudinal strain directions are defined as shown in Figure 9. Positive bending refers to the mode of bending having a straightening effect on the segment, and negative bending increases the curvature of the segment as illustrated in Figure 10.
Once the magnitude and direction of the principal direct strains on the surface of the cast iron segment was determined, the direct strains on the circumferential flange along the circumferential direction could also be calculated. The circumferential strains were used to derive the bending moment induced in the segment at the instrumented locations. The calculations assumed a linear variation in strain from the circumferential flange intrados to extrados (i.e. between inner and outer measurements), and a constant modulus of 100 GPa. Due to the erratic measurements on ring 336, only the results for ring 360 are presented in Figure 11. The curved arrows indicate the mode of bending in the segment. In all cases the calculated bending moments in the east and west circumferential flanges are in the same direction and have similar magnitudes.
It should be noted that the change in strains in the segments was more severe from the passage of the second TBM than from the combined effects of both TBM1 and TBM2.
Gauge designation Location L222 Ring 336 Segment A2 inner flange west L242, L243 Ring 336 Segment A2 inner flange east L341 Ring 336 Segment A1 inner flange west Table 2. Locations where principal strains could not be calculated due to erratic gauge measurements
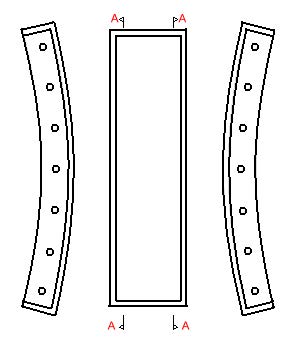
Figure 9 Directions of circumferential and longitudinal strains
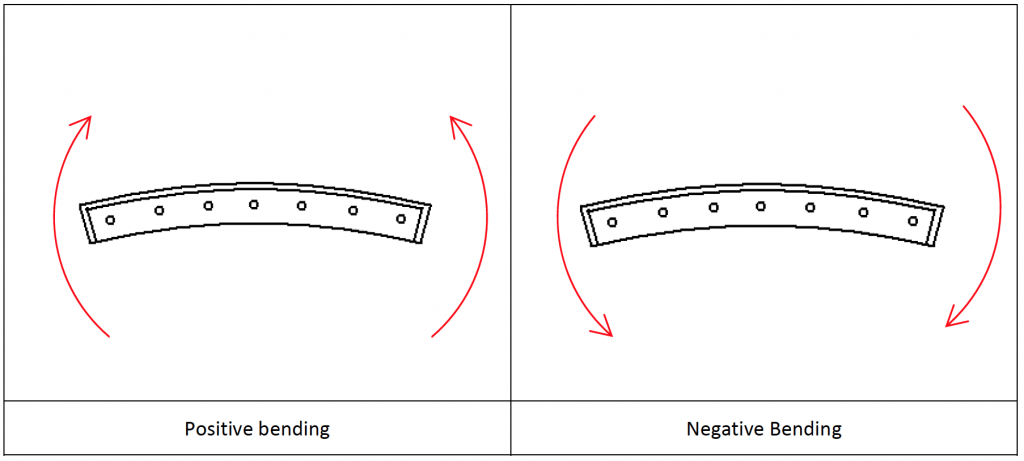
Figure 10 Positive bending and negative bending of a lining segment
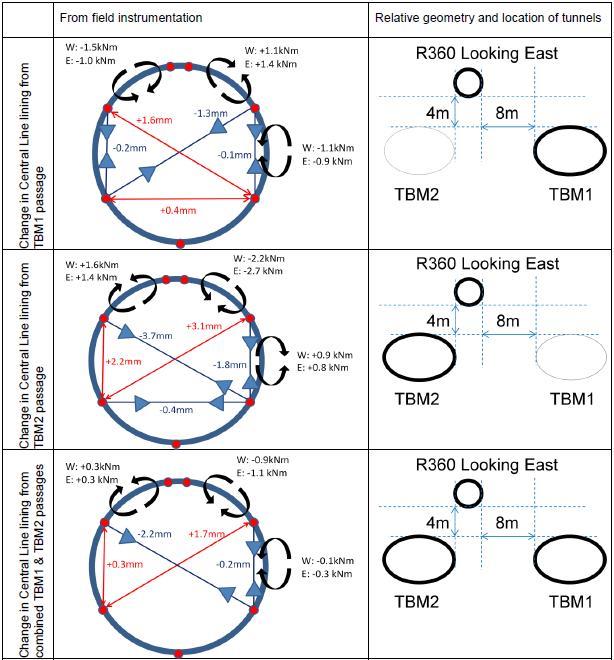
Figure 11. Changes in Central Line lining segment due to TBM1 (top) TBM2 (middle) and combined TBM 1 and TBM 2 (bottom)
Displacement transducer
The locations of the displacement transducers are shown on Figure 2. There were three displacement transducers on each ring. On ring 336 the displacement transducers were installed midway between the edge bolt and the middle bolt on the horizontal flange. On ring 360 one displacement transducer was installed between the edge bolt and middle bolt and two displacement transducers were installed at the middle bolt location. Displacements were recorded every fifteen minutes.
The displacement readings are given in Figure 12. The vertical axis shows the change in displacement. An increase in reading indicated the joint closing. The red vertical line indicates when TBM1 passed under Central Line and the black vertical line indicates when TBM2 passed under Central Line.
The displacement transducers on ring 336, located above the first Crossrail tunnel, registered joint opening magnitudes of less than 5 microns from the first Crossrail tunnel excavation beneath. Negligible change in displacement was measured from the second Crossrail tunnel excavation. The displacement transducers on Ring 360, located approximately 12m in front of the interface between the Crossrail tunnel and the Central Line tunnel, registered negligible changes due to the TBMs passing.
The gap in the data between 17/12/2012 and 06/01/2013 for five out of the six displacement transducers was due to data corruption during the data retrieval process. After the passage of TBM1, the logging interval was set to 4 hours and attempts were made to download the data once every few days. It was during this time that the data came back corrupted. At the beginning of February 2013, the logging interval was reset to 20 minutes and the data were retrieved once a day.
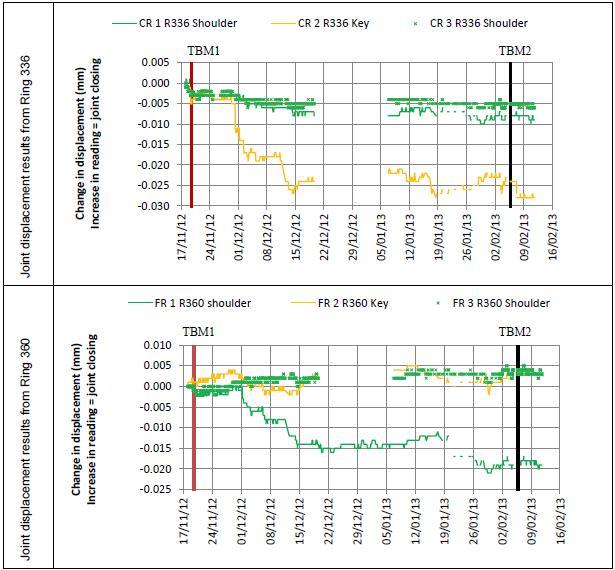
Figure 12. Results from potentiometer displacement transducers at the joints for Ring 336 (top) and Ring 360 (bottom)
Tape extensometer
Tape extensometer measurements were corrected for temperature and the results are shown in Figure 13 for the passage of TBM1 and Figure 14 for the passage of TBM2. The tape extensometer eyebolts for ring 336 were secured across the circumferential flanges of ring 335 and 336. Similarly, the tape extensometer eyebolts for ring 360 were secured across the circumferential flanges of ring 360 and 361. The designations A, B, C and D shown on the graphs are for looking east along the tunnel. The final change in span for each case is shown in Figure 11 along with the results from the strain gauges.
Figure 13 shows that the tape extensometer readings stabilised quickly after the passage of TBM1. The baseline value for calculating the change in span as a result of TBM2 was taken as the measurement recorded on the 28/11/2012. As seen in Figure 14, ring 360 underwent more deformation as a result of the second Crossrail tunnel excavation because it lies closer to the second Crossrail tunnel than ring 336.
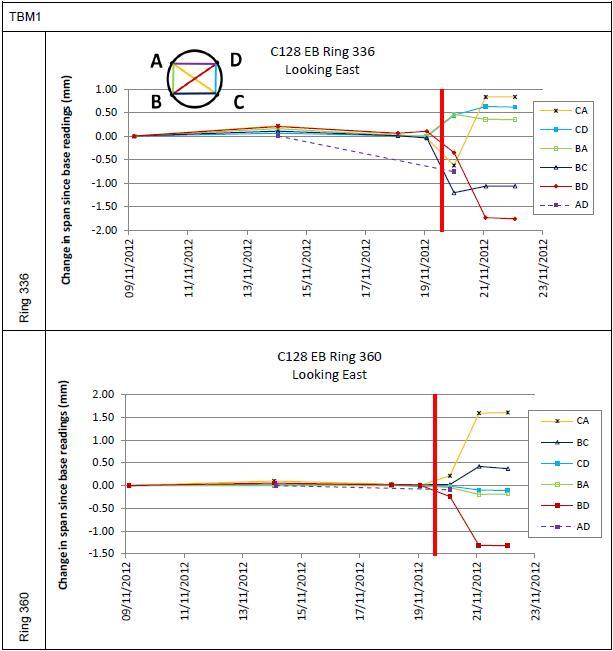
Figure 13. Tape extensometer readings covering the passage of TBM1 for Ring 336 (top) and Ring 360 (bottom)
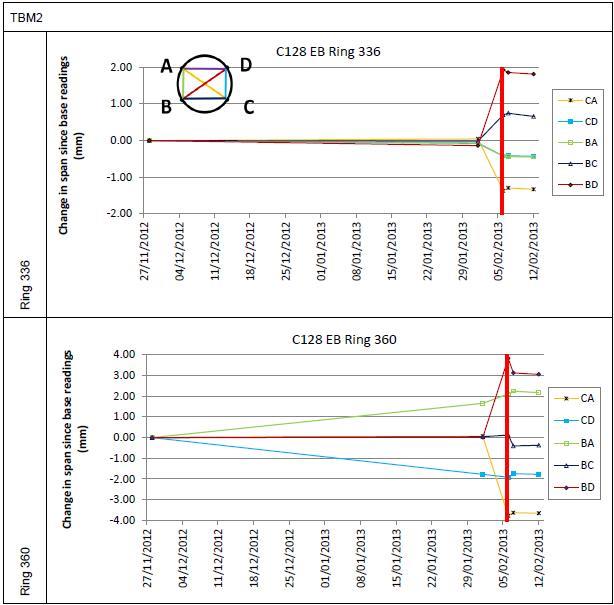
Figure 14. Tape extensometer readings covering the passage of TBM2 for Ring 336 (top) and Ring 360 (bottom)
Discussion
It took eight shifts during engineering hours to install the twenty-nine strain gauge rosettes and it took two additional shifts during engineering hours to connect the leadwires to the dataloggers. The installation was labour intensive. Each rosette consisted of three strain gauges and only four out of the 87 strain gauges gave erratic response. This was testament to the care taken during all stages of the installation process. The strain gauges responded very sensitively to the passages of the TBMs. The readings began to deviate from the baseline levels approximately 12 hours before the TBM cutter head was beneath Central Line. The readings reached a final stable value no more than 48 hours after the TBM had passed. The most useful information provided by the strain measurement was to enable the calculation of the change in bending moment and to ascertain the mode of bending. The main limitation was that because the external loading on the tunnel lining is unknown, it is not possible to calculate the bending moment distribution around the lining as a result of the excavations nearby.
The tape extensometer measurements were invaluable in providing straightforward information on the overall deformed shape of the tunnel lining. The procedure for the installation of the eyebolts was efficient. Even though the discrete, manual tape extensometer readings could only be taken during engineering hours, nightly readings around the time of the TBM arrival were able to capture the elongation of the Central Line tunnel ring towards the new tunnel excavation. As seen in Figure 11, the deformed shape of the tunnel lining determined by the tape extensometer measurements corroborated well with the mode of bending in the lining segments captured by the strain gauge measurements. It is strongly recommended to include tape extensometer readings for future in-tunnel monitoring. Given the relative ease of installation and confidence in data interpretation of the tape extensometer relative to the strain gauges, it is suggested that where tape extensometer readings are taken, strain gauge installation would not provide significant additional useful information.
The main advantage of the potentiometric displacement transducers was that they were relatively easy to install. It took two shifts during engineering hours to install all six displacement transducers and have the associated cabling in place. However, the design of the bracket for the displacement transducer limited where the instrument could be placed on the flange. Unfortunately it was not possible to install the instrument in line with the edge bolt or to install the instrument close to the circumferential flange. In terms of quality of data, as evident in Figure 12, the lack of long-term stability of the potentiometric displacement transducer rendered it unsuitable in determining the magnitude of joint movement. The drift in the readings was several magnitudes higher than any potential joint movement. As mentioned previously, when the logging rate was set to a lower frequency and the data retrieval attempted once every few days, the data would be corrupted. The reason is unknown but it appeared that daily data retrieval was necessary to ensure reliable data collection. Unless the stability of the system could be proven, and the bracket design modified to allow more flexibility in terms of installation location, it is not recommended to use this system for in-tunnel joint movement monitoring.
The field measurements made in the Central Line will be used to guide the laboratory tests conducted at Imperial College on a half-scale cast iron tunnel lining. The test ring will be deformed to match the magnitudes measured in the field. In the laboratory setup, the joint movements will be measured and the bending moments will be calculated from strain gauge measurements. The aim is for the laboratory measurements to provide greater insight into the behaviour of the segmented tunnel lining, thus allowing more informed planning of in-tunnel instrumentation and monitoring for future tunnelling projects.
Conclusions
Imperial College successfully planned, executed and supervised the installation of electrical resistance strain gauges, tape extensometer eyebolts and potentiometric displacement transducers in Central Line before the first of the Crossrail TBMs passed below the Central Line tunnel in November 2012.
The installation procedures and the instrumentation details have been presented in the paper.
The continuous strain measurements have been analysed and the calculated bending moments have been presented in the paper. The continuous measurements of joint movements have been assessed and negligible movement was registered. The manual tape extensometer measurements have been corrected for temperature effects and presented in conjunction with the strain gauge readings to provide a more complete picture of the behaviour of the Central Ling lining as a result of the Crossrail tunnel excavations. The manual data consistently showed the elongation of the instrumented Central Line tunnel rings towards the new tunnel excavation. The tape extensometer readings and the strain gauge measurements supported each other.
Recommendations for future in-tunnel monitoring have been suggested based on the experience gained from this instrumentation and monitoring exercise.
References
Gilbert, G. N. J. (1977) Engineering Data on Grey Cast Iron – SI Units. Alvechurch, BCIRA. Report number: Report 1285.
-
Authors

Jessica Yu BE MSc DIC MICE - Crossrail Ltd
PhD student, Imperial College & Geotechnical Engineer, Crossrail Ltd.
Jamie R Standing BEng DIC MSc PhD CEng MICE - Imperial College London
Senior Lecturer, Imperial College London
Robert Vollum MSc PhD DIC CEng MIStructE - Imperial College London
Reader in Concrete Structures, Imperial College London
David Potts PhD DSc FREng CEng FICE FCGI - Imperial College London
Professor of Geotechnical Engineering, Imperial College London