Variation in permeability and dewatering performance for part of the Crossrail route in east London
Document
type: Technical Paper
Author:
Dr Ursula Lawrence PhD Eur.Geol C.Geol FGS C.Sci, R. Beagley, S. Norgate, A. Thrower, ICE Publishing
Publication
Date: 07/09/2015
-
Abstract
The Crossrail project is a new underground railway crossing London from west to east. The project involves the construction of 21km of twin bore tunnel and 8 new underground stations. In the east the route alternates between surface and tunnel by utilising the former North London Line route through Silvertown and North Woolwich. The route continues in tunnel under the River Thames to Woolwich and beyond to Plumstead. Ground investigations including pumping tests were carried out at four sites in east London, Connaught Tunnel, North Woolwich Portal, Woolwich Station and Plumstead Portal. Each of the sites is underlain by Upper Chalk Group with variable amounts of Palaeogene deposits.
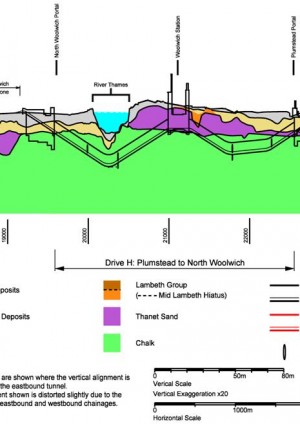
The geology at Connaught Tunnel consists of Lambeth Group overlying Thanet Sand Formation. In contrast the North Woolwich site has no Palaeogene deposits. The Woolwich Station and Plumstead sites are similar in that the Chalk Group is covered with a few metres of Thanet Sand Formation. All the sites are on the flood plain and the solid geology is covered by Quaternary deposits comprising River Terrace deposits and alluvium. Additionally the sites are at varying distances from the river resulting in different amounts of tidal effects.
Construction phase dewatering was carried out at each of the four sites to between 10m and 20m drawdown. The performance at each of the four sites was different and primarily influenced by the solid geology. The paper describes the geology at each of the four sites as encountered in the ground investigations. The pumping tests and subsequent dewatering are compared and related to the geological differences between the sites.
-
Read the full document
1. Crossrail Ground investigations
The purpose of the ground investigations was to aid in the design of the portals (North Woolwich & Plumstead), Woolwich Box Station and modification of the existing Connaught Tunnel. The main aims of the investigations were to confirm the ground conditions and conceptual model for the site, observe ground movements during pumping tests, provide data on groundwater levels and tidal influences and to provide data on groundwater pumping characteristics to aid the design of a dewatering scheme during construction.
The pumping tests were required to assess the potential yield and hydraulic properties of the multi-layered aquifer system, which comprised Drift Deposits overlying Thanet Sand (where present) and Chalk Formation aquifers. Also it was intended that the tests would permit a more accurate estimate of the number of wells and supporting piezometer monitoring installations required during construction. All locations are among dense urban infrastructure and surface/sub-surface structures.
In particular, the information was to be obtained from the pumping tests to improve the understanding of the bulk horizontal and vertical hydraulic properties/permeability of the Chalk and Thanet Sand Formation; to obtain confirmation of extent of hydraulic connections between the various strata; to understand the difference between the hydraulic characteristics of the upper zone of the Chalk, (zone to be dewatered) and the Chalk below the toe of the cut off wall; to determine the feasibility of recharging some of the abstracted water into the River Terrace Deposits during dewatering; to conduct field testing of the Thanet Sand & Chalk Formation responses to recharge to inform design; to assess how the Chalk will respond to dewatering in the local area; and to provide data on ground movements and groundwater levels and tidal influences.
2. Geology
2.1 Made Ground
The made ground encountered varied greatly in thickness and composition across all sites. Generally the Made Ground consisted of a mixture of sands, gravels and clays, mixed with varying proportions of man made materials including brick, concrete and glass. It was typically up to 3 to 5m in thickness.
2.2 Alluvium
The Alluvium encountered generally consisted of a soft to stiff variably gravelly, variably sandy organic clay. The Alluvium contained either pockets of spongy to firm pseudofibrous Peat, or layers of a spongey pseudo-fibrous clayey Peat with occasional wood fragments. Typically it was encountered up to 5m thickness and was especially well developed at North Woolwich and Plumstead Portals.
2.3 River Terrace Deposits
The River Terrace Deposits (RTD) across three sites varied from being a loose to very dense slightly sandy to very sandy Gravel to a medium dense gravelly Sand. Additionally at Plumstead, variably clayey pockets/layers were encountered. RTD’s were not generally encountered at Woolwich Station with the made ground sitting directly on the Thanet Sand. Typically the RTDs were up to 5m thickness.
2.4 Lambeth Group
The Lambeth Group consists of laminated beds (stiff fissured Clay), Lower Shelley Beds (very stiff laminated fissured Clay with frequent bands of shell fragments), Lower Mottled Beds (very stiff slightly sandy Clay) and the Upnor Formation (dense silty gravelly Sand). The Lambeth Group was only encountered at Connaught Tunnel and consisted of a variety of soft to stiff slightly sandy slightly gravelly Clay.
2.5 Thanet Sand Formation
The Thanet Sand Formation was encountered at all sites (with the exception of North Woolwich where it was only encountered in 2 No. boreholes). It consists of a dense to very dense slightly gravelly silty to very silty Sand. The sand is fine to coarse and the gravel is sub-angular to sub-rounded fine of flint. At the base of this formation is the Bullhead Beds and consisted of a very dense sandy gravel and cobbles of flint within a sandy clay matrix.
2.6 Chalk Group
The Seaford Chalk formation was encountered across all sites (although the exact thickness not proven) and consisted of a very weak to weak low to high density structured Chalk with occasional nodular flint layers and pockets of cobbles of chalk and flint. The near surface chalk was predominantly classed as Dc or Dm (structureless Chalk) with grades B1, B2, B3 or C3 in the structured chalk below (although a later re-logging of the cores from Woolwich Station suggests the majority of the Chalk is classified as grade A with grades B & C in closer proximity to the zones of faulting.
3. Aquifer/Groundwater Characteristics
3.1 North Woolwich
The main aquifer units at the portal site are formed by the RTD’s and the Chalk. The structureless chalk typically encountered at the Chalk surface, possesses a lower permeability range, thus restricting the hydraulic connectivity between the structured chalk below and the overlying RTD aquifer.
Groundwater level monitoring indicates that the water table lies approximately 1.7m to 2.8mbgl (99.0m – 101mATD). The recorded groundwater levels indicate that levels within the RTD aquifer and the deeper Chalk aquifer are similar and appear to be in hydraulic connectivity. Tidal monitoring confirmed that there is a tidal effect of between 0.4m and 0.7m. Although the tidal effect was not sufficient to significantly affect either the pump tests of the subsequent dewatering.
3.2 Connaught Tunnel
The aquifer consists of the RTD, Thanet Sand and Chalk. The RTD water level was recorded to be 4m-5m lower than the dock water level (104mATD) and lower than the surrounding area. A possibility for this may be due to groundwater ingress into the tunnel and subsequent removal by the tunnel drainage system. Additionally this implies a relatively low hydraulic connectivity with the docks which would otherwise recharge the depressed groundwater.
Groundwater levels were identified at 99.5mATD for the RTD’s, 98m to 99.5mATD for the Thanet Sand Formation and slightly higher for the Chalk aquifer potentially providing evidence for the Upnor and Thanet Sand Formations being recharged by groundwater from the Chalk. No tidal connectivity (historical or during post GI monitoring) has been recorded at this location.
3.3 Woolwich Station
The aquifer at Woolwich Station consists primarily of the Thanet Sand Formation and the Chalk Group. RTDs were encountered only sporadically at this location. Groundwater monitoring at this location identified the Thanet Sand aquifer to be between 100m and 102mATD and confirmed that the Thanet Sand and Chalk were in hydraulic continuity. The ground investigation encountered slightly artesian groundwater in one borehole (approximately 0.5m above ground level) in an area associated with faulting. In an adjacent borehole, a void up to 1m depth with heavily fractured chalk below was encountered. The borehole was extended for an additional 5m to prove the depth of the fractured and voided area. Tidal monitoring indicated that the maximum tidal variation was less than 1.0m. The variations affect both the shallow and deeper aquifers with the time lag between sea tides and effects on groundwater levels dependent upon the distance from the river.
3.4 Plumstead
The aquifer at Plumstead consists of the RTD’s and Chalk with the addition of a thin Thanet Sand Formation layer (~1.5m). The chalk again provides the main yield of water though its fracture network. The increased clay content within the Bullhead Beds at the base of the Thanet Sand Formation has the potential to reduce vertical permeabilities between the aquifers.
Groundwater monitoring indicates that the groundwater level was at approximately 100.5mATD and indicated that all three strata are in hydraulic continuity. Historical tidal monitoring within close proximity to Plumstead indicates a low piezometric variation of between 0.015m and 0.075m and a round of tidal monitoring at Plumstead indicated a very small tidal fluctuation at the site of 0.08m.
4. Pumping Tests
4.1 General
The pumping tests generally were carried out to assess how the Chalk Formation responds to dewatering including prediction of yields and time to achieve dewatering and consisted for four stages: 1) equipment test, 2) Step test, 3) 2 day Constant Rate test and 4) Recovery monitoring. Typically the wells were acidized with 32% hydrochloric acid prior to testing and well screened through the Chalk. Pumping test at all locations indicated good hydraulic conductivity between the superficial deposits, any Palaeocene deposits and the Chalk. Interpretation of the test results was typically carried out by WJ Groundwater Ltd.
4.2 Connaught Tunnel
The dewatering trial/pumping test at Connaught Tunnel commenced with a depressurization test within the Lambeth Group using ejector wells. The Lambeth Group was additionally tested at this location to determine if depressurization of any sand channel deposits was a viable construction technique. After 6 days of pumping within the Lambeth Group the trial was extended to the Chalk pump well and continued for an additional 7 days. An initial peak flow of 12 l/s was achieved, dropping to 10.3 l/s after 24 hours. The pump test indicated that the chalk had a permeability of 2 E -4 m/s and the Lambeth Group had a permeability of 2.7 E -5 m/s. The cone of depression was markedly steeper around the chalk well at Connaught than at other locations. This could have been due to anisotropy within the chalk or the presence of the Greenwich fault to the south east of the site, affecting the development of the cone of drawdown to the north of it. The anisotropy in the cone of drawdown was also encountered within the Lambeth Group. This could be due to the development of the Mid-Lambeth Hiatus preventing drawdown or the slope and dip of bedding acting as a barrier to flow.
4.3 North Woolwich and Plumstead Portals
The pumping tests additionally included recharge tests to the RTDs. At Plumstead, portal two abstraction wells were drilled to 23m and 29m depth respectively. Additionally two recharge wells were drilled to 12m depth within the River Terrace Deposits. The presence of the Alluvium combined with the adjacent infrastructure meant that any resulting induced settlement would not be acceptable. Analysis of the recharge tests by the dewatering contractor, WJGL, allowed the permeability of the thin Thanet Sand layer, weathered chalk and deep chalks to be derived by an iterative method until the model and the actual field test data matched.
The following values of permeability were used in the dewatering design for North Woolwich: Alluvium 1 E -9 m/s, RTD 1.27 E -3m/s, Weathered Chalk 1 E -5 m/s, Shallow Chalk 1.5 E -4 m/s and deep chalk 5 E -6 m/s. The deeper chalk shows a decrease in permeability due to a reduction in fracturing.
The following values of permeability were used in the dewatering design for Plumstead Portal: Alluvium 1 E -8 m/s, RTD 1 E -3m/s, Thanet Sand 5 E -7, Weathered Chalk 2.5 E -5 m/s, Shallow Chalk 1.5 E -5 m/s and deep chalk 1.5 E -5 m/s. The deeper chalk shows a decrease in permeability due to a reduction in fracturing.
4.4 Woolwich Station
The pumping test at Woolwich Station was carried out in two wells (both separately and combined) in order to determine if there was any effect from faulting partway along the station box. The western test gave a permeability of 1.3 E -4 m/s while the eastern test gave a result of 2.4 E -4 m/s. Boreholes and downhole CCTV both encountered voiding which locally gave higher permeabilities. The results of the pumping tests were compared against the results of packer tests from previous phases of ground investigations which gave permeabilities varying between 1.6 E -6 m/s and 5.1 E -5 m/s. The difference is considered due to scale effects between the two types of tests.
5. Construction Dewatering
5.1 General
All construction dewatering sites were subject to Environment Agency consenting regime modified by the Crossrail act. All sites included groundwater monitoring using a network of installations extending for a radius of 2km from each dewatering location in order to demonstrate the cone of drawdown for all sites did not extend beyond the predicted extent of dewatering for the project as a whole as detailed in the Crossrail Environmental Statement. The total flows and extents of the dewatering were less than estimated in the Environmental Statement. This was in part due to the conservative value of chalk Group permeability used in the ES but also the use of recharge wells at the outer-lying sites. Dewatering design was carried out by the dewatering sub contractor
5.2 Connaught Tunnel
Value engineering by the construction contractor resulted in changes to the construction sequence and methodology. This resulted in changes to the emphasis of the dewatering scheme. The chalk was dewatered by a system of 6 wells installed to 70m depth. Dewatering of the chalk is required to dewater the Thanet Formation by underdrainage. Depressurization of the Thanet Formation directly was achieved using a ring of 7 wells installed in a ring around the shaft location. The Lambeth Group was proposed to be dewatered using well points installed from within the Tunnel, above the invert. Drilling of the well points revealed that the Lambeth Group was at a higher level and contained fewer granular layers than anticipated. The well point dewatering was scaled back as a result and concentrated on the southern side of the tunnel.
The dewatering at Connaught Tunnel began on 8 May 2012 from the chalk wells followed by the Thanet Sand Wells on 14th May and generally performed as predicted apart from the distribution of well performance. The predicted abstraction rate was 50 l/s however this formed an upper bound as the actual rate was nearer 33 l/s. On the northern side of the dock passage most of the abstracted water, 17 l/s, came from one well (CW1). Fortunately the well yield did not fall below the minimum required to maintain drawdown before the end of construction.
5.3 North Woolwich Portal
The base of the Portal is at 16m depth in the chalk. The normally consolidated alluvial deposits would be affected by drawdown causing irreversible settlement above the cone of drawdown resulting in a dewatering/recharge scheme with internal cut off walls being proposed. The dewatering system consisting of 37 wells installed in the Chalk within the portal and 40 recharge wells installed in the River Terrace Deposits outside the portal. Dewatering of the portal alone was estimated to require abstraction rates of 146 l/s with a predicted cone of drawdown between 300m to 500m radius and 5m drawdown outside the portal. The requirement for recharge increased the predicted abstraction rates to 262 l/s but reduces the amount of drawdown to less than 1m outside the portal. Division of the portal into sections reduces the predicted abstraction rate for each section to approximately 100 l/s.
Dewatering at North Woolwich began in May 2013 and was increased progressively as construction progressed. A combined total of 95 l/s were abstracted of which 58 l/s were recharged back into the River Terrace Deposits with the remainder discharged into the nearby River Thames.
5.4 Woolwich Station
The dewatering was designed to drawdown the water level by some 19m to 1m below the base slab. The resulting cone of drawdown was estimated to be 400m in radius and producing 276 l/s which is estimated to reduce to 150 l/s/ once steady state conditions have been achieved.
Concerns over the effect of faulting and the presence of voids in close proximity to the River Thames were mitigated by the use of fissure grouting to reduce the permeability. In order to reduce the time for dewatering the station box was divided in two by the use of a slurry wall. This meant that dewatering of one half could be achieved while diaphragm walling, grouting and well installation was still being completed in the second half, thereby by shortening the construction programme. 32 wells were installed in total being split equally between the two halves of the station.
Dewatering was carried out between July and November 2012 with a target drawdown of -11m AOD. The abstraction flow rate was expected to be up to 15 l/s per well the dewatering rate was 16.6 l/s. Dewatering wells were brought on line between 6th July and 28th August. Wells in the western half of the station were installed between 6th July and 19th July with target drawdown achieved by 19th August.
5.5 Plumstead Portal
Plumstead Portal is constructed from diaphragm and secant piled walls upto 16m depth. 37 dewatering wells were installed within the portal to draw the water level down to 1m below base slab and 30 recharge wells were installed outside the walls to control ground movements. 5 temporary cut off walls were installed across the portal to facilitate staged excavation and base slab construction.
Dewatering at the portal was achieved through 25 deep wells installed in the Chalk and 8 shallow wells also within the Chalk. Additionally there were 4 wells installed within the River Terrace Deposits. The different levels of abstraction wells were achieve a target drawdown level varying between -15.7m AOD and 0m AOD. Dewatering at Plumstead Portal began in April 2012 with wells brought online in 5 phases as excavation proceeded along the length of the portal. Target drawdown was achieved by 22nd June in phases 1 to 3 (Shallow) and by 23 July in Phases 4 to 6 (Deep). All wells were in operation by 23rd September 2012. Discharge was carried out to all 30 recharge wells. The predicted abstraction rate was 57 l/s with 50 l/s being recharged and the remainder discharged to sewer. However the observed abstraction rate was 105 l/s with 95 l/s being recharged. The observed performance of the dewatering system was within the predicted behavior.
5. Construction Dewatering
Detailed investigations were carried out at each site. The strata were logged in detail to refine the ground model including the presence of any faults. Groundwater monitoring was carried out to determine the groundwater regime and detailed pumping tests were performed. This allowed dewatering design to be carried out and used to enhance dewatering performance in order to fit with or allow acceleration of the construction programme. Although dewatering of the four sites was based around abstraction from the chalk there were significant differences between the four sites. Two of the sites had higher Chalk permeabilities due to the proximity of faulting. Two of the sites employed recharge which resulted in significant increases in the total rate of abstraction. Three of the sites employed slurry cut off walls in order to control the development of dewatering. Generally the drawdown was achieved within the estimated times based on the pumping test permeability. There was variation in abstraction rates between wells within each site but no extra wells were drilled to achieve the required drawdowns.
References
[1] Monitoring of Construction dewatering 2010 to 2013 CRL1-GCG-C2-RAN-CRG03- 00001
[2] Connaught Tunnel – Dewatering Trial Interpretative Report 2011 122-OVE-C2-RGN- CR146_ST003-50001
[3] Groundwater Control Numerical Modelling –North Woolwich Portal, 2012, C310-HTM- X-RGN-CR146-50001
[4] Groundwater Control Numerical Modelling – Plumstead portal, 2011, J1726. WJ Groundwater Ltd.
[5] Crossrail Package 37 GI – Pump Test Interpretive Report, 2011, E1016. WJ Groundwater Ltd. C156-CSY-C2-RGN-CR147_WS163-50023
-
Authors

Dr Ursula Lawrence PhD Eur.Geol C.Geol FGS C.Sci - Crossrail Ltd
Geotechnical Engineer, Crossrail
R. Beagley
Capita Ltd
S. Norgate
Capita Ltd
A. Thrower
Capita Ltd
