Verification of the smoke ventilation design using ventilation rates derived from CFD cold smoke simulation
Document
type: Technical Paper
Author:
Wing Fung PhD MSc BSc(Eng) CEng MCIBSE, Matthew David BSc CEng MIMechE MCIBSE
Publication
Date: 02/12/2021
-
Read the full document
System Overview
A smoke ventilation design is put in place to maintain the Crossrail station platform in a tenable condition and in the same time minimises smoke migration to other station areas during evacuation/ intervention in a platform fire/ train fire in station scenarios.
The smoke ventilation design entails:
- A smoke reservoir at the station platform to capture the smoke coming out from a smoke plume.
- The provision of over platform extract ventilation system to remove the smoke from the smoke reservoir. This will increase the smoke reservoir and minimise downward movement of smoke into the occupied areas when the smoke cools down with time.
- Extraction of smoke from a train fire at source by the TVS system. The TVS induced extraction flow rate from the station platform also assists the platform smoke control. The TVS fan running speeds have been optimised (often referred to as reduced fan speed) to achieve tenable condition at the station platform and running tunnel while keeping the door forces including PSD within manageable levels and minimises the occurrence of slamming in the evacuation/ intervention window.
- The staircase pressurisation system is provided to prevent ingress of smoke from a platform fire into the intervention staircase. In Crossrail a timer is put in place in a platform fire to delay the operation of the system to permit passenger evacuation through the doorways with minimal door force.
The smoke ventilation design for Crossrail platform is illustrated in Figure 1 below:
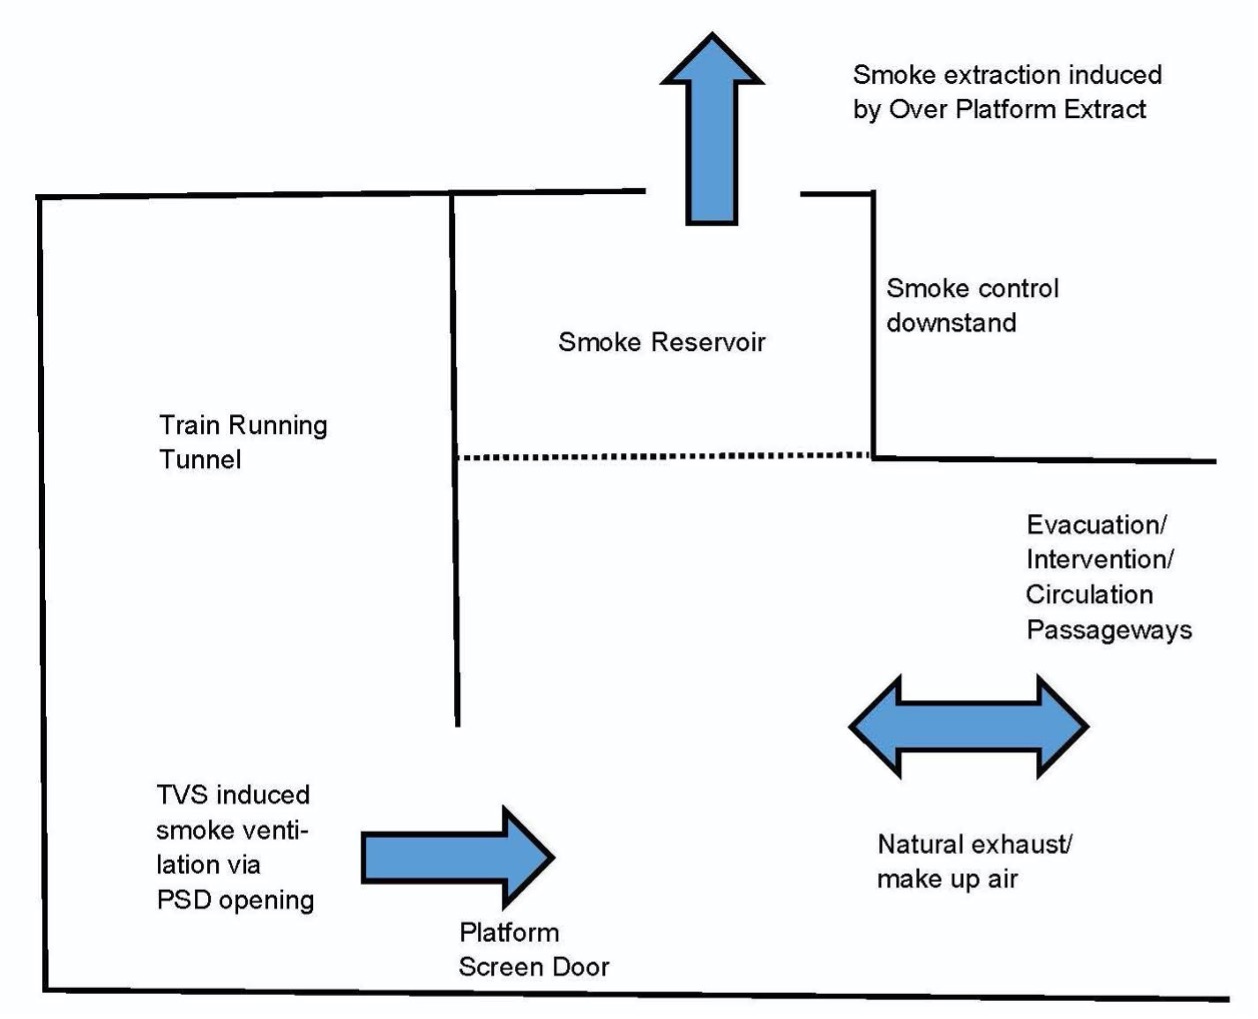
Figure 1. Smoke Ventilation Design for Crossrail station platform
Technical Assurance
Verification of the smoke ventilation design at Crossrail platform were made in accordance with the following assurance workstreams:
- Station air flow measurements to verify the design flowrates of the smoke ventilation system.
- Evaluation of the actual incoming and outgoing air flow paths to the station platform and confirm that all major air paths, smoke migration paths, are accounted for in the smoke ventilation design.
- Air flow measurements carried out by the TVS contractor to verify the TVS smoke control design. Part of the test results are of a similar nature to the station air flow measurements and has be used to cross check the validity of the station air flow measurement results.
- Verification of the air flow predictions from the CFD model. The CFD analysis was carried out based on hot smoke and the primary deliverables are the thermal and aerodynamic conditions in the station platform. To permit verification of the CFD result, dedicated CFD simulation runs were carried on ‘cold smoke’. Predictions are made on smoke extraction flow rates from the model to allow verification with field measurements. It is to be noted in most commercial practice, reliance is made on the benchmark validation test result and the latter practice is not normally carried out on smoke designs using CFD simulation.
The following sections highlight the main outcomes of the assurance exercise.
Station air flow measurement test
One of the objectives of the station air flow measurement test is to understand the air flow pattern induced by the mechanical ventilation systems at a station platform in the event of a train fire in station. The mechanical smoke ventilation systems include the Tunnel Ventilation System (TVS), Over-platform Extract (OPE) and Staircase Pressurisation System (SPS). The sources of make-up air include escalator barrels/ voids, open staircases, transfer air louvres and miscellaneous air leakage air paths at the incident and non-incident platforms. The majority of the make-up air comes from outside the station. In some cases, a small proportion of the make-up air comes from the opposite tunnel.
In the station air flow measurement test, the following main incoming or outgoing air flow rates were measured:
- Make-up air flow via the adits to the incident platform at bored stations (Test Point 1, ADIT). These air flow rates would take account of the PES (platform end screen) leakage of the opposite platform in addition to the air flow via the escalators and connected open passages.
- Makeup air flow via the escalator or connecting open passages at box stations (Test Point 1, ESC). This is an alternative means to measure the make-up air flow and is subject to error because of the untraceable air paths (air leakages through the PES at the non-incident platform etc). An adjustment factor has to be applied to account for the error. The annular area of the escalator barrel or open staircase void is irregular and some stations and so errors can be associated with this.
- The air extract rate of the Over Platform Smoke Extract system (OPE).
- Air flow from the station platform to the tunnel through the PSDs (Test Point 2) to account for the total air flow leaving the station platform to the tunnel. No adjustment is needed for the leakages through the incident platform PES and end walls as the PSD (platform screen doors) are open at the time of measurement and is the dominant air flow path. Air flow through the gaps and clearances are considered negligible.
The worst-case condition for air flow rate measurement is with the SPS not running and the doors closed to any passageways to intervention staircases, evacuation staircases and adjoining interface stations.
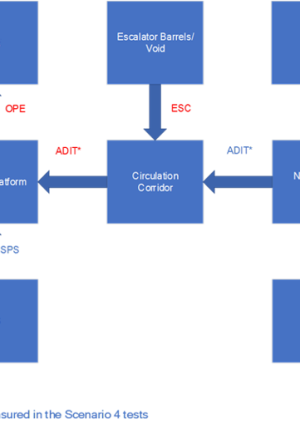
Figure 2 provides a line diagram showing the various air flow paths in and out of the incident platform (the ‘control volume’ in the analysis).
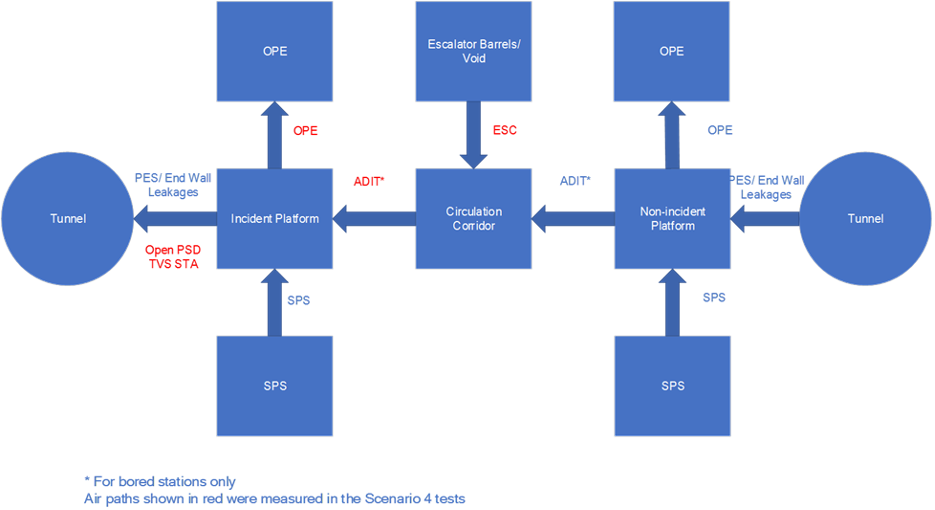
Figure 2. Diagram showing the air flow paths in and out of the incident platform
The measurements made in Test Point 1 and 2 are independently derived test data for the platform control volume. They are to be checked one with the other to establish a reasonable level of confidence of the exhaust air rate from the incident platform. This exhaust air rate could then be relied upon to compare with the air flow rate predictions from the Numerical Model for the TVS. When the measured figures equal or exceed the predictions, this would provide clear evidence that the results of the Numerical Model are valid in a train fire in station.
Summary of findings from the station air flow measurement tests
Table 1 highlights the flow measurements made in the station air flow measurement tests and their correlation with the TVS air flow information when the TVS is at running speed. In the Table:
- The air flow measurements made at the adits to the incident platform (Test Point 1, ADIT) are to be compared to that of the PSDs (Test Point 2) after deducting the flow rate of the OPE. The measurements are feasible only at bored stations as there are no similar ADITs at box stations.
- The air flow measurements made at the escalator barrels (Test Point 1, ESC) are to be compared to that of the PSDs (Test Point 2) after deducting the flow rate of the OPE and flow adjustment to account for the air outflow or inflow to the non-incident platform.
Station PAD TCR FAR LIV WHI CAW WOO Station air flow measurement Test- TVS speed 50% 50% 50% 50% 50% 50% 30% Test Point 1 ADIT Measurements made at the adits leading to the incident platform. 125 141 68 ESC Measurements made at the escalator barrels leading to the incident and non-incident platforms. 341 130 272 66 Less: OPE Air extract via the Over Platform Extract. 50 22 20 24 20 53 20 Less: Outflow to the non-incident platform Outgoing air flow from the incident platform into the non-incident platform. Only applicable to measurements made at the escalator barrels. 5 5 5 5 Test Point 1 Adjusted- Outflow to tunnel after adjustments to test measurements Air flow from the platform to the tunnel after adjustments made to the Test Point 1 measurements. 286 104 106 115 48 214 41
Note
Test Point 2– PSD Measurements made at the PSD doorways. 227 94 107 92 55 187 79 Air flow from the incident platform to the tunnel Average of the measured flow rate at Test Point 1 (after adjustments) and Test Point 2 257 99 106 104 52 201 79 Percentage of OPE vs TVS induced air flow Air extract via the Over Platform Extract divided by the Air flow from the incident platform to the tunnel (Percentage) 19 22 19 23 38 26 25 TVS flowrate Total air extract rate. Make up air from incident platform and adjacent tunnel ventilation sections. 300 200 200 300 200 300 180 Percentage of TVS air extract from the incident platform Air flow from the incident platform divided by the total TVS air flow (Percentage) 86 50 53 35 26 67 53 Table 1. Summary of Air Flow measurements in station air flow measurement with the TVS at 50 or 30% speed. All readings in m3/s.
Note – The flow rate was discarded as it is unlikely to be correct. This could be due to incorrect TVS fan/ damper settings or misplacement of test data sheets from the test.
The following observations can be made from the air flow measurements:
- In all stations, the measured smoke extract rates of the over platform extract are over and above the design flow rate. The same applies to the TVS induced air extraction rates from the station platform as shown in Table 4. Thus, the field measurement results confirm correct ventilation rates are provided in accordance with the smoke ventilation design.
- The smoke ventilation flow induced by the TVS varies significantly from one station to another, ranging from 257 m3/s in PAD to only 52 m3/s in WHI. Furthermore, the proportion make up flow from the incident station platform also varies significantly from 86% in PAD to 26% in WHI. This is probably due to the differences in station layouts (‘box’ shallow station vs deep bored station). Because of the lack of consistency and uncertainties, an evaluation of the station air flow pattern and the correlation between the predicted and measured smoke ventilation flows are important to confirm that the smoke ventilation provision is suitable for its purpose for each station.
- All the air flow paths entering and leaving the incident platform have been accounted for in the air flow measurement test i.e. there is no significant unknown leakage paths that will adversely affect the correctness of predictions in the smoke ventilation design.
- In WHI, the OPE plays significant role in the smoke ventilation design (38% of the contribution from the TVS induced smoke ventilation).
- There is a highly uneven distribution of air flow through the respective PSD opening. The variation is a function of their locations in relation to the make-up air paths in the station. The uneven air distribution might not be accurately represented in the CFD model.
- The smoke reservoir plus the smoke ventilation induced by the TVS and OPE is intended to contain the smoke spill and maintain a tenable condition in station evacuation. Therefore, it is very likely that minor variations in air extraction rate will not impair station evacuation until after the smoke reservoir is filled up. This will provide a ‘buffer’ time before the smoke spill over will start affecting tenable environment of the platform and/ or propagate into the evacuation route.
Level of confidence on the results of the station air flow measurements
Correlation between Test Point 1 and 2 measurements
There is a close correlation between the two sets of independently derived test data. Aggregate Test Point 1 Adjusted flow rate is 93.6% of the aggregate Test Point 2 flow rate. Based on the close correlations, there is a good level of confidence to use the flowrates obtained in the test to check against the flow rates predicted in the TVS air flow Numerical Model.
Anomalies of the results obtained from the Test Points
At WOO, the measured flow rate at Test Point 1 Adjusted (41 m3/s) is significantly lower than that that at Test Point 2 (79 m3/s). In Woolwich Station, it was noted at the time of the test that there was an appreciable inrush of air (instead of the outgoing air flow) from the tunnel to the non-incident platform because the only other make-up air paths are from escalator barrel at one end and the turrent at the other end of the station. The contribution from the non-incident side of the island platform was not accounted for in the test. The result of Test Point 1 Adjusted was therefore discarded in the subsequent analysis.
Air flow from the non-incident platform to the tunnel
When air flow measurements were made at the escalator barrels (Test Point 1, ESC), a correction of 5 m3/s was made to account for the air outflow from the incident platform to the non-incident platform so that it could be used to compare with that of Test Point 2. The correction factor was derived from the measurements made at LIV as follows:
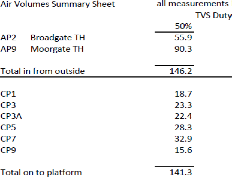
Table 2. Test measurements made at LIV station
Outgoing air to non-incident platform= 146.2-141.3= 4.9 (say 5 m3/s)
It is noted that the adoption of 5 m3/s correction in the flow analysis is a provision based on the results for LIV and is subject to error if the same provision is used for other stations because the outgoing or incoming air flow to the incident platform is site configuration dependent. In ‘deep’ stations, the pressure in the tunnel alongside the non-incident platform is more susceptible to the influence of the TVS operation resulting in an outflow of air from the platform to the tunnel if the incident and non-incident platforms are far apart. This will result in a small net outgoing air flow to the non-incident platform as indicated in the station air flow measurement test results. The latter forms the basis of the 5 m3/s adjustment allowance introduced. In ‘shallow’ stations, the pressure in the tunnel alongside the non-incident platform is close to atmosphere and very likely there will be a net incoming air flow, induced by the operation of the TVS, from the incident platform into the non-incident platform. This is exacerbated by the island platform construction in shallow stations. The use of the adjustment factor derived for deep station might not be appropriate for the purpose. The adverse impact of the use of inappropriate correction factor to the result of flow analysis is small as the magnitude of adjustment is relatively small.
Air flow measurements through the PSDs at the incident platform
The need for a correction factor to the measured result at Test Point 2. A test rig comprising a straight duct onto one PSD was set up in FAR to find out the correlation factor for the PSD measurements. The correlation factor was intended to be used to normalise flow measurements for the PSD. The factor so derived (3.59) was eventually not adopted in the analysis as the use did not lead to meaningful results. A similar rig was trialled at PAD and WOO but with similarly unsuccessful results due to test inaccuracies and very low air velocities. A re-test is not recommended as the PSD flowrates compare quite well with the flow measurements at the adits as indicated in the Section above. No correction factors were applied to the test results.
Comparison of the result of air flow measurements carried out by the TVS contractor
In parallel to the station air flow measurement test, a series of airflow tests that were also carried out by the TVS contractor. The intention is to provide a comparison between the air flowrates implied by the test results and the air flowrates shown in the CFD simulations, and to draw conclusions about this comparison. The key point of assessment will be to compare the measured air flowrates with the predicted flowrates in the CFD simulations at key locations within each station. It is the air flowrate in the cross passages or escalators leading on to the platforms which has the strongest impact on containing smoke within the platforms and preventing the spread of smoke up to concourse and ticket hall levels. If the measured air flowrates at these locations are significantly greater than the air flowrates in the CFD simulations, then the conclusions of the CFD simulations (that tenable conditions can be provided) will remain valid.
A comparison of the two sets of independently derived flow measurement results are presented in Table 3 below:
Station PAD TCR FAR LIV WHI CAW WOO Air flow from the incident platform to the tunnel from station air flow measurements (m3/s) 257 99 106 104 52 201 79 Measurements by the TVS contractor in a separate occasion (m3/s) 233 105 94 165 51 193 78 Percentage difference (Measurements by TVS contractor over the station air flow measurements in percent) -9 6 -11 59 -2 -4 -1 Average of the two sets of independently derived air flow measurements (m3/s) 245 102 100 135 52 197 79 Table 3. Comparison of the station air flow measurements and the air flow measurements carried out by the TVS contractor
The following observations can be made from the comparison Table:
- Apart from LIV, there is an excellent correlation between the two sets of measurements. For LIV, it is likely there are issues on the part of the measurements made by the TVS contractor. There are good correlation between the results of the two independent test points in the station air flow measurement test (within 20%) and also that they also match well with the CFD predictions (within 13%).
- Average of the two sets of measurements is used to compared with the CFD predicted results in the following section.
Validation of the numerical model used in platform smoke control prediction
A ‘cold flow’ CFD analysis was carried out for a train fire in station at platform scenario. In the analysis, predictions were made on the average velocity through each platform screen door and the evacuation routes at the relevant TVS flowrate speeds for each station. These will be used to gauge the TVS flow rate vs field measurements obtained in station air flow measurement test at 50% TVS air flow (30% for Woolwich Station). In the following Table 4 a comparison is made between the field measurements and the CFD predicted air flow for each station.
Station PAD TCR FAR LIV WHI CAW WOO Average of the two sets of independently derived air flow measurements (m3/s) 245 102 100 135 52 197 79 CFD prediction (m3/s) 161 82 54 117 35 168 74 Percentage above CFD predictions 52 24 85 15 49 17 7 Table 4. Comparison of field measurements and predicted air flow
The following observations can be made in the comparison:
- In all cases, the measured flow rates are over and above the predicted CFD flow rates. This suggests that the result of CFD flow analysis is very likely to be valid for the train fire scenario.
- The aggregate field measurement for all the stations is 32% above the aggregate CFD predicted flow rates. However, the field measurement in WOO is only 7% above CFD prediction. Further study is therefore needed to confirm that sufficient ‘cushion’ has been included. Fine tune the TVS speed at the station might be needed as appropriate.
Conclusion
On the basis of the assurance evidence presented, there is a good level of confidence that the smoke ventilation system installed in Crossrail station platform is suitable for the purpose in either a platform fire or train fire in station scenario.
The requirement for the additional information from the CFD simulation, namely ventilation flowrate in a cold smoke environment has proofed to be useful to help verify the smoke ventilation design through air flow measurements.
Lessons Learned
Smoke ventilation design based on CFD simulation study is a widely adopted design practice. Verification of the design using hot smoke/ heated smoke is expensive and complicated exercise. In most instances, benchmark tests were relied on to confirm the validity of the model. In Crossrail, the use of smoke ventilation rates determined in cold smoke CFD simulation has been used as a successful vehicle to verify the smoke ventilation design.
-
Authors

Wing Fung PhD MSc BSc(Eng) CEng MCIBSE - Arcadis
Technical Director (MEP), Arcadis
Wing is is a Chartered Engineer with over 30 years’ experience as a technical specialist engaged in mass transit system planning, design, project management, technical assurance, commissioning, energy management, operation and maintenance, and asset renewal. Wing has been with the Crossrail project in the CRL Chief Engineer Group since 2013, overseeing mechanical design, systems integration and T&C.
Specialties: Building Services, Mechanical Engineering, Computational Fluid Dynamics, RAM studies, Systems Integration, Requirement Management, Testing and Commissioning.

Matthew David BSc CEng MIMechE MCIBSE - Crossrail Ltd
Matthew David is a mechanical engineer with the Chief Engineers Group. He is responsible for the assurance of the design, installation, commissioning and handover of the mechanical systems for the stations, shafts and portals. He has been with Crossrail since March 2013. He has spent the previous 31 years designing buildings, of many types, around the world.