Excavation of the Bedlam Burial Ground (AD 1569-1738) for the new Crossrail station at Liverpool Street – a metrical analysis
Document
type: Case Study
Author:
Jay Carver BA (Hons) MIFA, Marit Leenstra
Publication
Date: 14/03/2017
-
Read the full document
Context
The project planning for the cemetery excavations for Crossrail at Liverpool Street revealed a number of key questions that will be relevant to other projects of this type. This paper hopes to provide some feedback on the following topics relevant to the projects’ learning legacy:
How was the data from site evaluation phases used to provide a baseline forecast for the schedule and inform the methods to be used, and the excavation strategy?
How was the site to be divided up and areas for archaeological excavation and cemetery clearance exhumation defined?
How long would each task take and what resources were required? Can that be accurately predicted?
What factors were predominant in predicting necessary programme time for the works and what were the major sources of delay/risk?
What monitoring/ record keeping was kept during the works?
How did the metric data collected at each stage contribute to defining a risk model for similar type works in the future?
What conclusions can be drawn?
A caveat should be applied to these results. Depending on individual factors, works of a similar nature on historic burial grounds may produce very different results, for instance where the character of the remains differs markedly, and where site conditions are not comparable. The main purpose of this paper is to publish the core metrics that influenced the project design for excavation and exhumation at the Crossrail Liverpool St site, and highlight how other projects of this type maybe successfully managed.
1. Introduction
1.1 Crossrail is building a new railway, connecting Shenfield and Abbey Wood in the East with Reading in the West. The line crosses the heart of London and will open in 2018 as the ‘Elizabeth line’. The construction of the central section of the project has opened up many important archaeological sites across London since 2009. Over one hundred archaeologists and specialists have contributed to the project. The results of this large scale archaeological endeavour are being published in 10 volumes “The Crossrail Archaeology series”. These volumes are supported by a number of technical papers.
1.2 A key challenge was the exhumation of a historic disused cemetery, ‘The Bedlam Burial Ground’ that occupied an area required for station construction, and was on the critical path. This paper focuses on the planning and outcomes of archaeological evaluation excavation of the 16th and 17th century burial ground at the Crossrail site at Liverpool Street. Previous technical papers have focussed on the desk study (Court 2008) and reconnaissance phase (Carver et al 2011) and the balance between archaeological excavation and cemetery exhumation work in the project design (Carver 2012).
1.3 Between 2011 and 2016, c.3500 graves were excavated at Liverpool Street. A combination of archaeological excavation and commercial exhumation services were employed. Prior to determining a full project specification, two phases of archaeological evaluation were carried out. This was essential to adequately understand the geometry, quality and quantity of burial ground features extant in the former burial ground, and inform a quantitative and qualitative risk assessment to inform a resource plan, programme schedule and cost plan.
1.4 This paper documents the stages of metric data gathering and processing undertaken to produce a baseline model for the excavation and exhumation of a historic burial ground. Progress and productivity monitoring work, undertaken during the project, allows us to assess the effectiveness of the model and document variances between forecast and actual outcomes. The relationship between various predicted quantifications and productivity rates and the actual outcomes are taken into account, including all time taken for the tasks and identifying delay time (or non-working time due to other factors), that potentially alters the outcome data.
1.5 The final archaeology Written Scheme of Investigation (WSI) (Williamson 2014) for the Liverpool Street project is published at part of Crossrail Learning Legacy (Crossrail Archaeology – Report Archive https://learninglegacy.crossrail.co.uk/learning-legacy-themes/environment/archaeology/archaeology-report-archive/
1.6 The archaeology contractors’ method statement (Elsden 2015) was produced by MOLA in response to the WSI. The project was then carefully monitored during its execution through on-site data collection, which looked at quantities of work, productivity rates against predictions, delays and the sources of delay.
2. Evaluation – cemetery geometry
2.1 Fourteen evaluation trial trenches were initially planned (Phase 1), representing a sample area of around 10% of the area thought to preserve significant archaeological remains. In the event, due to the presence and density of below ground utilities that had not been previously mapped, nine trial trenches were achieved (Hartle 2012), representing an evaluation sample arae of 6.59% (Fig 1).
2.2 An additional four areas (Phase 2) were evaluated as part of the project utility enabling works that increased the sample size to 17.95% overall (Fig 2). It is the data from these investigations that provided the metrics for the quantitative risk assessment and project design for the main works contract.
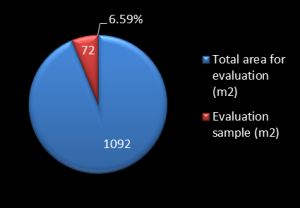
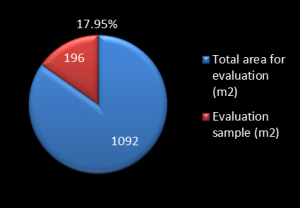
Figure 1 – Evaluation sample size Phase 1 Figure 2 – Evaluation sample size Phase 22.3 The WSI used the basic deposit resource metrics collected during the evaluation phases (Table 1) to estimate the total number of burials, the grave density, the productivity profile and resource plan to predict the requitment for the full excavation of the burial ground. Performance metrics were calculated by comparing the quantitative data with the human resource profiles provided in the evaluation phases’ daily site records.
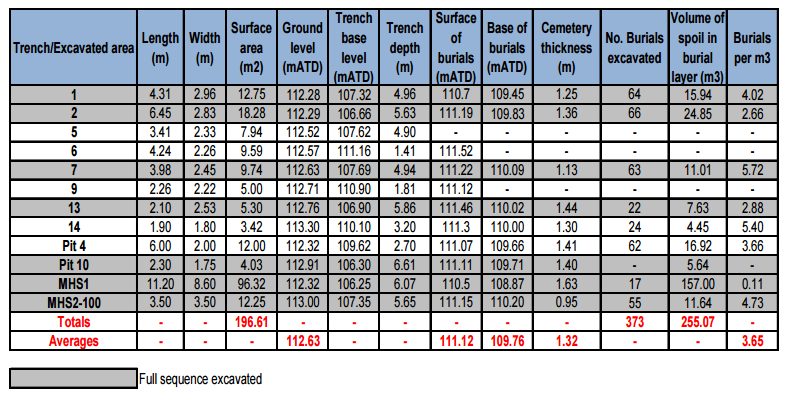
Table 1 (Williamson 2014) – evaluation data used to determine average density of burials per m3 – this was only available where the full sequence had been excavated at evaluation stage for the purpose of a full quantification of the resource (highlighted in grey)
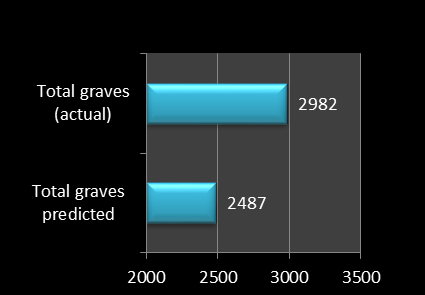
2.4 An average density of burials of 3.65 per m3 (Fig 3) was determined from evaluation phase data (Table 1). The evaluation data demonstrated a likelihood that burial density varied across the site (disregarding outlier MHS1 which was largely outside the burial ground boundary) from min 2.88 to max 5.72 burials per m3. The total predicted number of extant individual graves were calculated (excluding pile lines) to be 2487 (Fig 4).
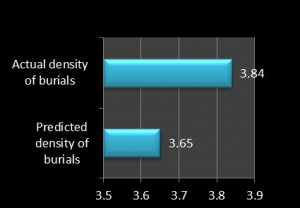

Figure 3 – Grave Density/m3 Figure 4 – Number of graves
2.5 An average productivity rate (PR) of 1.37 excavated burials per site team archaeologist (excluding supervisory staff) /per shift (8hrs), was calculated from the evaluation phase management and field data and combined with data previously collected by MOLA from similar project experience (Fig 5).
2.6 Productive person hours per excavated burial during the evaluation phases (excluding non-productive time, stand down time and other avoidable delays) were calculated from close examination of the contractor’s daily record sheets (Fig 6).
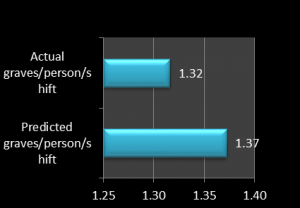
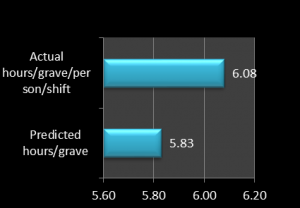
Figure 5 – Average Productivity Rate Figure 6 – Productivity Hours
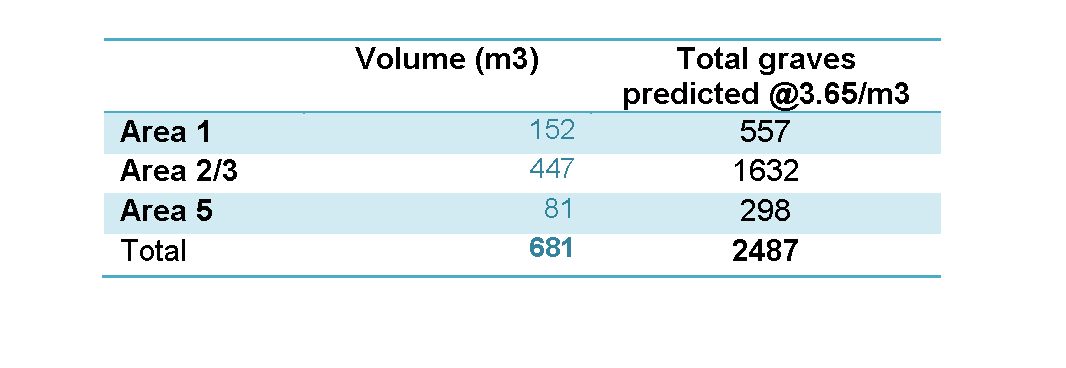
2.7 Estimated numbers of burials expected in the zones of main excavation were calculated taking account of known truncations, such as areas previously removed by the evaluation pits or pile line exhumation trenches (Table 2).
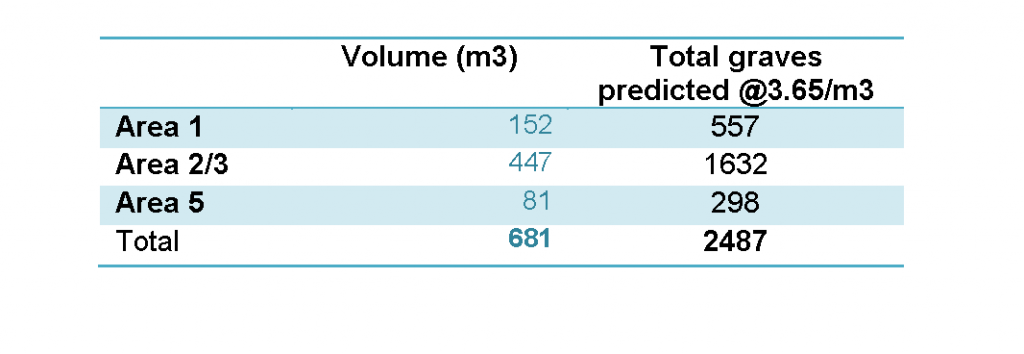
Table 2 – Final areas available for excavation: the total number of burials predicted
2.8 This data was used to predict the required team size and number of shifts to complete the burial ground phase of excavation. In order to ensure construction progress on other matters, works had to progress concurrently with gaining access to parts of the site in a sequence of three phases. The required team size was determined by availability of areas in a sequence that suited the construction work sequence: Area 5, followed by Area 2/3 concurrently, and then Area 1 (area are shown in Fig 7).
2.9 A programme-resource plan analysis indicated that a productivity rate (PR) forecast of an average 1.37 graves/ per person/per shift could be accommodated within the available programme time (Table 3) and this figure was used as the baseline in the resource plan. The variance in the target productivity rate (TPR) value by area, took into account that the forecast was being driven by the main construction programme and resources per shift were adjusted to suit the localised conditions of each area (such as available space and other constraints, concurrent main contractor activities that would affect the works, and local obstructions requiring intermittent breaking out, that existed). Actual figures are set out in Table 4.
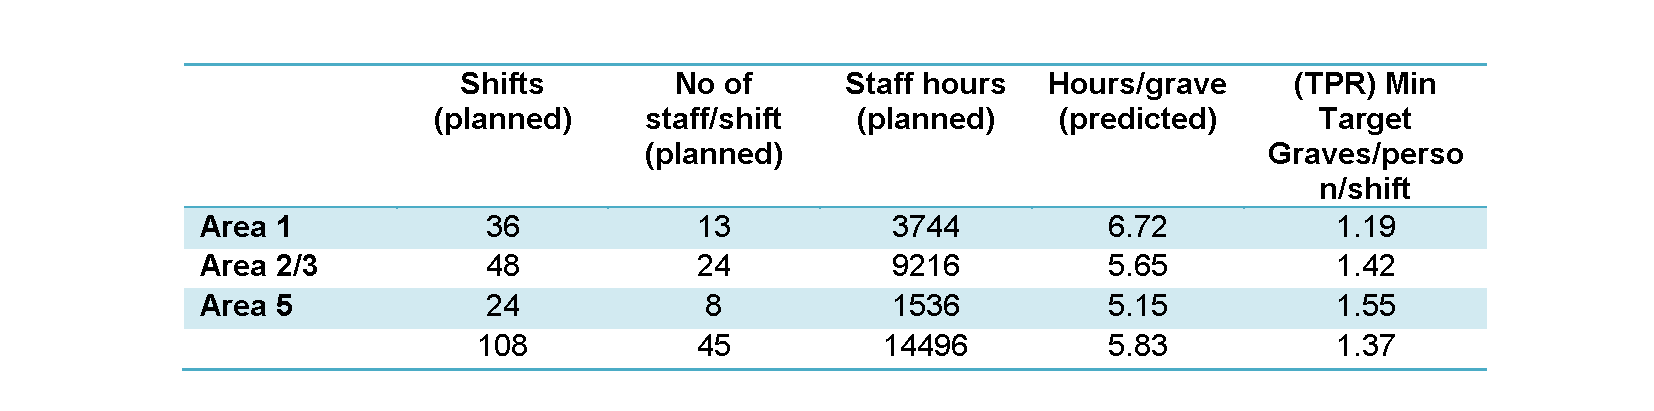
Table 3 – Resource plan data was combined with predicted number of graves to determine target productivity rates (TPR) – No.of graves/person/shift(8hrs)
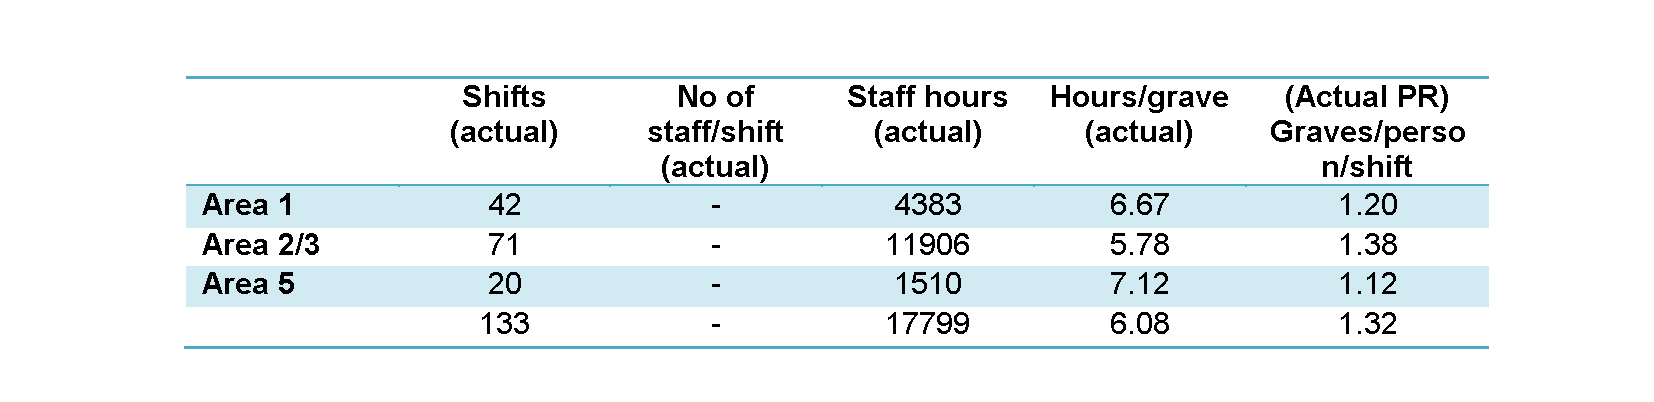
Table 4 – Resource Plan Data, Actual – from site monitoring
3. Project design and sample size
3.1 As described by Carver (2012), the percentage ratio between archaeological excavation and cemetery clearance by a commercial exhumation contractor, from examples of other post medieval/early modern burial grounds that have been recently excavated in London, was found to be as low as 3% to 97% and as high as 23% to77%. Of course, many factors can affect this ratio. Archaeological research objectives, the site condition, and project circumstances all play a role in determining the adopted sample size. It is important that the decision on what sample size is appropriate, should be informed by a full archaeological evaluation of the resource, rather than pre-judged.
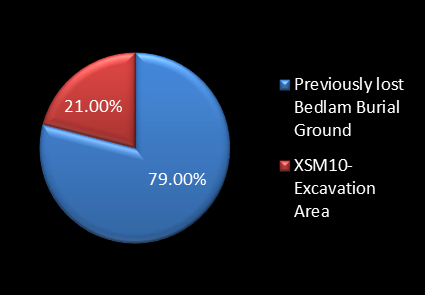
3.2 In order to determine an appropriate archaeological sample for this site the preservation condition of the site and research potential for this particular burial ground was considered. The original burial ground covered an area of one acre (4047 m2). Successive developments since the 1730s had encroached upon the burial ground, leading to a historical loss of around 79% of the cemetery by 2010 (Fig 8). Given the unique role that the burial ground played in London’s history and its position as the city’s very first non-parochial or municipal burial ground, and that very few graves of these dates had been previously excavated to modern standards in London, there was already an indication that archaeological investigation would play a major role in the exhumation works.
3.3 The construction sequence was then closely assessed. An initial assumption that the site would be divided up into areas, and some treated as the ‘archaeological sample’ and others treated as the ‘exhumation clearance’ was rejected on the basis that it would introduce:
- overly complex site-sharing between the two different contractors,
- that archaeological resource would be “used up” on excavation of disturbed deposits, rather than focussed on valuable research led activity,
- and that early access to the ground levels required for archaeology investigation would require temporary earthworks support, and be hampered by potential settlement impacts on nearby buildings
3.4 The presence of an upper layer within the cemetery, which was predominantly shown to be highly disturbed, and therefore of less archaeological value, was also a significant factor.
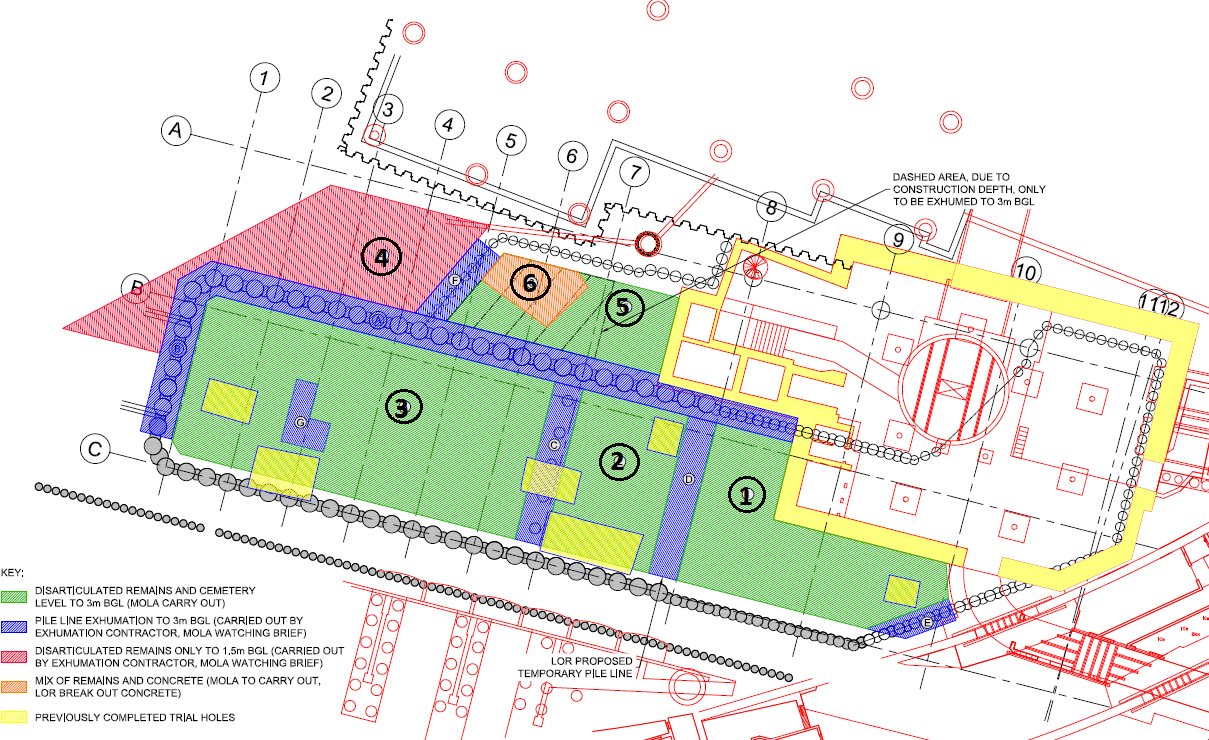
3.5 To construct the station ticket hall, secant pile walls were required to be inserted from ground level. The pre-excavation of the pile lines to remove human remains prior to piling, was mandated by Ministry of Justice advice (Carver 2012), and therefore, since the narrow nature of these investigations would limit the archaeological research value of this task, the ‘pile lines’ were assigned to exhumation clearance (Fig 7).
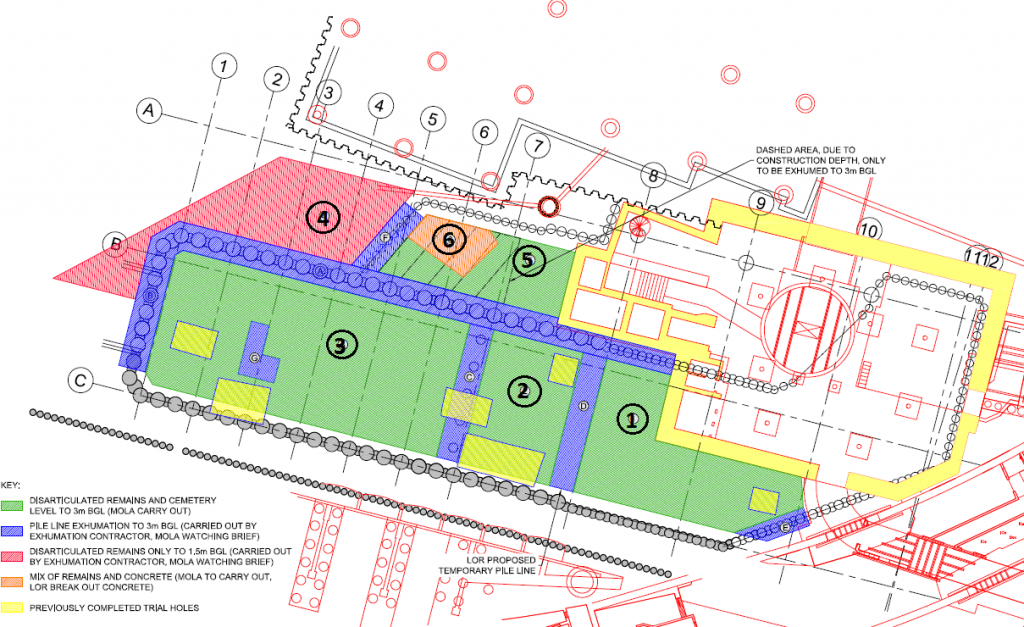
Figure 7 – Excavation areas 1-6 at Broadgate ticket hall
3.6 The remaining areas for excavation were then split between archaeological excavation and professional commercial exhumation; not in plan, but in the vertical plane. The exhumation contractor was assigned to remove the upper disturbed layer of burials containing mostly disarticulated skeletal material and poorly preserved graves. This provided a clear hand-over point in the programme to the archaeological contractor, and ensured that archaeological resource was focused at the most valuable deposits for in situ-recording. The mitigation work proceeded in a sequence to suit the construction programme (Fig 7), Area 5, followed by Area 2/3 combined, and finally Area 1. Area 4 was not required to be excavated, and Area 6 had been previously disturbed in the 1980s.
3.7 Following the pile line clearance and removal of the upper ‘disturbed’ layer by the exhumation contractor, the remaining cemetery deposits were assigned for archaeological excavation. However, within this process two recovery levels were adopted, and applied to specific zones across the site. Category A areas would be subject to detailed excavation and all burials retained for analysis. Category C areas would be subject to excavation and recording in-situ, followed by a rapid on-site assessment record during lifting of a skeleton, (when the bones could be fully examined), by an osteologist (a team of specialists were integral to the site team), prior to submitting the remains to the exhumation contractor for immediate reburial. The purpose of the osteological assessment was to record basic osteological data and also to select a third category (B), whereby graves that met certain research objectives were moved to Category A status (Williamson 2014), thereby preserving the possibility of recovering exceptionally important graves that were originally assigned to the “assessment only” category C. See Williamson (2014) for a detailed explanation of the categories.
3.8 This method ensured that the archaeological research value of this (last remaining) section of the burial ground was fully addressed (all intact graves were recorded and assessed on site), whilst disarticulated material was dealt with by the exhumation contractor. The on-site assessment also injected economies into the post excavation phase, as only a sub-sample of the whole assemblage, assessed as suitable to meet the research objectives, was taken off site for further detailed laboratory analysis.
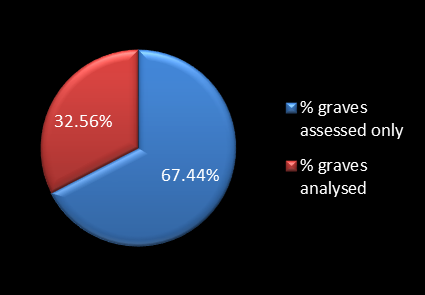
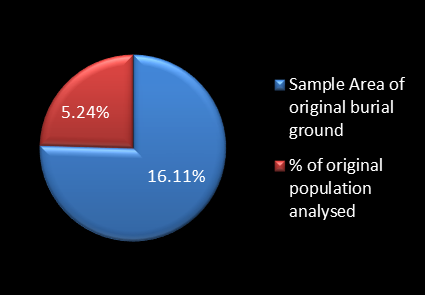
3.9 In terms of sample size, the analysis shows that of the 21% of the burial ground that survived, around 5% was assigned to pile line clearance, and 16% to archaeological investigation (Fig 8/9).
3.10 The split between Category A and Category C areas was designed to be a 40% to /60% split, (Williamson 2014). Due to the fact that excavation recovery category A areas were designated in those areas that had seen less modern disturbance, the actual ratio was 54% to 42% in practice (Fig 10/11). One hundred and eighteen category C burials were reassigned to category B on site as a result of the onsite assessment due to exceptional interest or preservation.
3.11 Of the individual graves investigated and recorded on site, 33% were subject to detailed analysis (Fig 12). This represents a net sample of the original burial ground population of 5.24% (Fig 13).

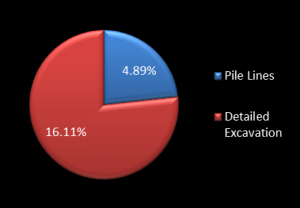
Figure 8 – Whole site survival Figure 9 – Split between pile lines and area excavation
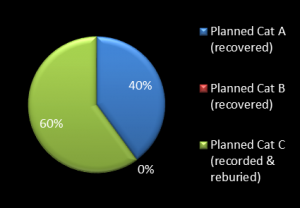
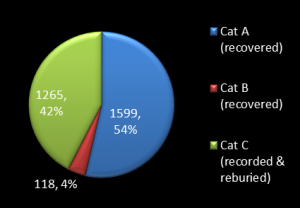
Figure 10 – Planned recovery categories % Figure 11 – Actual recovery numbers of burials and %


Figure 12 – Recovered skeletons assessed/analysed Figure 13 – Actual sample of burial ground analysed
4. Monitoring
4.1 In anticipation of this analysis, Crossrail required the archaeological contractor to keep a detailed data record of staff present on each shift, number of graves excavated per shift, and details of any delays to progress (minimum 10 minutes). This was provided to the Crossrail supervising archaeologist at the end of each shift. A project dashboard (Fig 14) was maintained on a daily basis for each excavation area and reported to the project weekly team meeting.
4.2 The dashboard database allowed a detailed day by day picture of progress against the baseline forecast to be recorded, and progress reported in different daily and weekly formats. The collection of this data allowed a post project analysis of outcomes against forecast to be carried out.
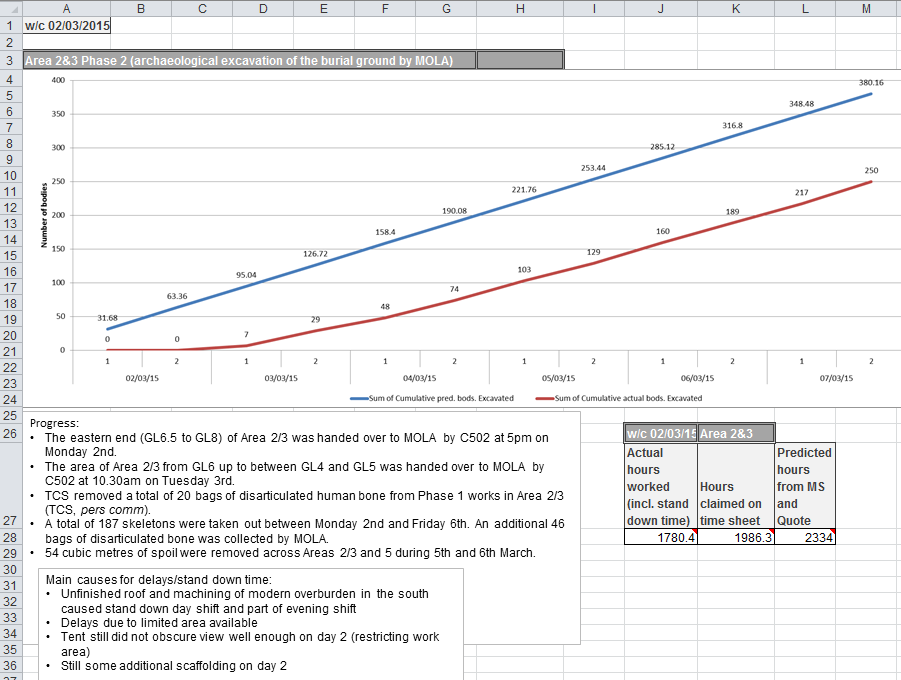
Figure 14 – Example of daily dashboard
4.3 Forecast baseline metrics for team size, expected number of burials and productivity rate were entered into the data base and matched to the baseline (planned) programme start and end dates for each area. The dashboard provided space to enter details of progress, general notes, and specific causes and duration of any delays.
4.4 It was possible to output various format graphs depending on the level of detail required for reporting, and which metric was being interrogated. For the Area 5 excavation, Figure 15 illustrates progress of the excavation against the baseline which matched the predicted productivity for the first week and then tailed off due to fewer skeletons in that area being present than anticipated.
4.5 It was anticipated that the predicted figure would not be met in the first week, because the excavation team had to get used to the recording method. However, there was only a slight lag in the first few days after which the pace picked up and the predicted figure was met.
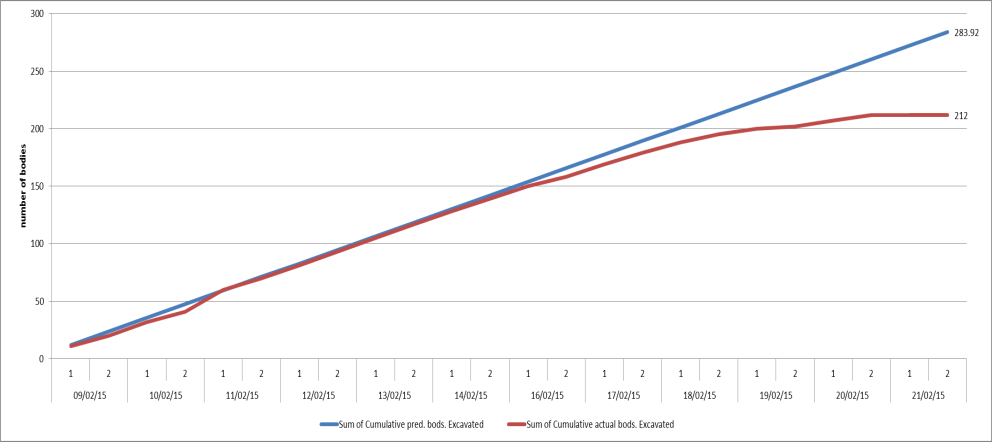
Figure 15 – Dashboard output Area 5 – x axis graves excavated – y axis daily record
4.6 In Area 2&3 the actual figure followed the predicted figure quite closely (Fig 16).The lag at the start of the excavation represents delays during the first three shifts as the roof was being installed. However, the productivity rate was back on track after the initial delays.
4.7 After three weeks, the actual figure overtook the predicted figure due to about 25% more skeletons being present than anticipated. The graph also highlights a problem of spoil removal that was faced in the last week of the excavation. Although the whole area was excavated by the 3rd of April, a small area below the spoil heap still had to be excavated and a further 58 skeletons were recovered in the following week.
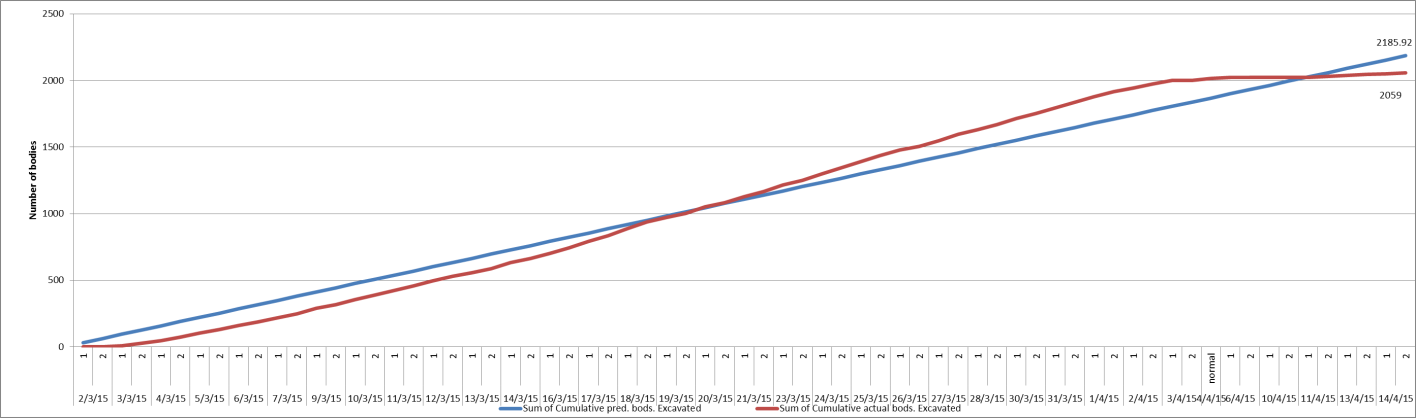
Figure 16 – Dashboard output Area 2&3– x axis graves excavated – y axis daily record
4.8 In Area 1 the actual and predicted line were very far apart (Fig 17). The excavation started slowly as roof installation and an unplanned bank holiday stand-down delayed the programme. Once these delays had been resolved, the work recovered, and in fact beat the programme target, even though graves exceeded the predicted number.
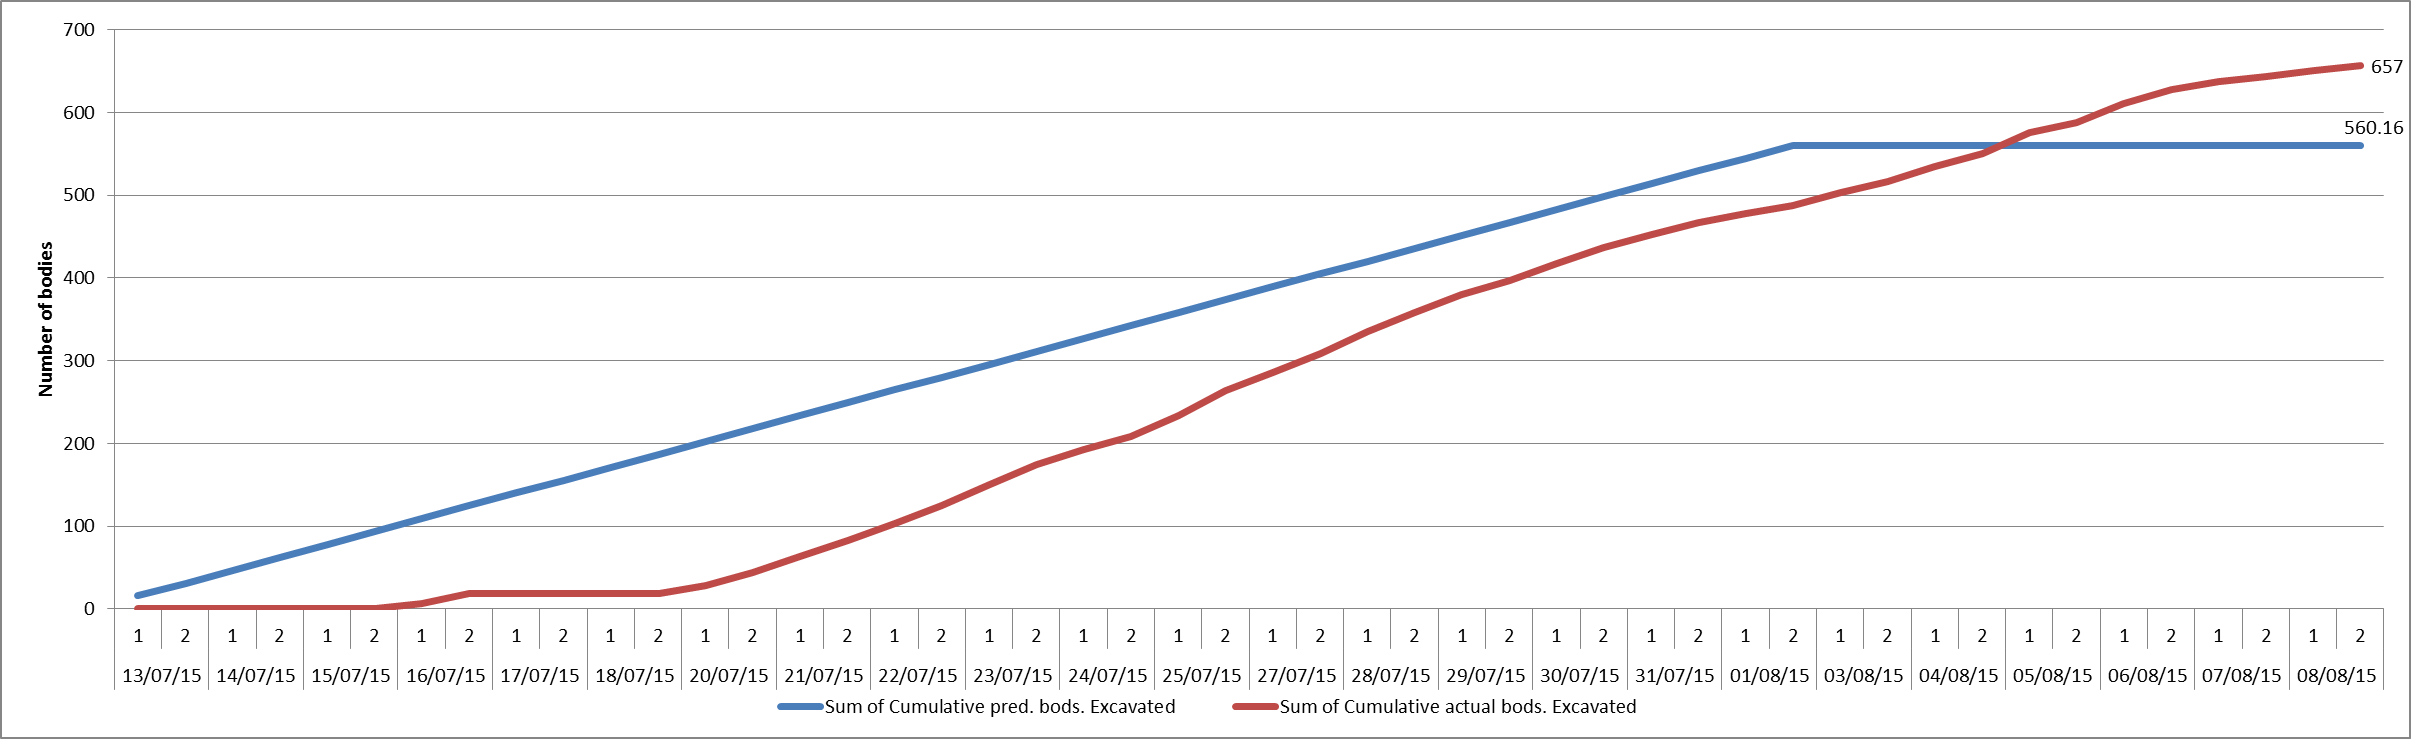
Figure 17 – Dashboard output Area 1– x axis graves excavated – y axis daily record
5. Sources of delay
5.1 Delays and stand-downs for essential Health and Safety (H&S) reasons and Continuing Professional Development (CPD) activities were recorded against a number of categories. In each, the duration of a stand-down and the number of active staff affected, was recorded and entered in the dashboard database. Delays/stand-downs were recorded in the following categories:
• Engineering: delays caused by construction and engineering issues for example, essential site maintenance, insufficient main contractor resources to support archaeological work, other works such as deliveries and lifting preventing archaeological works.- Archaeology: delays caused by unexpected or increased quantity of archaeological resource.
- Community outreach and CPD: Outreach activities were organised by the archaeologists for example spending time on the viewing platform talking to visitors and giving presentations. CPD activities consisted of breaks in work for training courses or information sessions/lectures.
- Health and Safety: these were essential stand-downs for new staff inductions, essential team briefings and safety incidents.
- Weather: A temporary roof on each area was intended to eliminate delays due to weather, however the roof quality in Areas 1 and 5 were not always able to cope with heavy rain, causing for some delays.
- Unplanned stand-downs: Stand-downs that occurred when the required main contractor supervision level was reduced or absent. These often happened during bank holidays (BH) when there were fewer construction staff present or available.
5.2 The actual delays and stand-downs differed from area to area, for example Area 1 and 5 did not have a viewing platform and therefore did not have community outreach, although media visits did occur. The main factors which caused some delays to the programme were increased numbers of burials in Area 2/3 “unexpected archaeology”, and the impact of the main contractor working concurrently on the site, “engineering issues”. “Health and Safety” impacts included additional inductions,safety tool box talks, and these were essential to make sure the work was executed safely. Figure 18 below shows the types of delay/stand-down time that affected each area and the relative impact percentage.
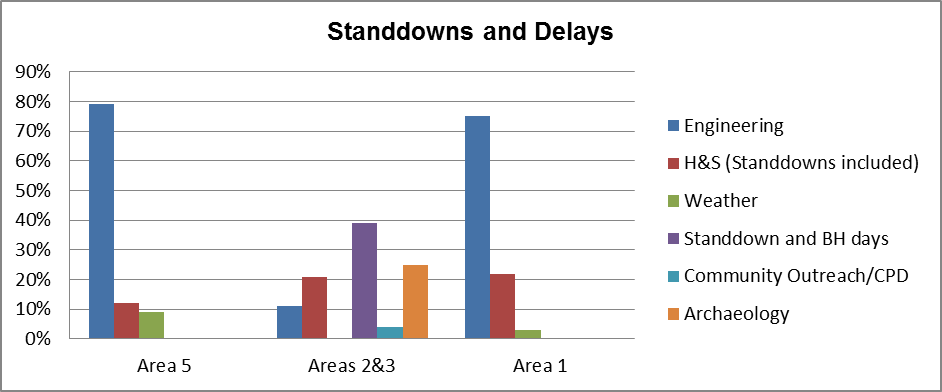
Figure 18 – Stand down and delays by area
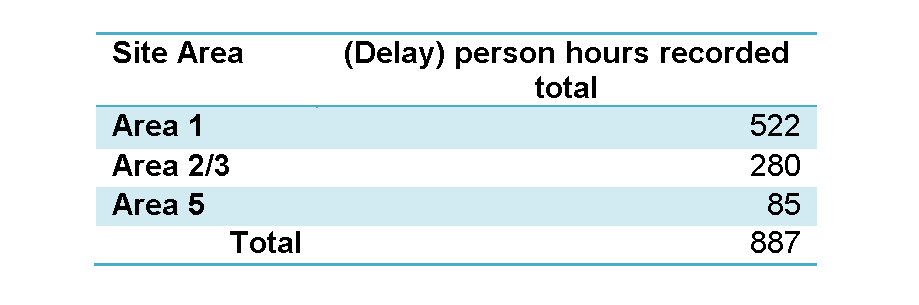
Table 5 – Quantification of lost hours due to delays
5.3 Table 5 presents the total recorded lost person hours due to delays and stand-downs. It is interesting to note the correlation of these figures with the size and accessibility of the work areas. Areas 1, 2 and 3 were all roughly the same size. However, the effect of combining Areas 2 and 3 into a single work area perhaps shows the positive impact of a more open working space on the type of work being performed, whilst the majority of engineering delays occurred in the more constrained zones.
5.4 In Area 5 the excavation went to schedule, although initially roof installation caused some delays to the start of phase 2. Heavy rain and bad weather also caused for some minor delay in Area 1. Access to the site was initially restricted because of delayed roof construction. There was some stand-down time for water ingress due to heavy rain, but this did not affect the excavation programme significantly. In Area 1, there were engineering delays because the area was constricted, which made the logistics for access and muck-away more complex.
5.5 Although the construction of temporary roofs over the areas was more complex than expected and caused some delays during installation, it negated the potential disrupted effects of adverse weather which could have otherwise led to serious time-loss. The roof cover, equipped with daylight quality shift lighting, also facilitated evening shift work, which aided the acceleration of the programme overall.
5.6 Health and Safety interventions were the next most common source of delay. Additonal toolbox talks, briefings, and hazard spotting exercises can add time to the programme, but are crucial to keep the working conditions on site safe. Taking time out to consider site safety and people’s wellbeing helps prevent injuries and accidents, and can reduce serious harm and lost time incidents. In area 2&3, a full safety stand-down was necessary after a series of minor incidents on site, although this delayed work for only one day; it made sure that there were no more subsequent incidents and therefore prevented any more lost time. Other stand-downs were due to shifts being cancelled on bank holidays which were planned to be fully staffed according to the baseline programme
5.7 Unexpected archaeology was only a factor in Areas 2&3 due to the recovery of 33% more skeletons than predicted.
5.8 There were concerns at the planning stage about delays caused by opening up the site to the public at certain points in the programme, as it would slow down excavation and take up members of the archaeology team for a period of time every shift. However, the data collection showed that the delays caused by the viewing platform were minimal and it offered very clear benefits to the wider PR agenda. Project staff, visitors and stakeholders could view the site from a safe area without the need for PPE (Personal Protection Equipment), and therefore the number of individuals needing site visitor inductions and escort by team mebers for actual site access was reduced. Activities on the viewing platform in Area 2 & 3 only led to a very minimal delay.
5.9 In summary, the delay tracker was a useful method to identify problems and delays to the programme early. It also highlighted where delays were prevented and where they could have been prevented had different measures been taken. Preventable delays that did occur were stand-downs during bank holidays, which could have been avoided by better forward planning with the construction contractor about the resources needed for weekend and holiday working, allowing sufficient staff to arrange to work the necessary shifts.
6. Results
6.1 Analysis of the main factors covered by the metric recording for the project is set out in Tables 6 and 7, and Figure 19, and are explained as follows.
6.2 Quantification of resource: grave density – Grave density as predicted from the evaluation was found to be underestimated by 5.21%.
6.3 Quantification of resource: Number of burials – The total number of individual graves recorded was found to be 17.73% higher than anticipated. This can be attributed to the impact of multiple occupancy graves that were present, but were not identified clearly at the evaluation stage.
6.4 Quantification of time and Staff Productivity rate: The number of shifts required and number of staff hours required to complete the task was underestimated by 23.15% and 22.79% in the project design. This result was driven by a combination of delay factors, with stoppages for concurrent engineering works, unplanned stand down periods and increased numbers of skeletons being the predominant factors.
6.5 Staff Productivity rate – When we look at the productivity rate of staff in terms of hours spent per person on each grave (and the rate of graves excavated per person per shift (Resource productivity rate) is of course the same), the outcome is an underestimate of 4.29%.
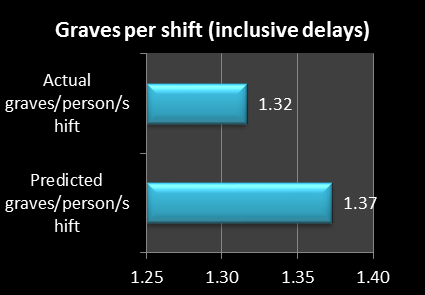
6.6 Graves per shift (less delays) – When we factor in the delay time to the productivity rate, we find a less than 1% variance in the predicted versus the actual rate, and that the site staff excavators, based on the grave excavation rate, actually beat the target of 1.37 graves per person per shift, despite the increased number of individual graves (Figure 20).
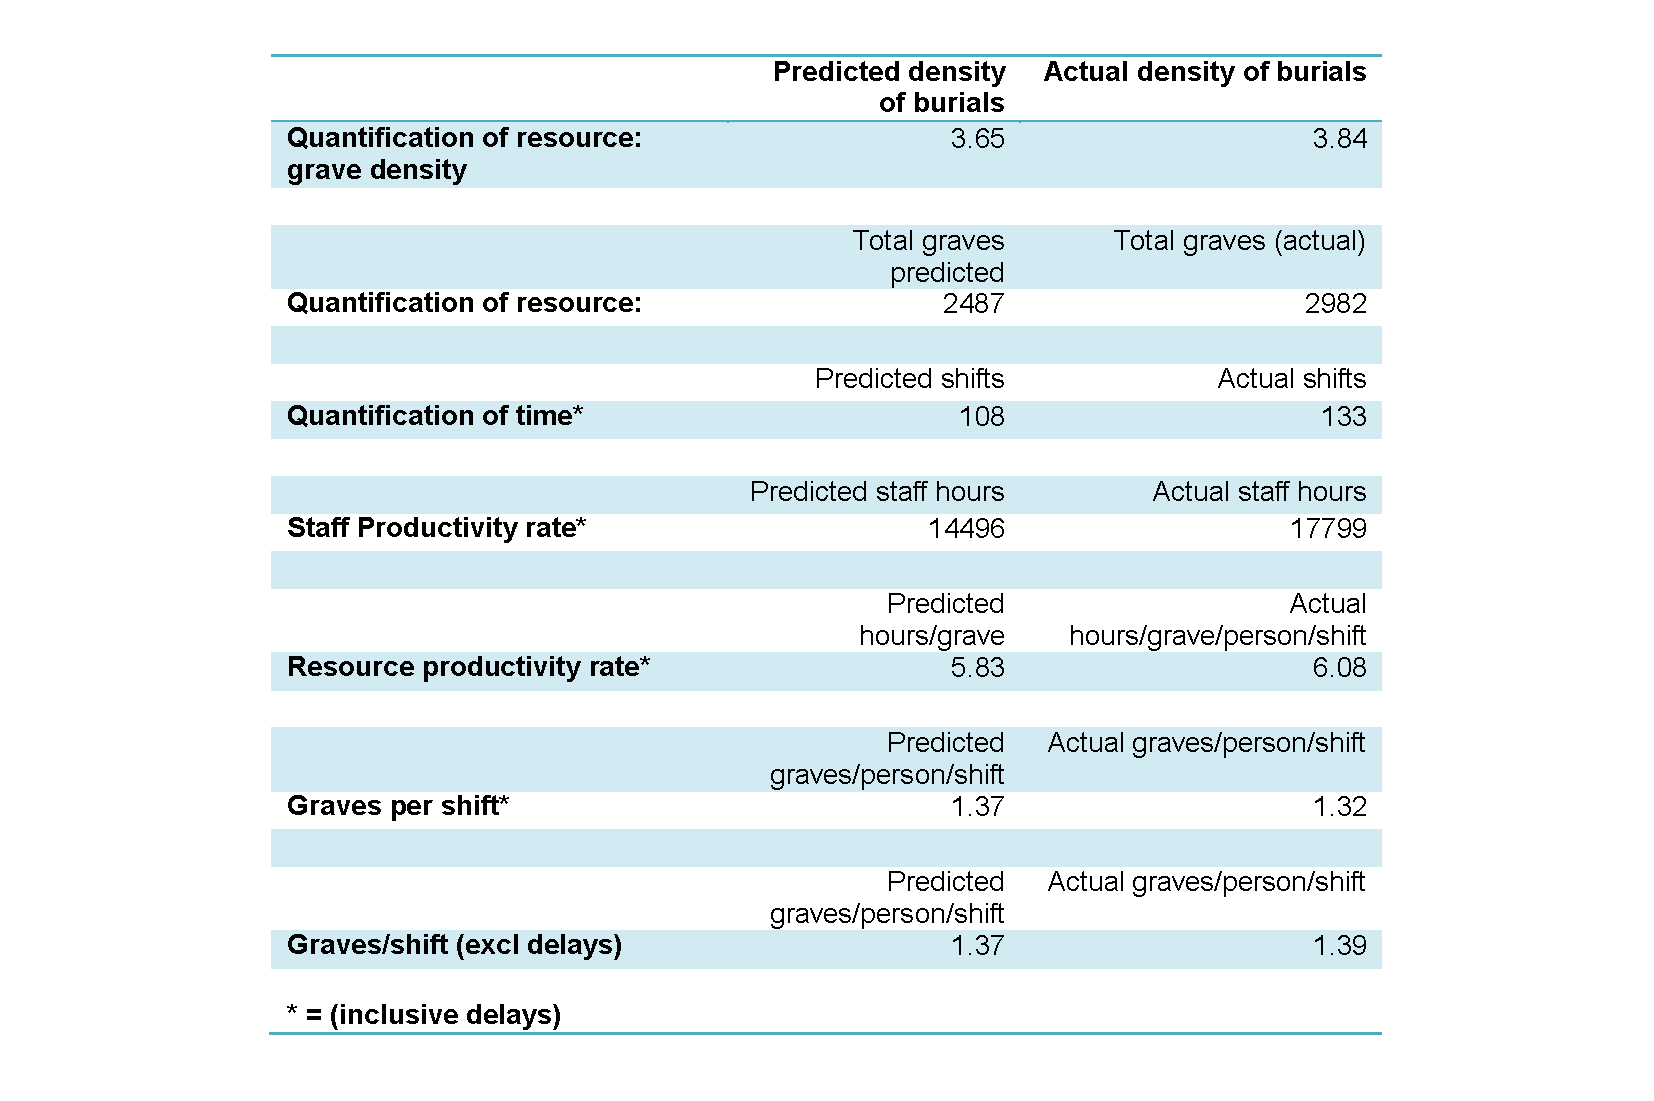
Table 6 – Forecast versus actual metrics
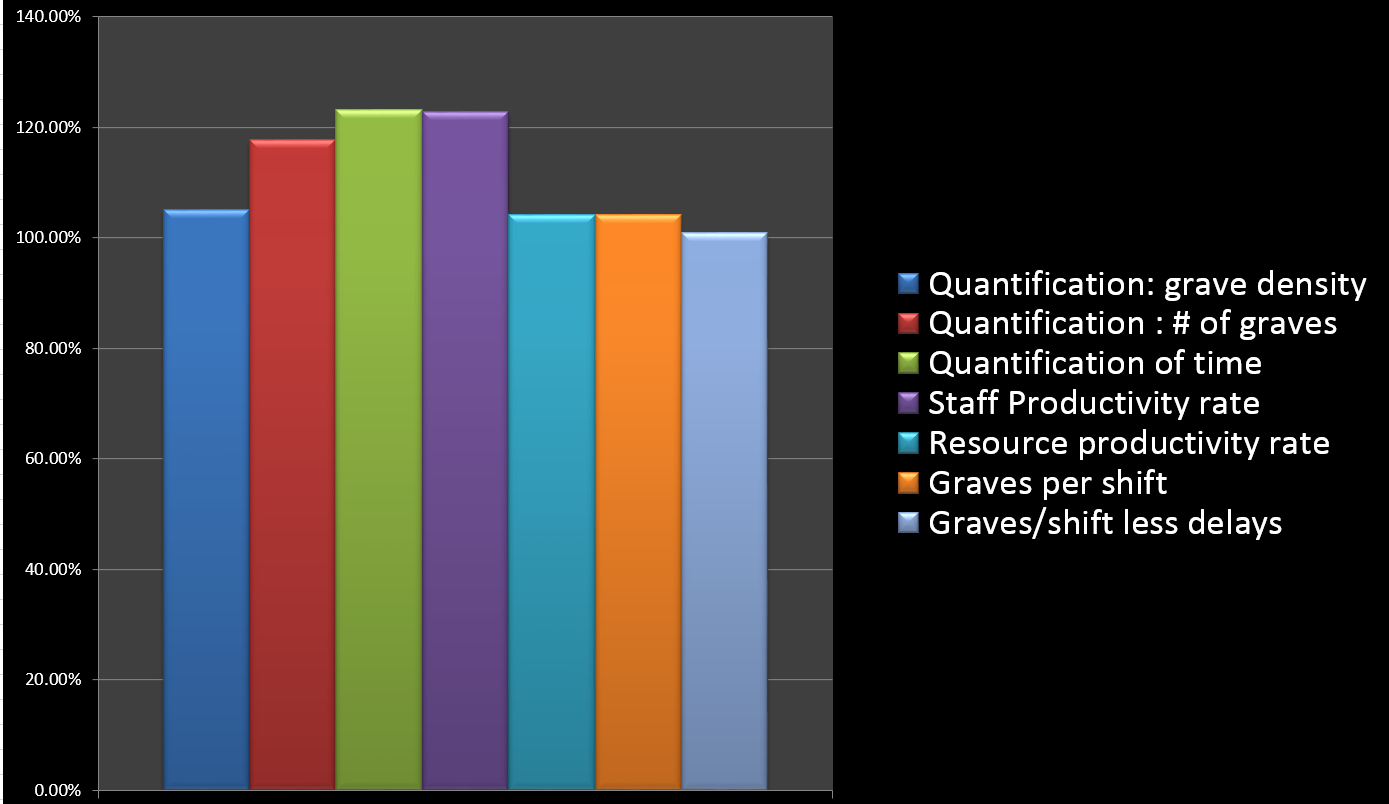
Figure 19 – Graphic showing accuracy of predicted versus actual outcomes
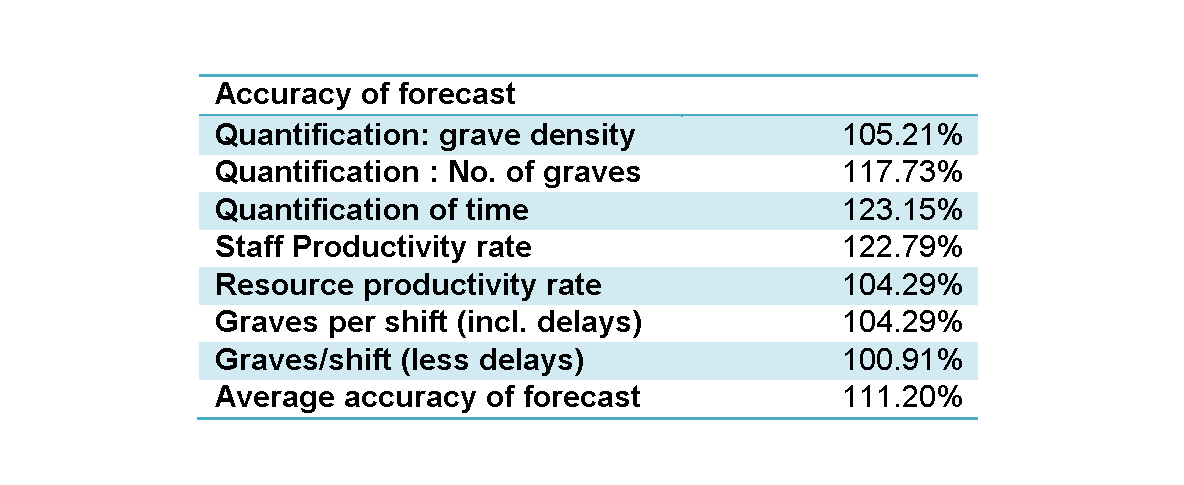
Table 7 – Accuracy of predicted versus actual outcomes

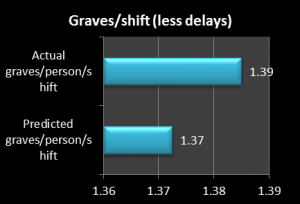
Figure 20 – Impact of delays on productivity metric
7. Conclusion
7.1 When the metrics are combined together, the model demonstrates an overall accuracy average of -11.20% (Table 7). That is, that against all measures, the average prediction was found to be undervalued by 11.20%. Contingency built into the project design and construction programme covered these increases, in the case of this project.
7.2 As a basic predictive model for project planning, we believe that this case study demonstrates a robust methodology for assessing the resource profile, quantification of archaeological resource and programme requirements for archaeological excavation within historic burial grounds.
7.3 We believe there are three very clear messages from this case study. The first is that the key information on the geometry of the burial ground, and hence the assurances provided to the project programme and cost plan, would not have been achieved without the “full depth” evaluation, and monitoring of metrics, during the evaluation phase. The evaluation phases not only achieved the aim of establishing a reasoned mitigation sample plan driven by the condition and preservation quality of the archaeological resource, but provided the key data metrics to plan time, resources, and necessary temporary works and attendances to achieve the project goals, and avoid disrupting the wider construction objectives. Indeed, that assurance allowed the team confidence, to address some of the projects’ other aims, in bringing the investigations to the attention of the public and the projects’ key stakeholders through a detailed community education and media plan.
7.4 The second key message is that, despite applying a scientific and focussed approach to the planning of this project, changes to the forecast baseline did occur, and did affect performance. It is therefore essential that sufficient contingency is provided to cover the issues raised in Section 5 above. Adequate time should be given to the project design stages to work through all the possible options in terms of work sequence and identify obstructions to the plan in advance. This was achieved at Liverpool Street through a continual series of whole team workshops, on a weekly basis, both in advance of, and during the site work activity.An important element of these was that designer, main contractor, and archaeology contractor all attended, developing early relationships and creating robust and effective communication.
7.5 The third issue that this paper illustrates is, that although archaeology is a difficult activity to predict productivity, the repetitive process of historical burial ground excavation provides an ideal case for testing our assumptions with measured metrics.
8. References
Carver J, M Court and N Elsden (2011) “The London Crossrail project, desk study, reconnaissance and evaluation. Data sources and outcomes Liverpool Street – a case study”, In the Proceedings of 16th International Conference on ‘Cultural Heritage and New Technologies’ Vienna, 2011, P576-591. http://www.stadtarchaeologie.at/wp-content/uploads/eBook_CHNT16_Part4.pdf
Carver, J. (2012) “London Crossrail: The New Churchyard AD1569 to AD1714. Archaeology investigation and dealing with mass exhumation“, in ‘the Proceedings of CHNT 17’, 17th International Conference on ‘Cultural Heritage and New Technologies’ Vienna, 2012 http://www.chnt.at/wp-content/uploads/eBook_CHNT17_Carver.pdf
Court M (2008), “Archaeology Detailed Desk Based Assessment – Liverpool Street Station CR-XRL-T1-RGN-CR001-50005″. Crossrail Work Package 3.
Elsden N (2015). “Broadgate Areas 1 to 6, Method Statement for Excavation and Watching Brief”. Prepared by MOLA for Crossrail Ltd. Unpub.
Hartle R (2012) “Crossrail Broadgate Ticket Hall Evaluation & GWB R Report [XSM10]”. Report by MOLA for Crossrail.
Williamson I, (2014) SS-WSI Addendum for Archaeological Excavation and Watching Brief at Liverpool Street Station Broadgate Ticket Hall C502-XRL-T1-RST-CR101-50002
-
Authors
Jay Carver BA (Hons) MIFA - Crossrail Ltd
Lead Archaeologist, Crossrail
Jay was appointed by Crossrail to the technical directorate to author and develop the standards and procedures, procurement model, development of scope and specification for the archaeology framework contracts, tender evaluation of technical submissions, and oversee design consultant deliverables for the Crossrail Archaeology programme in 2006. He joined the Crossrail delivery team in 2010 to oversee completion of the detailed scope and programme design by Crossrail’s design consultant framework, liaise with all projects across the programme to ensure archaeology and non-listed built heritage works were successfully integrated into project programmes.
Between 2010 and 2016 he has overseen the successful delivery of all archaeology survey and mitigation works during construction of Crossrail. He acted as Crossrail lead spokesperson for archaeology stakeholder, community relations and media events during the course of the programme.
Jay’s previous infrastructure experience includes project lead archaeologist for numerous major highway schemes (including the 28Km A46 Newark to Widmerpool dual carriageway in Nottinghamshire) and the London DLR City Airport extension, and as Senior Archaeologist for the High Speed 1 Channel Tunnel Rail Link project between Folkestone and London St Pancras.
Jay has delivered numerous conference papers and lectures on the archaeology of the Crossrail project, some of which can be found in the legacy section, and he is author of the Historic Environment and archaeology sections in the CEEQUAL manual, and CIRIA Environmental good practice on site guide (4th Edition), and Cultural Heritage sections in the Highways England DMRB (various, including Vol. 10 Design Guidance). He is co-author of the CIRIA best practice guidance Archaeology and Development (2008).

Marit Leenstra - Crossrail Ltd
Archaeology Assistant