Use of linked monitoring systems for asset protection at Finsbury Circus during SCL tunnelling for Crossrail Station.
Document
type: Technical Paper
Author:
B. Szabo, J. Brzeski, Javier González Martí MSc MBA, ICE Publishing
Publication
Date: 07/09/2015
-
Abstract
Underground construction projects in inner city environments inevitably induce surface and sub-surface ground movements. The detection and management of these ground movements is essential in order to maintain a safe environment for inhabitants inside the zone of influence and to protect all existing infrastructure and properties.
The listed buildings of Finsbury Circus situated directly above the Crossrail tunnels consist of multiple large properties from the 1900’s, with basements and other confined spaces. In order to be able to react to quick ground movements and protect the properties from any considerable damage, it is necessary to have a robust monitoring system in place. The traditional approach until now was to have an automatic system monitoring the outside facades (through Robotic Total Station), and different manual or automatic system in order to monitor the inside of the structure (depending on the size and constraints of the structure to monitor). The article shows how two different automatic systems were linked together in order to provide a continuous grid of absolute data, in and out of the structure. The systems needed to be not only automated, and in the same reference grid, but provide a good level of repeatability, and the confidence that they could be checked against a more traditional approach, such as manual levelling.
The linking of these normally disparate automatic monitoring systems, through their internal configuration and/or their design, is an innovative approach to Instrumentation and Monitoring (I&M). Through this it was possible to assess structural, surface and sub-surface movements, in order to provide data that allowed rapid volume loss calculations and provided invaluable guidance to the construction and compensation grouting teams.
The intention of this article is to present the final stage of this efficiently implemented, combined method which was a result of the collaborative effort of Soldata, BBMV joint venture and Crossrail.
-
Read the full document
1. Introduction
“Tunnelling is a form of civil engineering construction, carried out in an uncertain and often hostile environment, and relying on the application of special knowledge and resources”.
(CIRIA, 1978) [7]
These were the opening lines of the HSE article prepared by W S Atkins “The risk to third parties from bored tunnelling in soft grounds” (Lance & Anderson, 2006)[11] and their application in today’s World is just as relevant.
Tunnelling in soft ground is one of the highest risk constructions undertaken in an urban environment (Atterwell, Yeates, & Selby, 1986)[1] and (Serratrice & Magnan, 2002)[14]. Although new tunnelling systems and machines have evolved to be very safe and reliable, the main cause of the risk is the high concentration of population and assets per square meter in the works zone of influence. This has led to the developments in other fields, such as ground investigation techniques, mitigation strategies and in the field of Instrumentation and Monitoring.
Even with these improvements in the industry, there are still accidents such as the Heathrow Express collapse in 1994 or El Carmel Tunnel Collapse in January 2005. As Crossrail Limited (CRL) states “all accidents are predictable and preventable”, and this should be applied in its full extension. Arguably, the main tool in order to predict and prevent accidents from happening in assets while constructing is a well designed and implemented monitoring system, together with a group of experts that can analyse the results in order to take the right decisions.
This article summarises the innovative design, installation and configuration of the different monitoring methods used in the assessment of ground movements affecting the structures of Finsbury Circus as a result of the construction of the new Crossrail Station at Liverpool Street. A discussion on the level of accuracy, repeatability and reliability of the different monitoring systems used is also presented, along with an explanation of why the final system implemented is an innovation in the monitoring industry.
In section two we will go through some necessary definitions and concepts in order to have a better general understanding throughout this Paper. Section three will describe the project itself and its constraints. Section four will explain how the different systems were linked together, discussing the different formulae and assumptions made. Section five will show how the data was treated, filtered and interpreted by the different parties. Section six will discuss the final data and how it was used, and finally the conclusions will be stated in section 7.
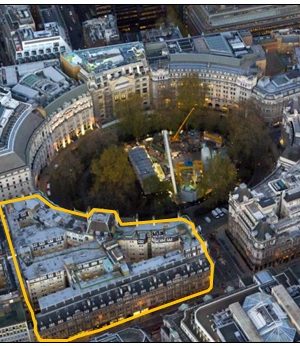
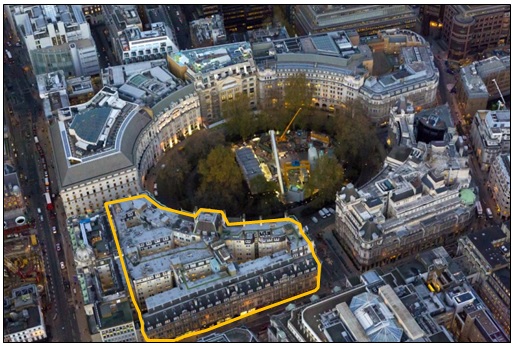
Figure 1 – Finsbury Circus aerial view. Salisbury House outlined in orange.
2. Monitoring techniques used
Instrumentation and Monitoring (I&M) systems have evolved greatly in the last few decades and new applications of traditional techniques have also been developed. Without having a deep understanding of all the different I&M techniques it is challenging to decide which are the most suited to the problem at hand. As well as choosing the correct sensor one must also consider where to install them in order to get the required information and how to correlate the different information obtained. In the authors’ experience, these three questions of what, where and how are not often answered in the design stage, and are implemented while the construction has started once there is a better understanding of the different constraints (real zone of influence, more accurate ground investigation, specific site visits from the different contractors, etc.). These concepts are explored further in (Cuevas, et al., 2012)[8].
The intention in this section will be to explain the different monitoring systems required by the contract in order to protect the different assets, and how they were implemented in order to go beyond what was requested to provide more value.
2.1 Definitions
It is necessary to define some of the terms that will be used during the article when reporting instrument performance. The following definitions are taken from (Dunnicliff, 1994)[9].
- Resolution is the smallest division readable or measurable on the instrument. Interpolation by eye between divisions generally does not improve the resolution, as the estimation is subjective and operator dependent.
- Accuracy is the degree of correctness of a measurement, or the nearness of a measurement to the true quantity. The accuracy of a measurement depends on the accuracy of each component of the monitoring system. It is generally evaluated during instrument calibration, where a known value and the measurement value are compared.
Accuracy is expressed as ± ‘x’ units, meaning that the measurement is within ‘x’ units of the true value.
- Precision is the reproducibility and repeatability of measurement, or the nearness of each of a number of measurements to the arithmetic mean. Precision is also expressed as ± ‘x’ units, meaning that the measurements is within ‘x’ units of the mean measured value and is often assessed statically with a degree of confidence associated with the statistical distribution; a larger number of significant digits reflects a higher precision.
- Noise describes the random measurement variation caused by external factors. Excessive noise results in lack of precision and accuracy, and may conceal small real changes in the measured parameter.
Combinations of the above measurements uncertainties manifest themselves as measurement error, which is the deviation between the measured quality and the true value.
- Repeatability (this concept is not addressed in Dunnicliff) is the variation in measurements taken by a single person or instrument on the same item and under the same conditions. It will describe how consistent an instrument is, taking into consideration all the possible errors affecting it, if any.
The following definitions are originally presented by (Burland, 1995)[3]. The below are the factors usually related to structure damage control:
- Rotation or slope θ is the change in gradient of a line joining two reference points
- Relative deflection Δ is the displacement of a point relative to the line connecting two reference points on either side.
- Deflection ratio (sagging ratio or hogging ratio) is denoted by Δ/L where L is the distance between the two reference points defining Δ.
2.2 Precise Levelling
Precise levelling provides the difference in height between different points. The system’s accuracy and repeatability will depend on constraints such as levelling circuit total distance, type of instrumentation used, and the number of step-ups within the same circuit. Assuming best practice is used human error can be discounted.
Because of its simplicity, flexibility, robustness, and easy installation of the measuring points, precise levelling is the most common of all of the monitoring techniques. It is usually used as a contrast for all the other monitoring systems in order to verify vertical movements.
2.2.1 Layout of monitoring points for precise levelling
The design team will determine the outline position of the levelling points and the monitoring team will adopt best practice and common sense in order to achieve and provide meaningful readings and precisions and satisfy the specification.
The monitoring team will also be responsible for the following:
- Benchmarks (references) out of the zone of influence and built in structures that will not be affected by the works being monitored, and if possible by any other works or activities that could vary the absolute position of that specific point.
- A network between benchmarks, following precise levelling techniques and equipment (ISO-17123-2) in order to be able to control their stability, making sure that no erroneous tendencies will be introduced in the readings, due to an unexpected movement of a benchmark. Corrections among them and in the different circuits must be done periodically.
- The different circuits should not exceed the distance or set-ups that would not permit providing the required accuracy and repeatability in order to satisfy the specification.
- Avoid any of the different factors that could affect the readings, such as peak traffic hours, extreme heat or cold day times (use INVAR equipment),
- Undertake periodic calibrations of material and instruments, match-up teams with levelling equipment.
It is always recommended to have several readings from these points in a network before starting any site activity to establish a baseline.
To avoid introducing error in to the readings the contractor must also consider the use of the following as discuss in (Chueca Pazoz & Herraez Boquera, 1996)[6]:
- Modern models of precise levelling instruments
- Steady tripods
- Invar staffs with bar codes less than 2m in height
- A light sensing device.
The below sensors are related to this type of system (manual monitoring through precise levelling).
- Levelling Points (LP), installed in the ground (foot paths and roads).
- British Research Established (BRE) sockets (LB), in the building facades, and inside the building at low level.
- Invar scales (LC’s), drilled in to the load-bearing walls.
These sensors have multiple purposes:
- To verify/validate the automatic systems.
- As complementary information for the areas where the automatic systems cannot reach.
- As a mitigation for when automated readings cannot be obtained.
2.3 Automated Optical System
As automatic monitoring systems are subject to many factors that can introduce bias or misleading data it is essential to add a contrasting system such as manual monitoring in order to provide a check. The Robotic Total Station (RTS) automatic optical monitoring system consists of the following items:
- RTS: Measuring device. Its location depends on the construction area; ideally it should be able to measure a minimal amount of references within acceptable distance. As in most of the cases the size of zone of influence exceeds the maximum distance of measurement so a networked solution is required.
- Monitoring targets: represent the monitoring points specified by the designer. These points are most of the time inside the zone of influence. The required frequency of measurement and visibility/distribution of these points will influence the amount of RTS to be installed.
- Reference targets: should be out of the zone of influence. Reference targets must be distributed in the maximum of directions (horizontally, vertically and in distance) around the RTS in order to provide a balanced reference system.
- Common targets: only used if the size of the area to be monitored requires installation of several stations. Can be monitoring or reference targets at the same time. These points allow the observations of reference targets to be used by all RTS in the network.
RTS’s can work as standalone or group configurations depending on the requirements and constraints of the specific construction sites.
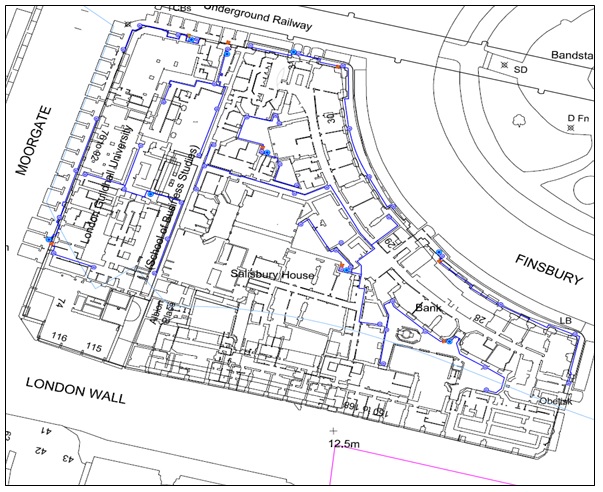
Figure 2 – Salisbury House facade Prism distribution, from CRL internal documents
Once all the items are in place, the configuration of the system and processing of the data can differ from one company to another, but it will always follow surveying methodologies. Depending on how robust the data processing chain is, we will have more or less repeatable data. For this specific system, and how it’s being used in this project, precision and repeatability is more important than accuracy. For further understanding of these systems we advise referring to (McCormac, 1983)[12] and (Wilkins, Bastin, & Chrzanowski, 2003)[15].
In the specific example of Finsbury Circus, the wide extents of the Zone of influence (ZOI) and the building layout required a group configuration that guaranteed sufficient redundancy among common points and reference coverage. The monitoring prisms were installed in different rows and columns on each facade following the design (see Figure 2) This measurement grid provided enough information to calculate deflection and slope, which is more critical for the buildings than the global settlement or heave, a view supported by (Burland, 1995)[3].
2.4 Water cells
Water cells are a hydrostatic multi-point system using the communication pipes principle, which allow for continuous data recording in order to have automated monitoring.
In general terms, water cells are a set of containers containing a homogeneous fluid. When the liquid settles, it balances out to the same level in all the containers regardless of the shape or volume of the containers. The homogenous liquid is reached by maintaining constant conditions in terms of air pressure, hydrostatic pressure and gravity at each position of the system at the same level.
The system usually has limitations of the distance and difference in height between the cells, which doesn’t allow for unlimited extensions and random water cell locations.
The measuring system consists of a reservoir, hose ducts (for measuring liquid and reference air), as well as electronic pressure measuring sensors. The measuring points have a differential pressure sensor with a variable measuring range. A system diagram is shown in Figure 3. Each sensor detects the differential pressure between the head of the liquid and the atmospheric pressure. A vertical change of the sensor’s position results in an immediate altitude change of the sensor affecting the head of liquid and thus the pressure.
Figure 3 – System diagram of the Electronic Precision Hydrostatic Levelling System PC 500 (Position Control Dmbh, 2011)[13]
This principle works assuming the reservoir is installed outside the zone of influence. As the sensors provide data about height variation relative to the reservoir, if the reservoir is in inside the ZOI and is subject of any movement, a correction is required in order to not introduce bias, and to be able to convert the data into absolute vertical movement.
3. Project Information
3.1 Location
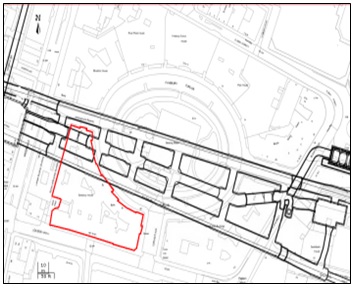
The subject area of Finsbury Circus between Barbican and Liverpool Street station is directly above the main Crossrail works in this area and consists of various Grade I and II listed buildings mostly converted to office blocks. Most buildings in the area are Grade II listed buildings. This article focuses on Salisbury House (shown in Figure 4), a grand office block in French Neo-classical style build in 1899-1902 with a ground floor and two basements. The structure is an eight storey building with two basements and is of load-bearing masonry construction with Bath stone with Portland stone dressings. It occupies an area of approximately 4823.51 m2.
Figure 4 – Salisbury House location from the tunnel works.
The inside of the building is a maze of corridors and light wells, which are not all accessible from each floor. According to the building floor plan, the inner load-bearing walls are distributed in such a way that the building itself could be broken into several other smaller structures.
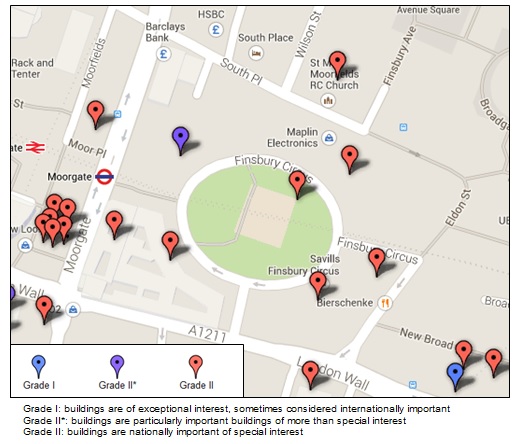
The zone of influence contains many other listed buildings (see figure 5) illustrating the need for a robust and comprehensive monitoring strategy. The other buildings around this one share many resemblances with it, in when they were constructed, building material, dimensions, and structure, therefore they are of national interest.
Figure 5 – Grade I, II* and II buildings.
3.2 Geological Ground Model
The geological ground model East of Liverpool Street CRL Station as presented in CRL internal document (C122-OVE-C2-RGN-C101-50004 Rev3), and is given in Table 1.
Stratum Design Top of Stratum Level (mATD) Thickness (m) Description Made Ground +115 5 Engineered fill, waste heaps, construction fill, demolition rubble and previous building foundations. River Terrace Deposits +110 4 Typically sand and gravel with clayey and silty sand sediments occurring locally as discontinuous beds, cobbles may also be present. London Clay +106 31 The London Clay is heavily over consolidated and can be divided into a number of units, with the lower units (A2 and A3) being more sandy than the upper units (B and C). Lambeth Group +75 17 The Lambeth Group comprises variable ground conditions both laterally and vertically. The Upper Mottled Beds and Lower Mottled Beds are the most clayey units and the basal Upnor Formation is the most granular. Thanet Sand +58 11 Silty fine to medium sand, with increasing clay and silt content in lower part of the formation. Chalk
+47 – Variably weathered and fractured pure white limestone with flint bands and marl seams. Table 1 – Geological Ground Model at Finsbury Circus, City of London. Taken from CRL internal documents C122-OVE-C2-RGN-C101-50004 Rev3
As can be seen, most of the geological units are either clays or sands belonging to the Lambeth Group or London Clay, similar to those described by (Burland, Standing, & Jardine, 2001)[5] in the case of the Jubilee Line construction.
3.3 Construction details
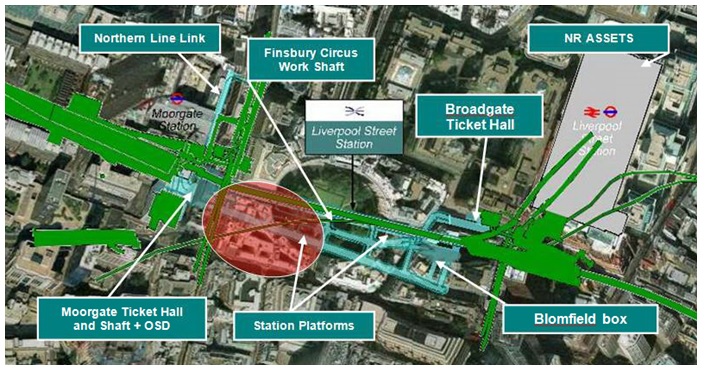
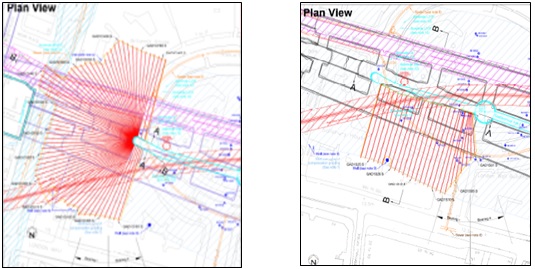
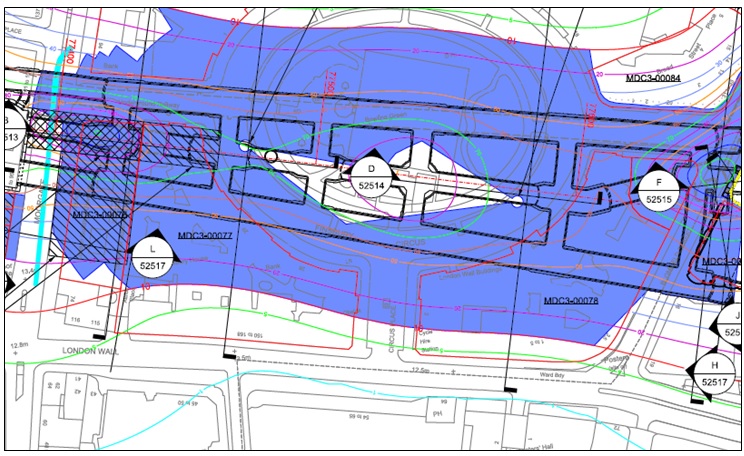
The construction works relating to the new Crossrail Station at Liverpool Street comprise of sprayed concrete lined (SCL) tunnels together with box and shaft excavations. These activities all have the potential to cause ground movements. Figure 6 shows the location of the Crossrail works in relation to the Salisbury House (shaded in red). Figures 7 and 8 detail the location of the Tube à Manchettes (TAM) for compensation grouting.
Figure 6 – Location of Salisbury House in relation to Crossrail works. Taken from CRL internal documents C122-OVE-C2-RGN-C101-50004 Rev3
Figure 7 & 8 – Drilling of arrays in Geotechnical Adit 1 (GAD1 chamber and GAD1 Southern array) at Liverpool Street Station for compensation grouting. Taken from CRL internal documents C510-BBM-C-GMS-C101-50017.
Figure 9 shows the extents of the predicted settlement in this area. Given the nature, range and extents of the excavations required, the risk of unacceptable damage remained significant, and that is why further mitigation measures were required, in this case through compensation grouting.
Compensation grouting comprises the injection of grout into the ground at an elevation between the source of movement (e.g. tunnels) and the building to compensate for the movements as they develop. Because of the rapid movements that can be generated while performing this activity, real time monitoring inside and outside of the building structure is required as discussed by (Kettle, Totty, McLachalan, & Hamelin, 2008)[10].
Figure 9 – Predicted settlement due to tunnel construction. 1mm settlement contour shown in Cyan.
4. Designing the system and linking of monitoring systems
Crossrail Contract C510 was responsible for the implementation of an I&M system which fulfilled the CRL requirements and the real time automatic data requirement for the Compensation Grouting Control System. The internal sensors (mainly Water Cells) were to be installed in the specific locations following the CRL specificationss, but were reallocated in order to suit what was indicated by the TAM layout. The intention being, to be able to see how the building reacted to specific grouting areas or TAM sections. Because of the high reactive ground in the area, and the uncertainty of the ground conditions and foundations underneath the buildings it was required to have a system that was able to provide settlement/heave data within the same grid.
For such a unique construction technique as compensation grouting where the ground reacts relatively fast (within minutes), the automatic monitoring system must provide automated data for the works to continue safely. This requirement could not be satisfied without a global monitoring system covering all the area.
The initial proposal to install one global water cell system to cover all the basement area was not possible at Finsbury Circus due to the system and building constrains (as explained in section 2). The advantage of this setup would have been the absolute guarantee that all the sensors would be related to the same reference, providing relative data in the same grid.
Following site visits to the specific buildings and discussion with the building owners,
CRL/BBMV concluded that a multiple water cell system approach as shown in Figure 10 would be required due to the following difficulties:
- Different levels within the same floor made it impossible for the water cells to be installed within +- 500 mm from the others (limitation given because of using the PC1000 water cell mode suggested by the supplier).
- Installation limitations given by the building owner, due to the fact that the sensors could be disturbed by the staff or visitors in the building if they were accessible and to the fact that some of them didn’t want the sensors to be visible at all.
- The sensors needed to be in foundation/structural walls/columns, in order to make sure that the building integrity was really monitored (instead of superficial finishings). Some of these were not accessible from the same floors.
- Maximum number of sensors and distance between sensors within one system. According to the manufacturer, one system (equipped with one reservoir and one reference sensor) is limited to approximately 10 sensors with an average 20m connection distance between each sensor.
In order to implement the systems under the above constraints some assumptions needed to be made:
- Load-bearing walls have the same settlement on different levels.
- Load-bearing walls have the same settlement on both sides.
- Differential behaviour of a load-bearing wall, on both sides, due to atmospheric factors is negligible.
A discussion on these important assumptions is given in Section 6.
Figure 10 – Water Cell system distribution. Salisbury House, from CRL internal documents, Installation report.
This approach culminated in multiple independent water cell systems which made it impossible to provide absolute movements. The only solution to overcome this issue was to link the different systems by assuming that a foundation/structural wall/column will have the same behaviour (settlement or heave) on both sides of the wall, even at different levels. Lateral movement in between levels was disregarded.
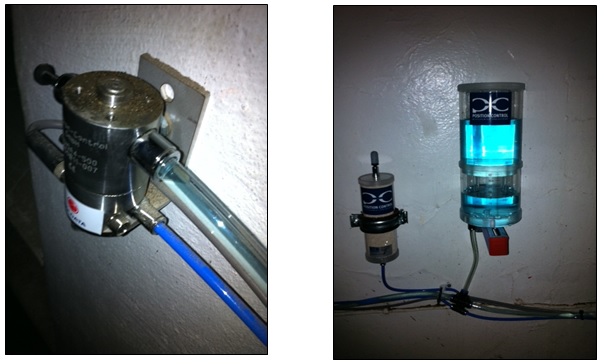
The reservoir itself also influences the data. Its water level is variable due to loss of water through evaporation and/or small leaks. The loss of liquid results in a fictitious vertical movement in the sensor’s data, which can be corrected by providing relative data through a reference sensor. A secondary factor to be taken into consideration is that a physical change in height of the reservoir will directly affect the system’s water pressure, introducing a non-genuine movement. In order to eradicate this issue, the reservoir was installed in conjunction with a water cell sensor.
Figure 11 – Samples of water cell and Reservoir with dehydrate installed in walls, from CRL internal documents (Installation report)
From the raw data we calculate the pressure which will be converted to relative vertical movement. The manufacturer provides the formula with the calibration certificate; the calculation used is given in Equations 1 and 2 below
Where:
SH = Vertical movement in mm
f = Calibration factors provided for each sensor by manufacture
x = Raw data in mA
SHRel = Relative vertical movement in mm
SHinitial = the first reading following the installationSplitting the system into smaller sub-systems solved all the difficulties relating to maximum number of sensors, maximum distances between sensors and the limited measurement range. Following these principles, there is no limitation in the number of systems that could be used for the internal building monitoring.
Another important factor to consider in order to avoid possible errors is to ensure that the reference water cell has a means of assuring that they haven’t moved. In the case of Finsbury Circus this was achieved by placing reference water cells in the same location as the external systems (RP’s), assuming that both sides of the structural wall to which they are attached behave the same. The same assumption had to be made on the linking sensors between different systems, even if they were in different levels and/or structural walls.
These assumptions assisted the technical team to overcome the issue that the building wasn’t able to be instrumented with just one water cell system, but not the fact that the entire building was inside of the zone of influence (ZOI), which made it more difficult (but not impossible) to automatically have all the structural-ground information in the same grid (CRL grid).
This solution using several systems increased the amount of data loggers and modems required for the data transfer. The synchronization of the data saved in separate data files challenged the data manager team and needed a complex data storage and data process.
In order to solve the problem of the separate grid systems, the monitoring contractor’s team decided to apply the same assumption used in order to link the different water cell systems by linking with internal water cell to an outside prism sharing an outside wall. The formula was afterwards revised and implemented in the live system by the data team.
In order to calculate the absolute movement inside the buildings Equation 3 was used:
Where:
SHabs = absolute level of water cell in mm
SHrel1: relative vertical movement of the water cell sensor No.1 in mm
SHref: relative vertical movement of the reference water cell sensor of the each system in mm
RP: absolute level of the prism linked to the water cell system via the reference sensor in mmEquation 3 can be used if we suppose that in the moment of the installation the absolute movement of the area being surveyed by the water cell system is everywhere equal to the actual absolute vertical movement of the prism.
As a result for the whole ZOI area it was possible to provide continuous absolute monitoring data with one hour of reaction time.
The complete process included:
- Integration of the sensor data coming from the data loggers
- Integration of the RTS data coming from the Least Square calculation
- Re-exportation of all the necessary data for water cell absolute values (SHabs)
- Integration of the SHabs data following the additional calculation process (detailed above)
4.1 Salisbury House – example for the absolute movement calculation
Sensor naming: SH102XY where X is the numbering of the water cell system and Y is the numbering of the sensor inside each system.
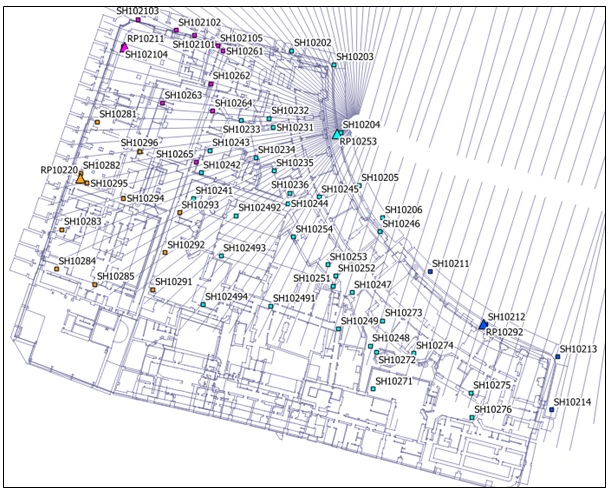
The Water Cell systems closest to the facades are linked to the monitoring prisms meanwhile the systems inside the building are linked to another Water Cell system. Concerning Salisbury House there are 4 prisms being used as reference points for the absolute movement calculation. In total there are 4 calculation systems (see figure 12 below).
Figure 12 – Sketch of water cell distribution and reference points used in the sensor different alignments. Up to 10 different systems in within Salisbury House and its annexed building Electra House
Example for the complexity of the calculation:
- Water Cell system No. 10 (SH102101-105) is linked to the prism RP10211 through the sensor SH102104
- System No. 6 (SH10261-65) is linked to system No. 10 by supposing that SH102105 and 10261 are moving identically
By the chain calculation detailed above it is possible to determine the absolute vertical movement of the sensor SH10265 for example which is located in the middle of the basement of the building.
5. Data representation and interpretation
5.1 Water Cells
5.1.1 Relative movement compared to the reference level of the reservoir.
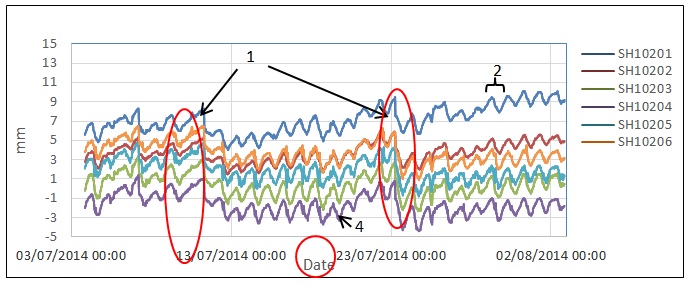
Time graph 1 (Figure 13) is a good illustration of the non-genuine movement due to the following different factors:
- The automatic refilling system of the reservoir. This movement remains negligible until the moment the reservoir has enough spare liquid for the refill. As soon as the liquid level of the reservoir decreases under the critical level this non-genuine movement will breach the measurement range. Therefore regular maintenance work is required in order to maintain the required amount of liquid.
- Daily variation due to weather related issues. This movement remains cyclic, but in the longer term can develop trends, depending on how isolated or weather sensitive the structure is where the water cell is attached to.
- Distance from the reservoir within one system
- External vibration/ventilation system can increase the noise of the data (causing a thicker line in figure 13).
- Amount of water cell systems used for the absolute movement calculation (more systems are included, more data noise/error will be integrated.
Figure 13 – Water cell data before correlating them to a reference water cell. Numbers related to errors listed above
5.1.2 Relative movement compared to the reference sensor SH10204
By using a reference sensor within the water cell system we can eliminate the non-genuine movement/noise coming from the system itself. The time graph given in figure 14 below represents the same data as the previous one but the relative movement is compared to the reference sensor. The data curves become smoother and the genuine movement is more evident.
The disadvantage of this thesis is that we consider the reference sensor stable. In our case it is not the right assumption as the whole building is within the ZOI.
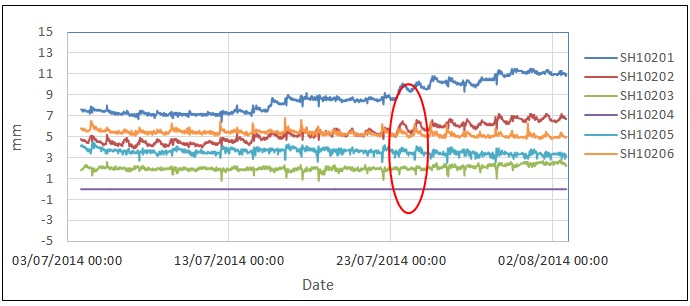 Figure 14 – Water cell data relative to a reference water cell.
A cyclic daily variation is still noticeable, but on a much smaller scale, as in general, the structures tend to behave similarly. The remaining oscillation relates to the different behaviour of the reference compared to the other ones the period of a day.
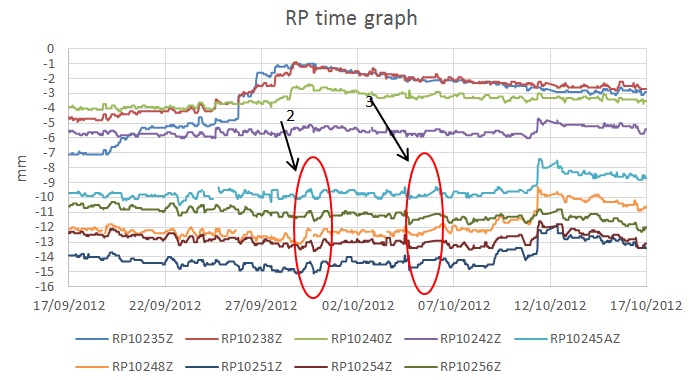
5.2 Prisms (RP)
Errors associated with the RP point, see Figure 15:
- Amount of RTS’s included in the group calculation, the higher the number of RTS’s, the higher the final error that can be made from the shared points.
- Network inherent signature. The amount of points, the quality of the readings, and visibility of the prisms over 24h will be an important factor in the robustness of the network adjustment. The bigger the network signature (inherit signature error due to network geometric and environmental conditions), the bigger potential for variation in the monitoring prism data over a 24h period.
- Visibility of the prism. As the prism chosen as reference of the water cell system has to be the closest possible to the sensors, usually the low-level prisms are selected – therefore external obstruction and vegetation could potentially be in the way of the line of sight. This could cause variance or gaps in the data.
- Possible knocks.
5.3 Levelling BRE and Levelling point (LP/LC/LB)
The possible errors due to manual monitoring won’t be discussed more than what they have in section 2.2 as for this article they have been just a means of checking through a different system with different methodology that the data provided though the automatic one is correct. Figure 16 shows the data for the LC against time.
We have assumed that best practice was used, and that they provide data within the accepted accuracy and repeatability standards.
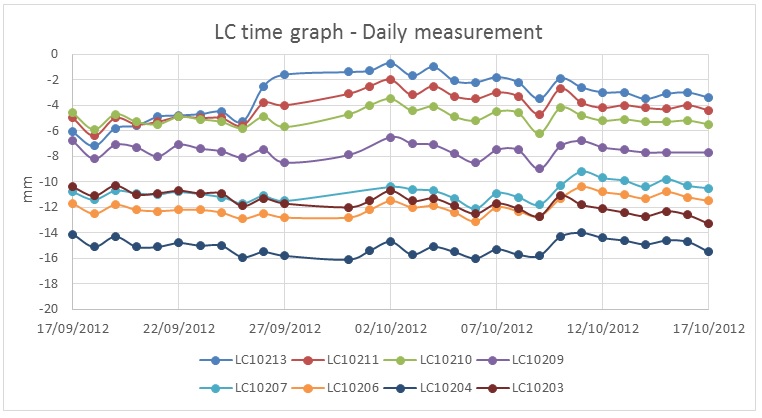 Figure 16 – Invar (LC) data against time
5.4 Water Cells associated to RP’s
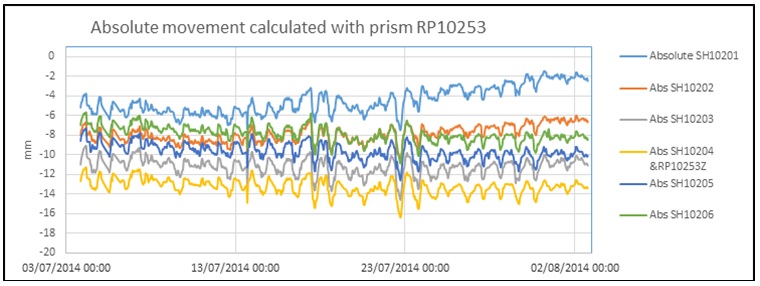
With the combination of the water cell system (relative movement compared to a sensor) and the automatic surface monitoring system we are able to determine absolute vertical movement inside the building. This has a huge benefit for the project, especially if the construction phase requires the high frequency data for ground movement assessment. The system is not without fault as by combining different sorts of system, the noise of the final calculation will increase as explained in Section 4.
The noise/errors present in the regular RP’s are now shown in the SH plots, plus any other movements registered in the different locations, as shown in figure 15.
Figure 17 – Water cell data linked to a prism providing movement on an absolute grid.
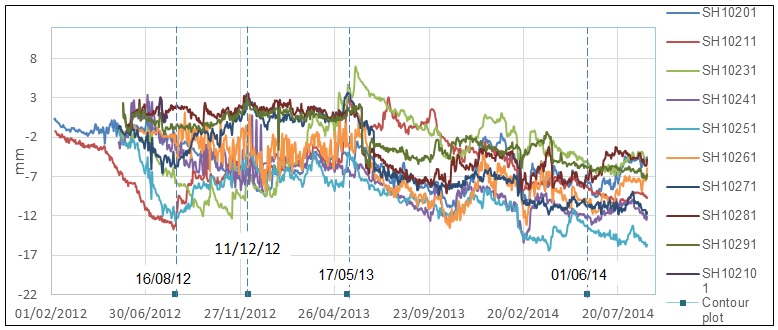
Figure 18 is a timegraph showing a global view of the vertical movement of the building since February 2012. The graph contains one sensor per system for clarity.
Figure 18 – Structural movement as recorded by water cells of different systems within Salisbury House Data corrected using RPs outside of the ZOI to give absolute movements.
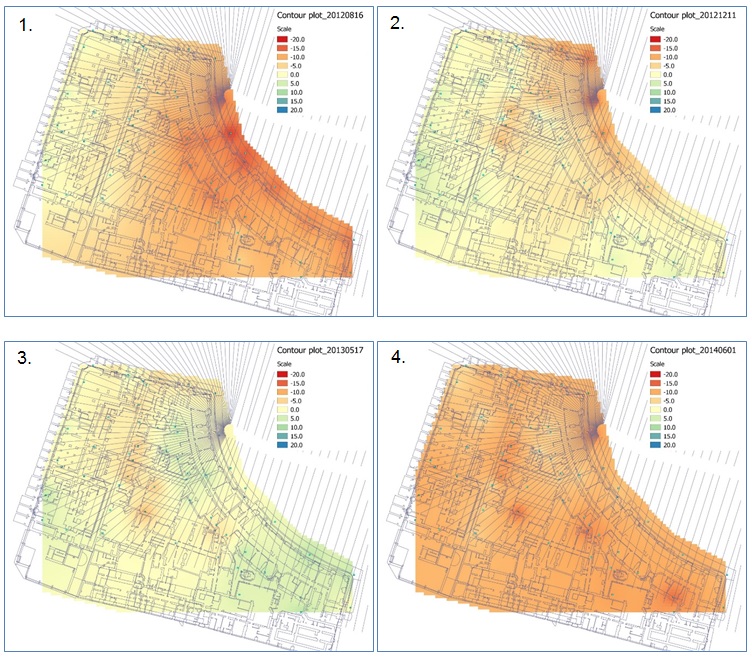
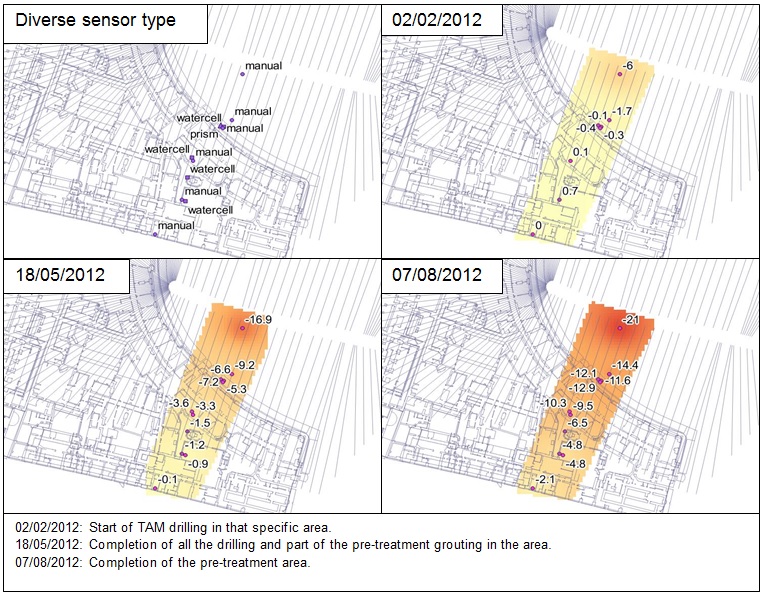
For a better understanding four dates have been chosen to be represented on contour lines plot. The dates correspond to the main phases of the construction in the ZOI of the building.
- 01/02/2012 – Settlement due to TAM drilling under the salisbury House
- 16/08/2012 – End of TAM drilling under Salisbury House – Heave due to start of the pre-compensation grouting. Ground relaxation after every grouting session.
- 11/12/2012 – Compensation grouting under the East half of the building in order to correct the settlement due to the TAM’s drilling. Once more heave and relaxation patterns.
- 17/05/2013 – Compensation grouting under the whole building while tunnel construction. The plots show how ground movement is controled during construction in order to mitigate structural damage in the building.
- 01/06/2014 – Actual status following the settlement due the other site construction phases
Figure 19 – Contour plots of structural movement as measured by water cells of different systems during different construction phases.
The main objective of this process is to avoid any differential settlement that could cause a risk to the structural integrity of the building.
5.5 Deflection calculation
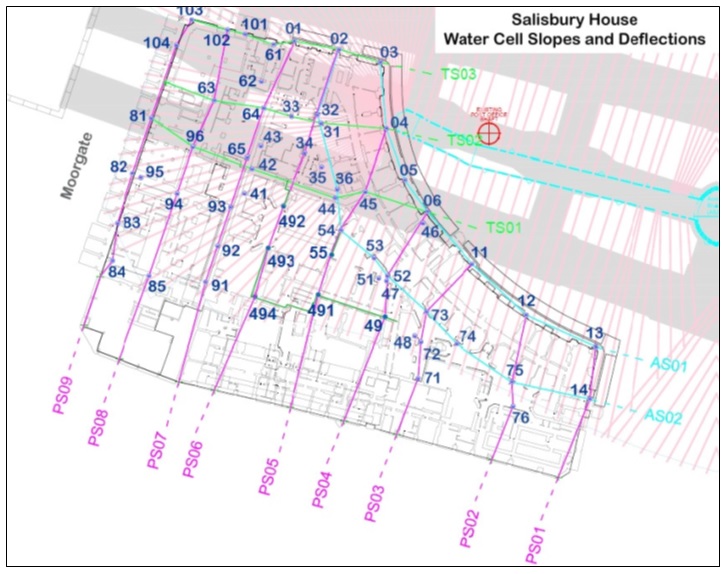
As explained in section 2, deflection ratio is one of the factors that are critical in order to assess structural damage, this has been discussed by (Boscardin & Cording, 1989)[2] and (Burland, Broms, & de Mello, 1978)[4]. By having all the measurements in the same grid we are able to calculate deflection and slope among the sensors. The deflection profiles were created to follow the TAM arrays and either be perpendicular to/parallel to the tunnelling; or following principal structural elements of the building, as shown in figure 20.
Figure 20 – Building array selection for deflection and distortion analysis (from CRL internal documents CTC Minutes)
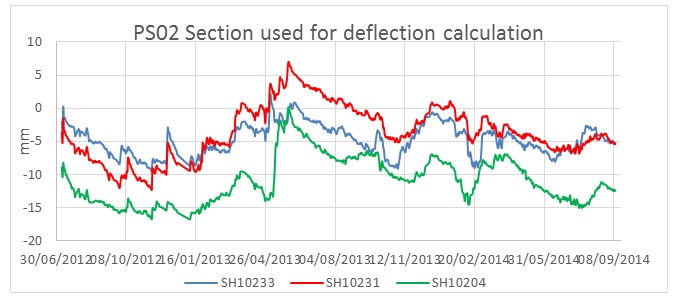
Figure 21 shows the absolute water cell data used in the deflection ratio calculation and Figure 21a shows the calculated deflection ratio for this data. The calculation for the deflection ratio is expressed in Equation 4 as:
Where:
DR = Deflection Ratio
SH1 – 3 = Water Cell Number
D13 = Distance between SH 1 and 3
D23 = Distance between SH 2 and 3
D12 = Distance between SH 1 and 2Figure 21 – Water Cell data used to calculate deflection ratio at TS02 transect
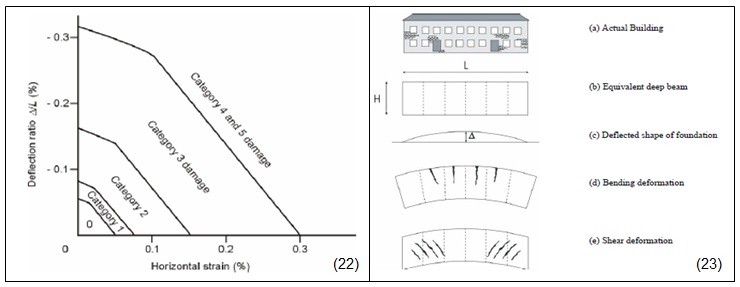
![Figure 22 & 23. (Burland, Standing, & Jardine, 2001)[5]. Relationship of damage category to deflection ratio and horizontal strain from hogging (22) and model of cracking of a simple beam in bending and in shear (23)](https://learninglegacy.crossrail.co.uk/wp-content/uploads/2016/09/7D-022-Figure-21a.jpg)
Figure 21a – Deflection ratio for the water cells at TS02 transect
Deflection will flag differential settlement in one load-bearing wall. The point of maximum recorded deflection will be the point with maximum stress / compression, an indication that structural damage may occur.
Figure 22 & 23 – (Burland, Standing, & Jardine, 2001)[5]. Relationship of damage category to deflection ratio and horizontal strain from hogging (22) and model of cracking of a simple beam in bending and in shear (23)
6. Discussion and analysis
After describing the different systems used, the constraints and the assumptions made in the calculations, the intention of this section is to justify the reliability of the linked monitoring system.
The clearest way to demonstrate that two or more sensors of different types are behaving in the same way while monitoring a specific location is by comparing and analysing the results over time. It should be noted that although the automatic monitoring is now connected to the same grid by external references, the manual monitoring comes from a different grid and different references/benchmarks (through precise levelling as described in section 2.2). By using two reference systems it is possible to test the assumption made in the automated solution.
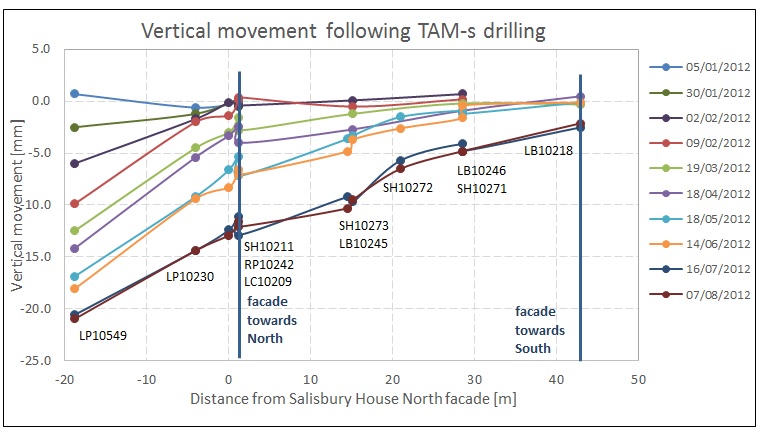
Figure 24 – Position graph between 05/01/2012 and 07/08/2012
The drilling of the TAM arrays along with the grouting have been chosen to test the consistency of the assumptions as they represent the best example of a quick reaction in the ground and structure.
Figure 24 shows a profile encompassing ground monitoring and structural monitoring through Salisbury House directly above the TAM’s array PS03. This profile is representative of the building behaviour as it is contains all of the different kind of sensors used and uses water cells from two different systems (Systems 1 and 7).
The plot shows the history of all sensors from before any drilling was done until the end of the drilling under Salisbury House.
LP10549 and LP10230 are ground monitoring leveling points installed in the road and pavement, close to the compensation grouting tunnel where the drilling was starting from. They show the quickest and biggest reaction to ground settlement. It should also be noted that some of the settlement recorded is due to the construction of the Geotechnical Adits themselves.
SH10211, RP10242 and LC10209 are installed in the same load-bearing wall, at different levels. The SH was installed in the exterior lightwell at basement level, the LC was installed arround 1.5m above ground level, and the RP was installed about 5m from ground level. Although they are not exactly in the same location, the plot indicates that they all show the same settlement in the same time frames. This proves the first of the assumtions listed in point 4.
SH10273 and LB10245 are installed close to each other. The water cell SH10273 is installed in the load-bearing wall, at approximately 1.8m from the ground floor. LB10245 is located a few centimeters above the ground floor of the load-bearing wall. This shows as well, that the ground floor behaves as the load-bearing walls. A similar example is LB10246 and SH10271.
As can be seen the difference in position with time between the different systems is minimal, and always less than the monitoring accuracy, even if they come from a different reference grid.
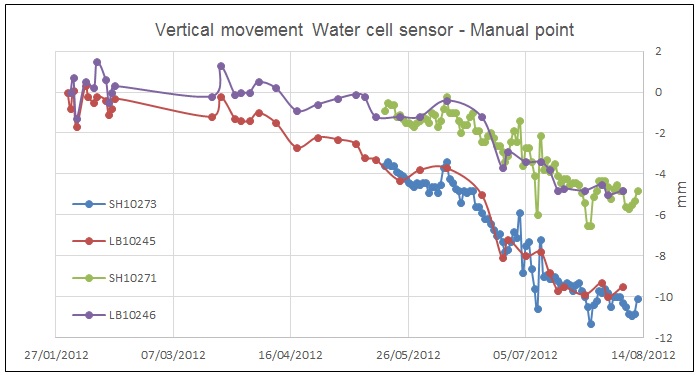
Figure 25 – Time graphs comparing SH-LB movement
Figure 25 shows the evolution of water cells against leveling BRE sockets in more detail. The difference between one and the other is within the system’s monitoring accuracy. All of these sensors are installed inside the building.
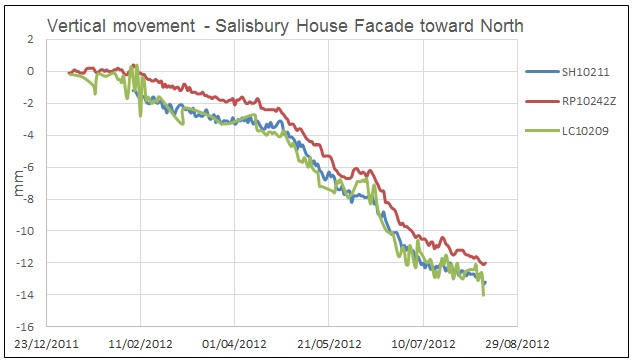
Figure 26 shows the evolution of water cells (SH) against prisms (RP) and invar scales (LC) in more detail. Once more they all have similar behaviour, although in this case the RP, installed much higher, is consistently 1 mm above the other sensors (although this could be a base line issue).
This proves that the load-bearing walls have the same settlement on both sides, and that the atmospheric conditions, which have a big impact on the sensors and structures, do not have any differencial behaviour on either side of the walls.
Figure 26 – Time graphs comparing SH-RP-LC movement
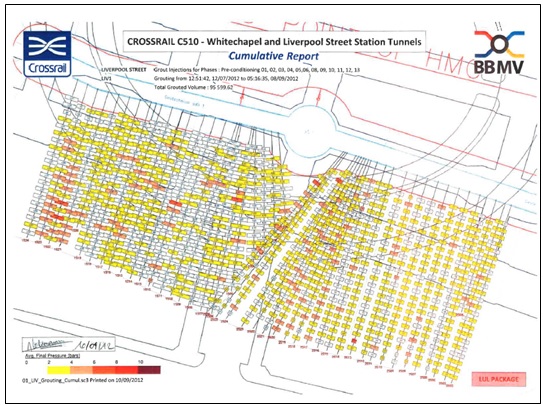
Figure 27 below shows the cumulative injected grout volumes and average final pressures in the Southern area of Finsbury Circus, underneath Salisbury House and London Wall.
Figure 27 – Compensation grouting “Cumulative Report” in the South of Finsbury Circus (from CRL internal documents C510-BBM-C-GMS-C101-50017 Rev2)
Each of the small boxes in the drawing represents a grouting point along the TAM. The graduations in colour indicate the intensity of grouting pressure. Not legible, the volumes per sleeve port are written inside each small box.
Figure 28 – Settlement evolution over time, and from drilling point.
By monitoring settlement on daily basis, the contractor is able to calculate the ground volume loss. This information is monitored every 30 minutes, and is used to monitor the structure and ground response in order to mitigate any possible consequences. Figure 28 shows the settlement over time in a heat map contour plot.
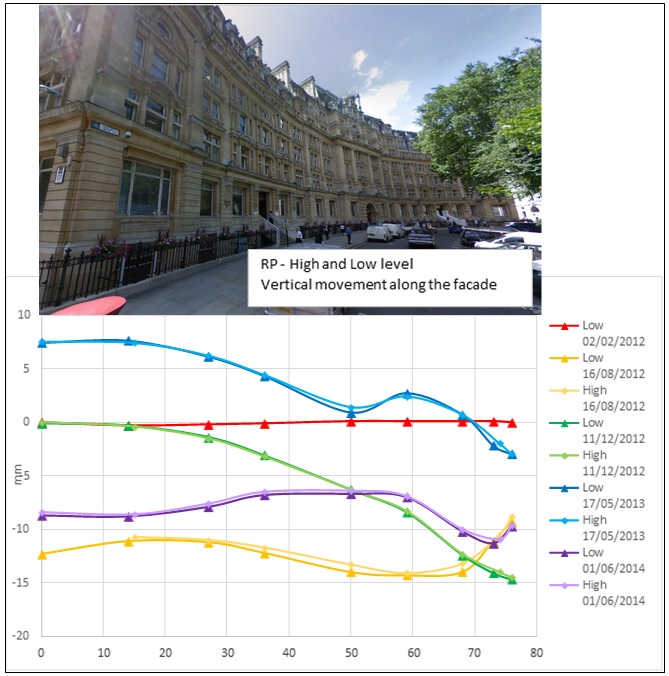
Figure 29 shows how the different level prisms behaved over time. It can be seen that not only do the prisms in different level show the same trends and behaviour, but also the absolute values match. This suggests that the load-bearing walls are not absorbing any of the settlement, and that in reality any could be used to link to the water cell system.
Figure 29 – Settlement across the main facade towards Finsbury Circus, closest to the construction shaft and grouting tunnel.
7. Conclusions
This paper presents some new interesting features and approaches in Instrumentation & Monitoring.
The concept of being able to measure absolute settlement inside labyrinthine buildings utilising water cells was approached by the Principal Contractor, Client (designer), and I&M subcontractor with the aim of providing a world class service and added value. It is this collaborative approach that has led to the quality of the final results which were achieved and have been presented in the Paper. Without this commitment from all parties the final results could not have been achieved.
A set of assumptions were discussed and put on the table, and in the discussion of this Paper they have been demonstrated to be correct, even if the noise coming from the inherent functionality of each system made the comparison sometimes difficult. This Paper introduces a way of achieving extensive absolute real time monitoring grid in areas where real time monitoring is required, and where optical systems with references out of the zone of influence are difficult to implement.
The final accuracy and repeatability achieved by this combined system will mostly depend on the one provided with the optical system, as it is less accurate and has more sources of noise compared with the water cells, but as demonstrated, if a good adjustment and process is used by the monitoring company, a repeatability of less that 0.2 mm is possible. This makes it possible even to have an idea of how different areas are affected by thermal variation.
The main points in order to achieve this final result were:
- A collaborative approach and understanding from Client/Principal Contractor/Subcontractor.
- Better understanding and detail of internal distribution of load-bearing walls and building segmentation, than at the design stage.
- Better understanding of the specific building owner requirements and/or constrains.
- Reliable optical real time monitoring package (in terms of raw data treatment and post processing).
- Overlap with traditional levelling from different benchmarks for comparison and verification.
- Define TAM design in order to set up internal sensor distribution.
This set up was successfully implemented in 8 buildings, along with 43 water cell systems. In total, 302 water cell sensors were used in order to be able to provide internal monitoring in foundations, main structural columns or load-bearing walls. It is worth mentioning that other particularly difficult buildings that were also instrumented with this system as part of Crossrail’s I&M Strategy. Buildings include; London Wall Building, Electra House and Britannic House in Liverpool Street area, and The Albion Brewery at Whitechapel area, any of which would make good case studies for separate articles.
It should be pointed out that the reliability of both systems depend on a well planned maintenance scheme in order to assure that neither prisms or water cells provide erroneous data from the following:
For prisms;
- Network deviations/bias
- RTS related issues
- Spiky data related to poor lines of sight
- Hot air layers
For water cells;
- Air bubbles in the system.
- Leaking/evaporation of water in the system
- Knocks
In the future the designer should take this kind of set up into consideration for internal monitoring in areas with extensive zone of influences whilst taking in to account all the points explained in the article in order to tailor the best possible solution.
8. References
- Atterwell, P. B., Yeates, J., & Selby, A. R. (1986). Soil movements induced by tunnelling and thier effects on pipelines. Chapman & Hall.
- Boscardin, M. D., & Cording, E. J. (1989). Building Response to excavation-induced settlement. Journal of Geotechnical Engineering.
- Burland, J. B. (1995). Assessment of risk of damage to buildings due to tunnelling and excavations. Proceedings, 1st International Conference for Earthquakes and Geotechnical Engineering.
- Burland, J. B., Broms, B. B., & de Mello, V. F. (1978). Behaviour of foundations and structures. 9th International Conference on Soil Mechanics and Foundation Engineering. Tokyo: Building Research Establishment.
- Burland, J. B., Standing, J. R., & Jardine, F. M. (2001). Building response to tunnelling. ICE Publishing.
- Chueca Pazoz, M., & Herraez Boquera, J. (1996). Metodos topograficos.
- (198). The control of risk through improved contract practices – Report 79. CIRIA.
- Cuevas, M., Zarzosa, L., de Las Nieves, M., Andres, N., Amparo, M., Ripol, G., et al. (2012). Ensayo a escala real de varias técnicas geomáticas de monitorización de movimientos de edificios. Congreso Iberoamericano de Geomática y Ciencias de la Tierra. Madrid: Ilustre Colegio Oficial de Ingenieros Técnicos en Topografía de España.
- Dunnicliff, J. (1994). Geotechnical instrumentation for monitoring field performance.
- Kettle, C., Totty, R. J., McLachalan, P. V., & Hamelin, J.-P. (2008). King’s Cross : underpasses under high protection. Travaux, 853.
- Lance, G. A., & Anderson, J. M. (2006). The Risk to third parties from bored tunnelling in soft ground.
- McCormac, J. C. (1983). Surveying Fundamentals. Prentice Hall PTR.
- Position Control Dmbh. (2011). Hydrolstatic Levelling Cell System Type PC500 – Information Sheet. Friedrichsthal: Position Control Dmbh.
- Serratrice, J. F., & Magnan, J. P. (2002). Surface settlement analysis and prediction during construction of the Toulon Underground Crossing’s northern tunnel. Bulletin Des Laboratories des Ponts ar Chaussees, 237.
- Wilkins, R., Bastin, G., & Chrzanowski, A. (2003). Alert: A fully automated real time monitoring system. Proceedings, 11th FIG Symposium on Deformation Measurements.
-
Authors
-
Acknowledgements
Alastair Cruickshank, Morgan Sindall
Carl Bradley, Morgan Sindall
David North, Morgan Sindall
Elena Gavazzi, Arup
Richard J. Trotty, BacSol
Michael Maron
Yanta Ghale, SDL
Francis Trinkler, SDL

![Figure 3: System diagram of the Electronic Precision Hydrostatic Levelling System PC 500 (Position Control Dmbh, 2011)[13]](https://learninglegacy.crossrail.co.uk/wp-content/uploads/2016/09/7D-022-Figure-3.jpg)
