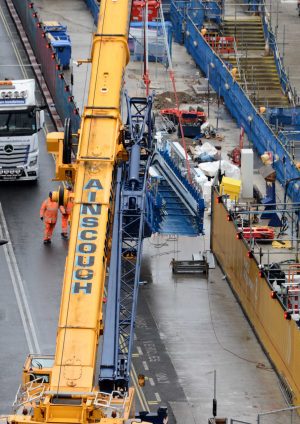
The dataset below provides all the data collected from a sample of the main central project sites on the movement in and out of site by HGVs. The data is broken down by date and material being moved.
A set of sample dashboards from a selection of stations shafts and portals is included to demonstrate how Crossrail utilised the data collected. The data was collected each period and period 2 from two different years is shown for comparison.
In addition, a dataset for the period 2012-2017, identifying the complaints for lorry controls and traffic and lorry planning, is also included. Over this 5 year period there were a total of 253 complaints covering 37 sites, across all stations, shafts and portals.
This suite of data can be used to examine the lorry movement on the Crossrail sites and how that impacted on the local areas. All of the agreed lorry routes used for the affected boroughs are also available in a related document.


